Joe Biden, who has always been a compulsive liar but at least sounded cognicent, is now babbling and whispering that Bidenomics works. But for who?
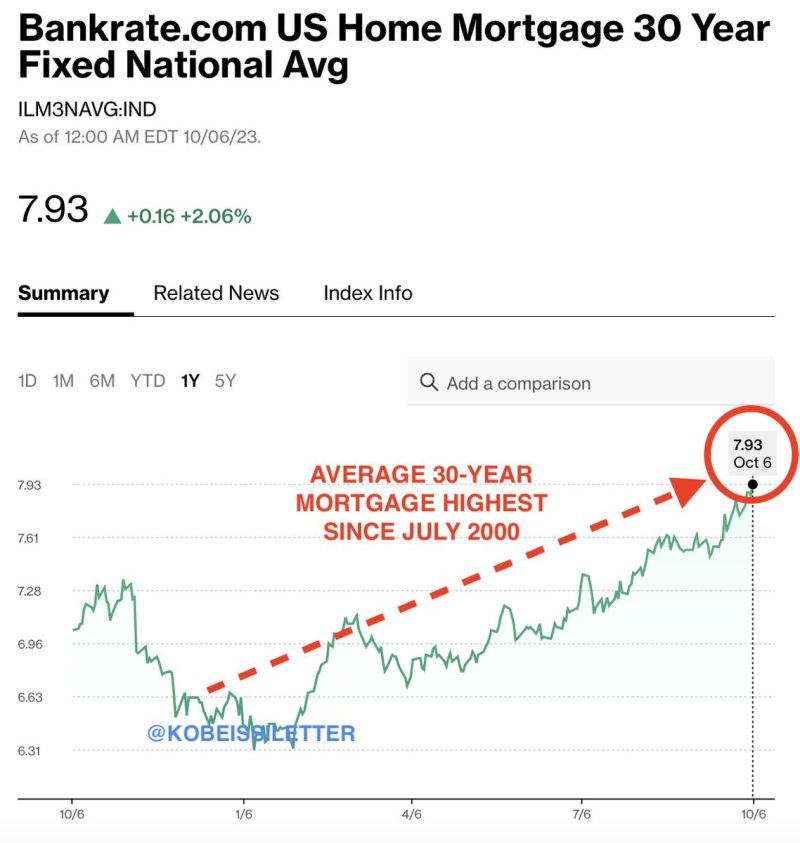
Clearly not for first time homebuyers or people looking to move. Bankrate’s 30-year mortgage rate is up to almost 8%, the highest since July 2000 and Willy Slick Clinton. That is a 176% increase in mortgage rates under the most inept “Economic Sheriff” in history.
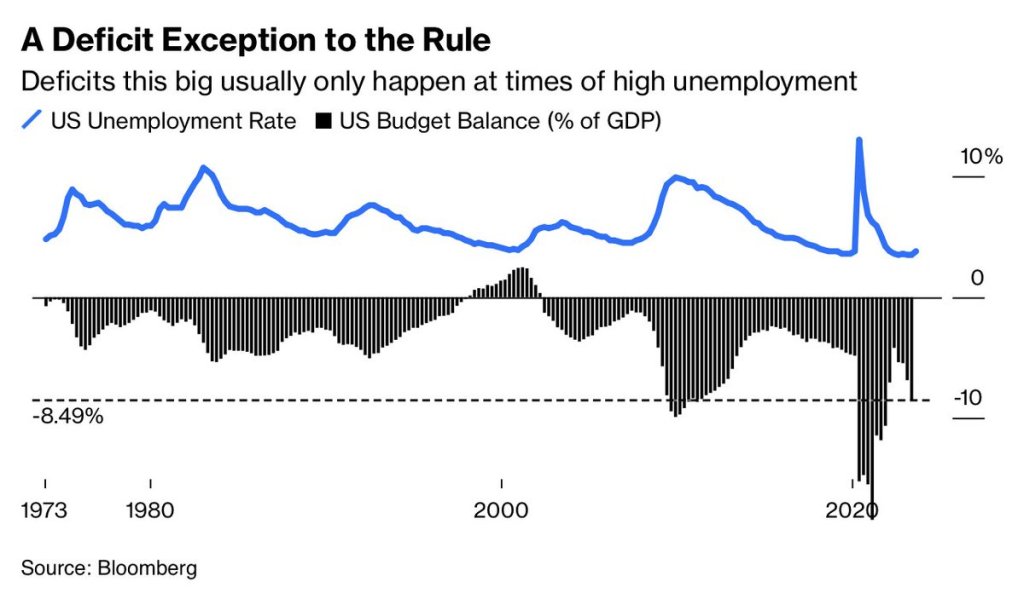
Deficits? Deficits (which Biden makes outlandish claims) are usually only this big at times of HIGH unemployment and recessions. So, are the staggering deficits under Biden a precursor to a hard landing (recession)? Don’t listen to what Biden or KJP say!!!
Biden’s outlandish claims that he single handedly reduced the deficit by the most in history is, well, typical Biden bloviating. Actually, tax receipts soared after Covid lockdowns ended. Period. Now that stimulus is wearing out, deficits are climbing again.
As Biden sleeps through the Hamas invasion of Israel, that is nothing new. Biden is sleeping through a disastrous downturn in the economy and pretending that Bidenomics is working. It isn’t Joe!
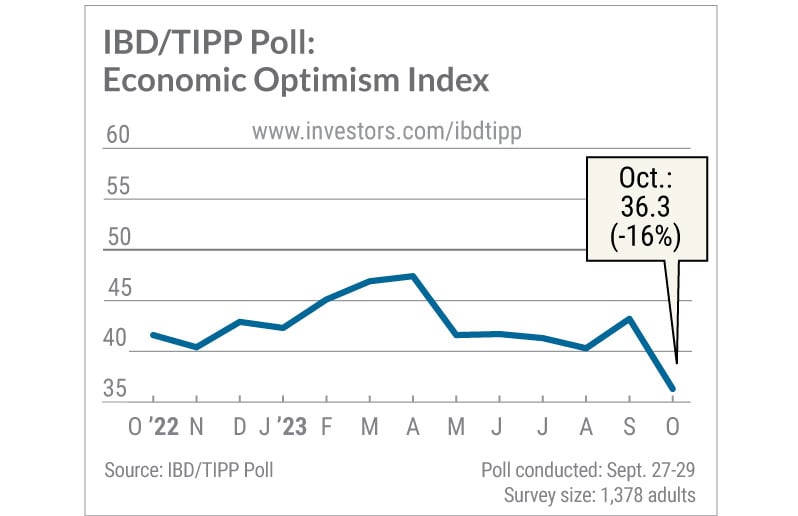
The IBD/TIPP U.S. Economic Optimism Index sank to a 12-year low in October as confidence in the near-term economic outlook crashed to the lowest level in the poll’s history. The survey casts doubt on the Federal Reserve’s justification for turning more hawkish last month: robust consumer spending.
The overall IBD/TIPP U.S. Economic Optimism Index dived 6.9 points to 36.3, the lowest since August 2011. Readings below the neutral 50 level reflect pessimism. The 6-month economic outlook index cratered 9.6 points to 28.7, a record low since the IBD/TIPP Poll began in early 2001.
That means the outlook suddenly appears worse than it was at the depths of the dot-com crash, the great financial crisis and the coronavirus pandemic.
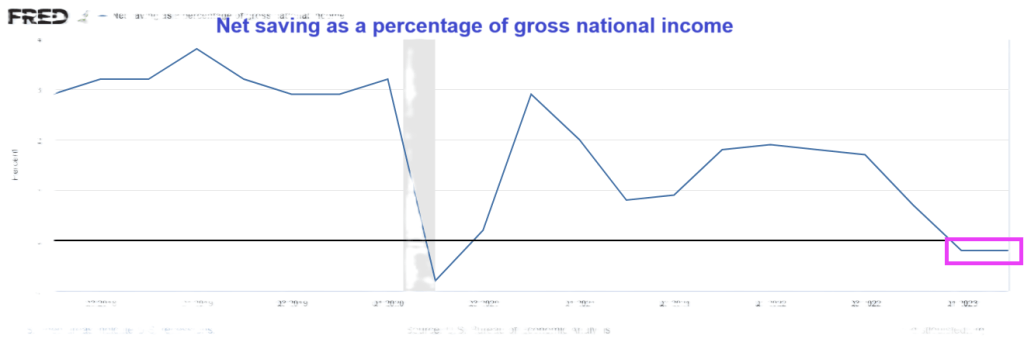
And on the personal savings front, net savings as a percentage of gross national income was negative for the second straight quarter.
Sleepy Joe, wake up! The US economy is slowing down REALLY fast!
Hey Bartender! The leading employment gain under Bidenomics was … low paying leisure and hospitality jobs at 96k jobs added.
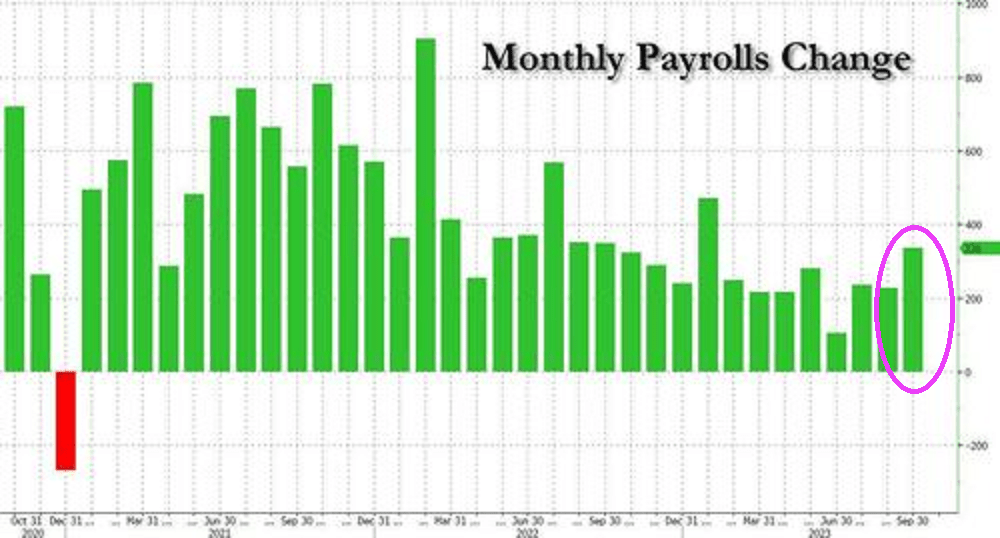
The US added a whopping 336K jobs, the highest monthly increase since January. This is surprising given that the ADP report was so weak.
And the BLS decided to UPWARD revised past numbers. The BLS revised not only August but also July higher: the change in total nonfarm payroll employment for July was revised up by 79,000, from +157,000 to +236,000, and the change for August was revised up by 40,000, from +187,000 to +227,000. With these revisions, employment in July and August combined is 119,000 higher than previously reported.
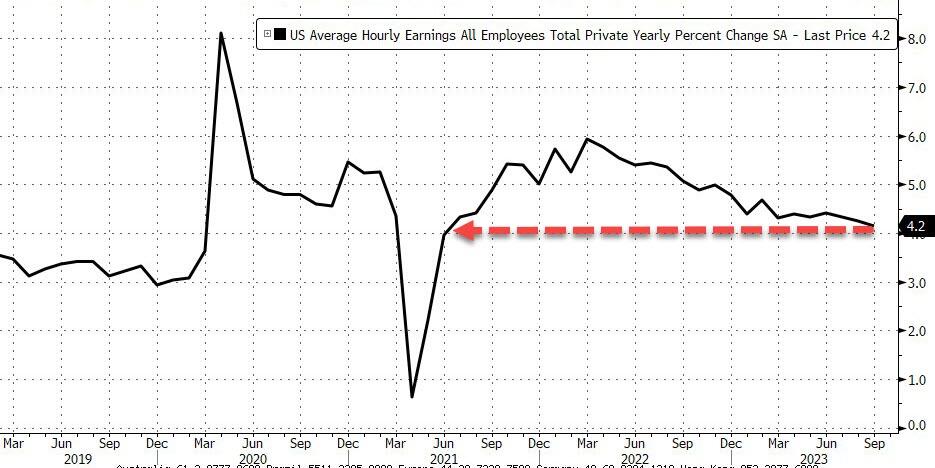
Meanwhile wage growth continued to cool, and in September average hourly earnings increased 0.2%, below the 0.3% expected, and resulted in a 4.2% increase YoY, down from 4.3% in August…
… as a result of a big bump in lower paying jobs.
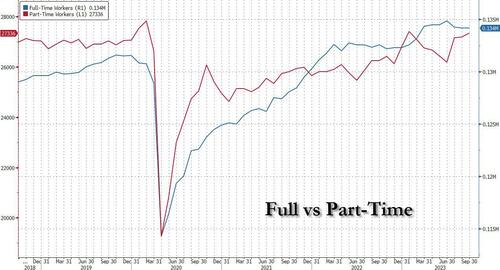
But perhaps the most remarkable divergence in the report is that with headline payrolls surging 336K (establishment survey), the Household Survey indicated that the pain continues, as the number of people employed not only rose by less than 100K (86K to be precise), but it was all part-time workers, which increased by 151K. Full-time workers? Why, they dropped by 22K, and the lowest since February.
Leisure and hospitality added 96,000 jobs in September, above the average monthly gain of 61,000 over the prior 12 months.
But the jobs report highlights Bidenomics. Lots of government jobs and the private sector getting crushed. +1 million government jobs, -400K non-government.
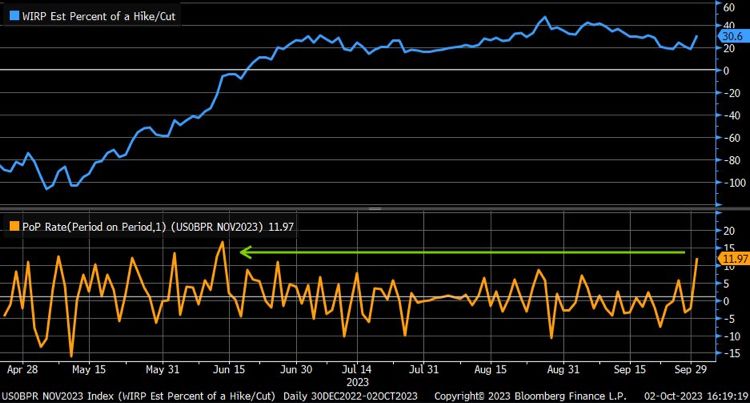
Hmm. How will The Federal Reserve view this report? Focus on the red-hot headline gain of 336k job added or the fact that it is mostly part-time jobs added? Odds of a rate HIKE rise to 44% after September jobs report and Fed PAUSE expectations have been extended.
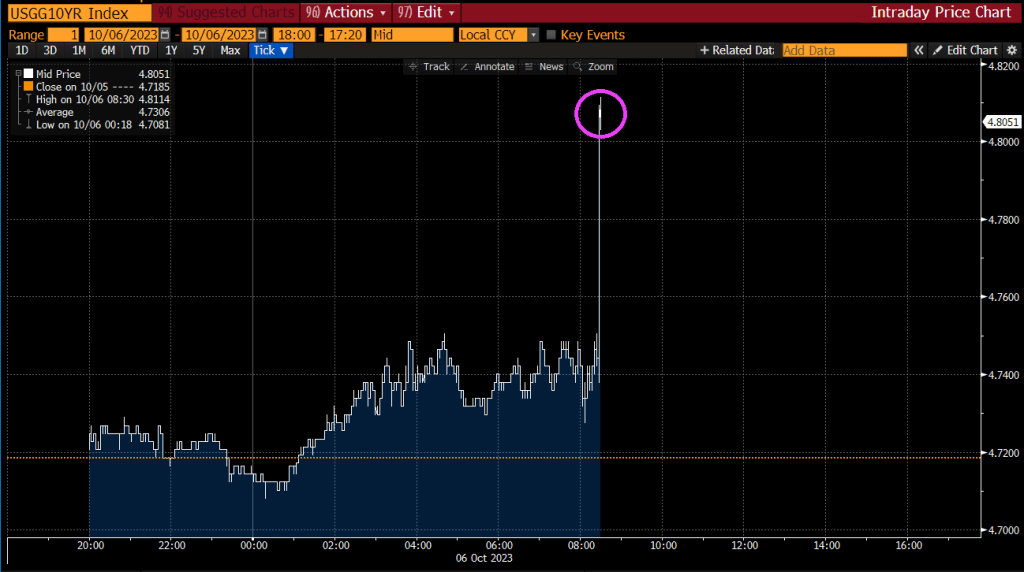
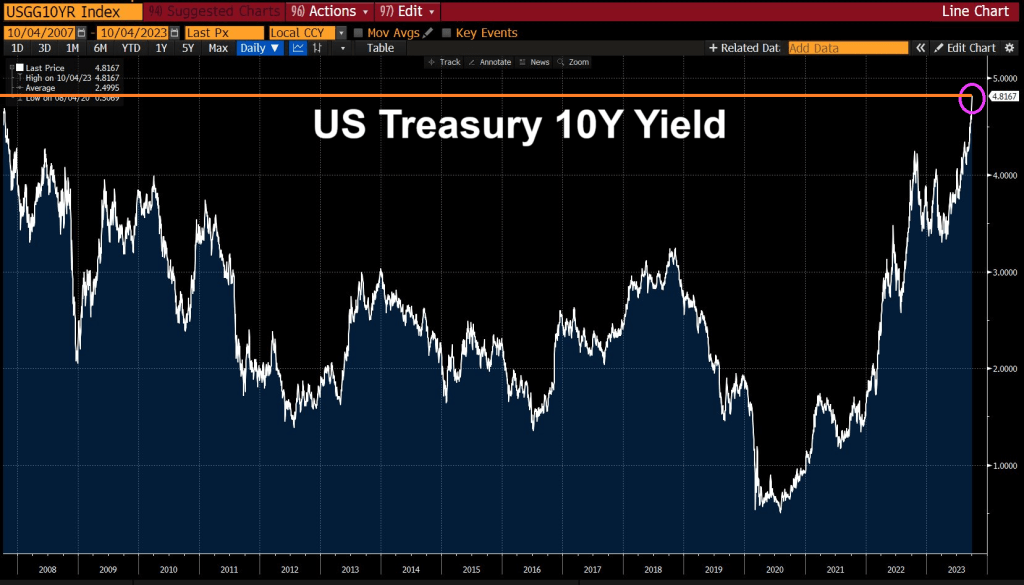
After the jobs report, the US Treasury 10Y yield soared.
The 10-year Treasury yield has risen dramatically under Biden’s Reign of (Economic) Error.
The Fed erroneously does not consider rising home prices as inflation. Here’s the result in pictures.
Case-Shiller national and 10-city home prices vs CPI, Rent, and Owners’ Equivalent Rent
Chart Note
Case-Shiller measures repeat sales of the same home over time. This ensures an accurate comparison of room size, yard size, and amenities. The only drawback is the data lags a bit. The most current data is from July representing transactions in May and June.
OER stands for Owners’ Equivalent Rent. It’s the price of rent one would pay to rent one’s own house, unfurnished without utilities.
For 12 years, home prices, OER, Rent, and the overall CPI all rose together. That changed in 2000 with another trendline touch in 2012. Then it was off to the races as the Fed did round after round of QE, suppressing mortgage rates.
Case-Shiller Home Price vs Hourly Earnings, the CPI, and Rent
Case-Shiller national home prices vs CPI, Rent, and Average Hourly Earnings.
As with the previous chart, for 12 years, home prices, rent, the overall CPI and hourly earnings all rose together. That changed in 2000 with another trendline touch in 2012.
How Much Are Homes Overpriced?
If the 12-year trend of home prices rising with average hourly earnings stayed intact, the home price index would be 211, not 308.
From that we can calculate home prices are ((308-211) / 211) percent too high, roughly 46 percent too high. If you prefer, home prices would need to fall ((308-211) / 308), roughly 31 percent.
Alternatively, if home prices stagnate for years, wages may eventually catch up.
Case-Shiller Home Price 1988=$150,000
The same home that cost $150,000 in 1988 now costs $678,366. But wages have gone up too. And mortgage rates have had wild swings.
Mortgage Payment and Wage Adjusted Mortgage Payment
The Least Affordable Mortgages in History
Factoring in wage growth, home prices, and mortgage rates, homes are the most expensive ever.
It’s actually much worse than the chart indicates because property taxes and insurance are not factored into.
Mortgage Rates
Mortgage Rate chart courtesy of Mortgage News Daily.
Through massive and totally unwarranted QE, foolishly hoping to create more inflation, the Fed suppressed interest rates to record lows and mortgage rates followed.
Anyone with an an existing mortgage could and did refinance at 3.00 percent or below.
This increased “affordability” and we now have two classes of people courtesy of the Fed: winners and losers (existing home owners who refinanced low and those who want to buy).
“Mortgage rates continued to move higher last week as markets digested the recent upswing in Treasury yields. Rates for all mortgage products increased, with the 30-year fixed mortgage rate increasing for the fourth consecutive week, up to and above 7.53 percent – the highest rate since 2000,” said Joel Kan, MBA’s Vice President and Deputy Chief Economist. “As a result, mortgage applications ground to a halt, dropping to the lowest level since 1996.The purchase market slowed to the lowest level of activity since 1995, as the rapid rise in rates pushed an increasing number of potential homebuyers out of the market. ARM loan applications picked up over the week and the ARM share increased to 8 percent, as some borrowers searched for ways to lower their payments.”
What About the Winners?
Good question. The winners refinanced at 3.0 percent or below. This put extra money in their pockets every month to spend.
And rising wages further stimulated ability of the winners to buy goods and services.
Thus the Fed is still paying for its asinine push to create inflation.
Meanwhile, the housing market is dead and will remain dead with mortgage rates approaching 8.00 percent.
What About Rent?
CPI data from the BLS, chart by Mish.
That’s another good question. For 24 months or so, economists have been predicting an ease in rent inflations.
The price of gasoline rose 10.6 percent, rent another 0.5 percent, shelter, 0.3 percent, and new cars 0.3 percent leading the way for a 0.6 percent increase in the CPI in August.
The price of rent has gone up at least 0.4 percent for 25 straight months. Not to worry, Paul Krugman says this is lagging.
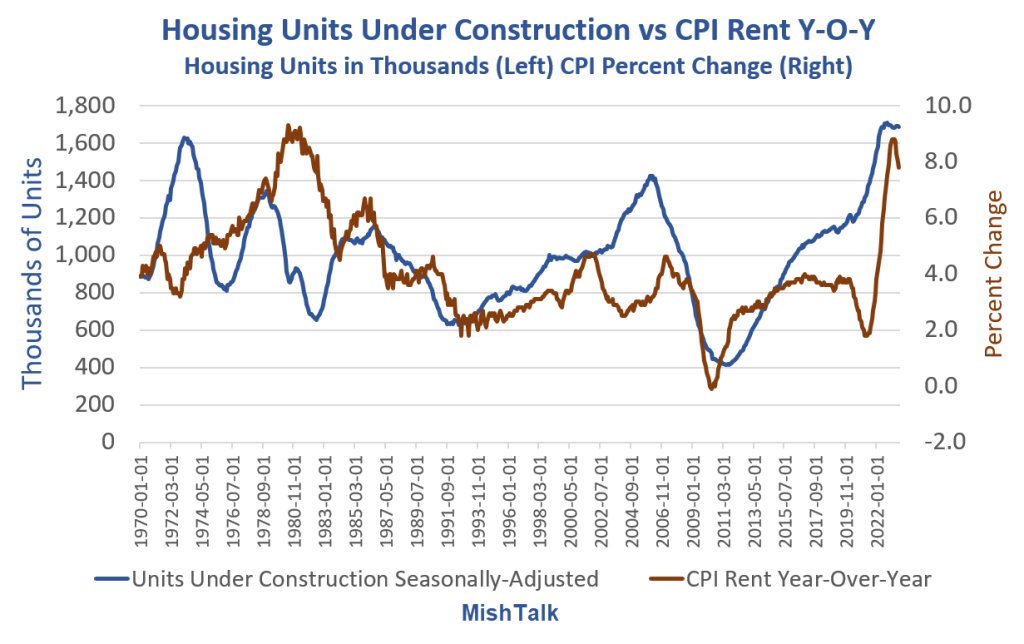
When Will Record Housing Units Under Construction Ease Rent Inflation?
That’s really a trick question. For a better question, remove the lead “when” from the sentence.
The answer is: I don’t know, nor does anyone else, although people claim to be clairvoyant.
Housing Units Under Construction vs CPI Rent Year-Over-Year
Housing units from Census Department, Rent CPI from BLS, chart By Mish
I saw the theory that rent would collapse as soon as housing units get completed so many times that I almost started believing it myself.
However, the data shows no discernable correlation no matter how you shift the lead or lag times.
The chart looks totally random. So perhaps rent abate. Perhaps not. The data itself provides no reason to believe anything.
Regardless, please note the floor. Year-over-year rent has a floor of about 2 percent except in the Great Recession housing crash.
And these charts are not imputed Owner’s Equivalent Rent prices for which people pay no actual rent. These charts reflect rent of primary residence.
34 Percent are Screwed
Well, don’t worry. Only 34 percent of the nation rents, and besides, rent is lagging.
Sarcasm aside, the Fed blew huge asset bubbles and did not see that as inflation. Nor did the Fed see that three massive rounds of fiscal stimulus would cause inflation.
Real Income and Spending Billions of Chained Dollars
Note the three rounds of massive fiscal stimulus in the Covid pandemic. This triggered the most inflation since the 1970s. Economists debate how much “excess savings” still remains.
The Fed never saw this coming, never saw a housing bubble in 2007, and has never once predicted a recession.
Heck, former Fed chair Ben Bernanke denied a housing bubble and denied a severe recession that had already started.
Expect More Inflation Everywhere
Unfortunately, Biden is doing everything humanly possible to stoke inflation with EV mandates, natural gas mandates, union pandering, student debt forgiveness, and regulations, some of which is blatantly unconstitutional.
If you are looking to buy your first home and need to finance, good luck.
The longer the Fed holds rates high, the longer the housing transaction crash lasts. But cutting rates will further expand the housing bubble, asset bubbles in general. And bubbles are destabilizing.
That is the Fed’s tightrope dilemma, of its own making.
If you are one of the winners, congrats. But that extra money the Fed put in your pocket every month may stoke inflation for a long time.
Coping with inflation caused by Federal spending (and excessive Fed stimulus) is difficult and eventually consumer max out their credit cards. Like now!
Credit card useage nosedived by -10.8% in September, according to Citi. This is the fifth straight month of spending decleration.
Leading the decline was electronics. The leader on the positive sign was … jewelry?? Hey, I thought mobs of people were robbing stores because they were hungry!!
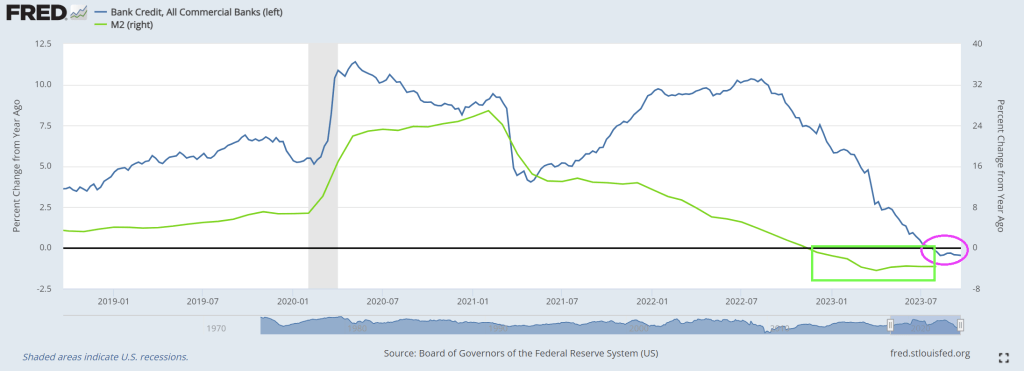
In terms of bank credit, rising rates to fight inflation, bank credit growth Bank credit growth has been negative for nine straigth weeks.
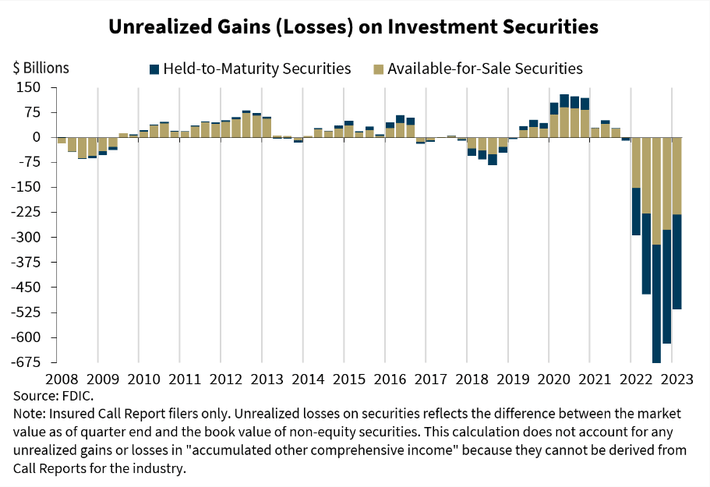
Then we have unrealized losses on bank balance sheets, expected to surge to $700 billion with soaring interest rates.
On a different note, Homeland “Security” head Mayorkas now claims the US has to build a wall to combat the out-of-control immigration on the southern border. Wait! I thought Mayorkas and Congressional members (angrily) claim the border was secure! It doesn’t matter, Mayorkas is simply signalling to blue states that he will build a wall. But how fast is a different question.
The massive Federal government and Federal Reserve Covid stimulus has worn out and we are left with a sagging jobs report and soaring credit card delinquencies.
After ADP’s reports printed almost perfectly in line with BLS last month (+177k vs +187k), all eyes are on today’s print, which was expected to decline to +150k. Instead it plunged to just +89k – that is the lowest jobs addition since Jan 2021.
Credit Card Delinquency rates at small banks have reached 7.51%, the highest level ever recorded.
The Market Composite Index, a measure of mortgage loan application volume, decreased 6.0 percent on a seasonally adjusted basis from one week earlier. On an unadjusted basis, the Index decreased 6 percent compared with the previous week. The Refinance Index decreased 7 percent from the previous week and was 11 percent lower than the same week one year ago. The seasonally adjusted Purchase Index decreased 6 percent from one week earlier. The unadjusted Purchase Index decreased 6 percent compared with the previous week and was 22 percent lower than the same week one year ago.
The purchase market slowed to the lowest level of activity since 1995, as the rapid rise in rates pushed an increasing number of potential homebuyers out of the market. ARM loan applications picked up over the week and the ARM share increased to 8 percent, as some borrowers searched for ways to lower their payments.
The US 30-Year Mortgage Rate Tops 7.5% for First Time Since 2000.
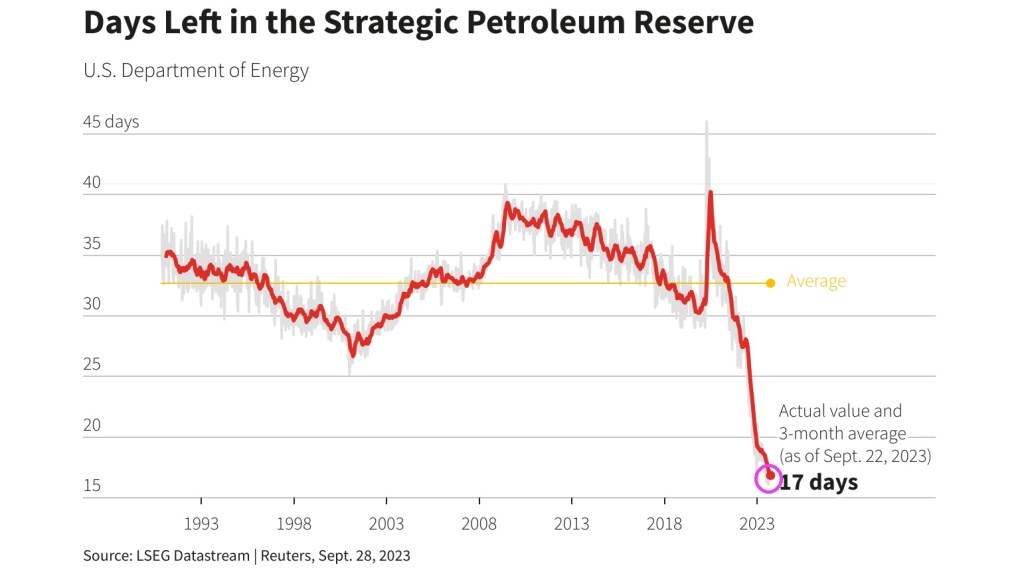
On the energy front, where we are represented by former Michigan governnor Jennifer Granholm and former South Bend Indiana mayor Pete Buttigieg, we see that the Strategic Petroleum Reserve is down to only 17 days left.
Fear the talking Fed! Various Fed Presidents are talking this week and when they do. WATCH OUT!
The latest fear mongering will be … inflation is persistent and they might have to keeep raising rates.
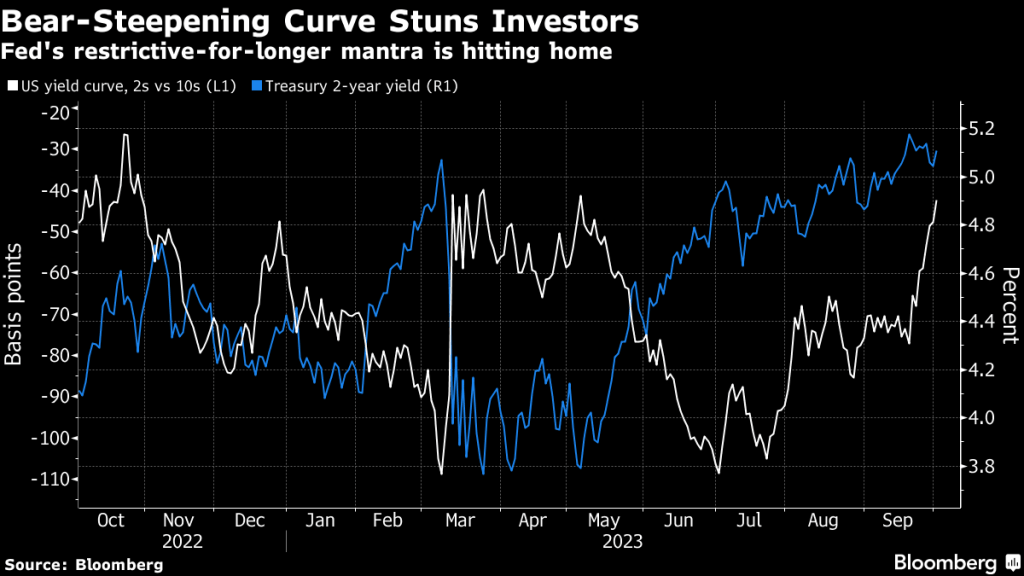
The two-year Treasury remains above 5% and the 10Y-2Y T-Curve remains inverted.
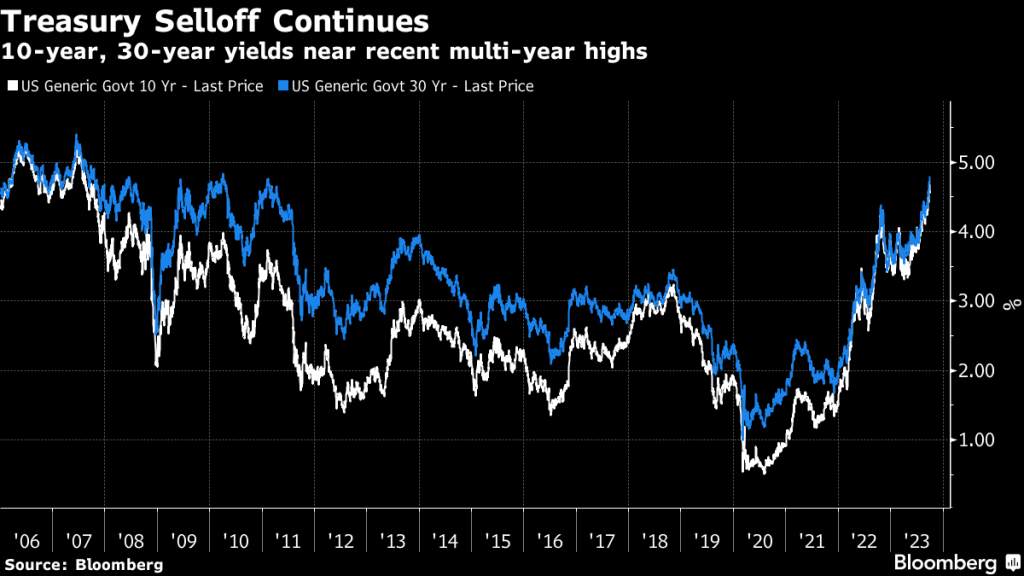
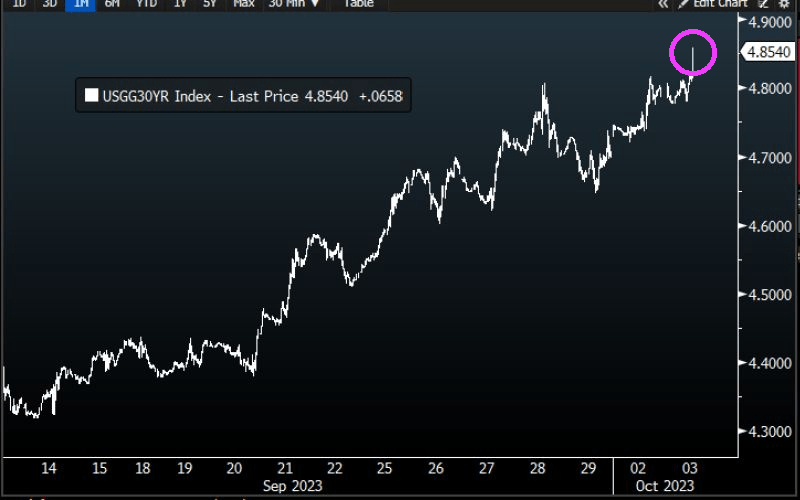
Treasury 30-year yield rose to 4.856%, HIGHEST SINCE 2007.
The likelhood of another Fed rate hike is growing.
While inflation is cooling (but still elevated), The Fed could choose to rate hikes again.
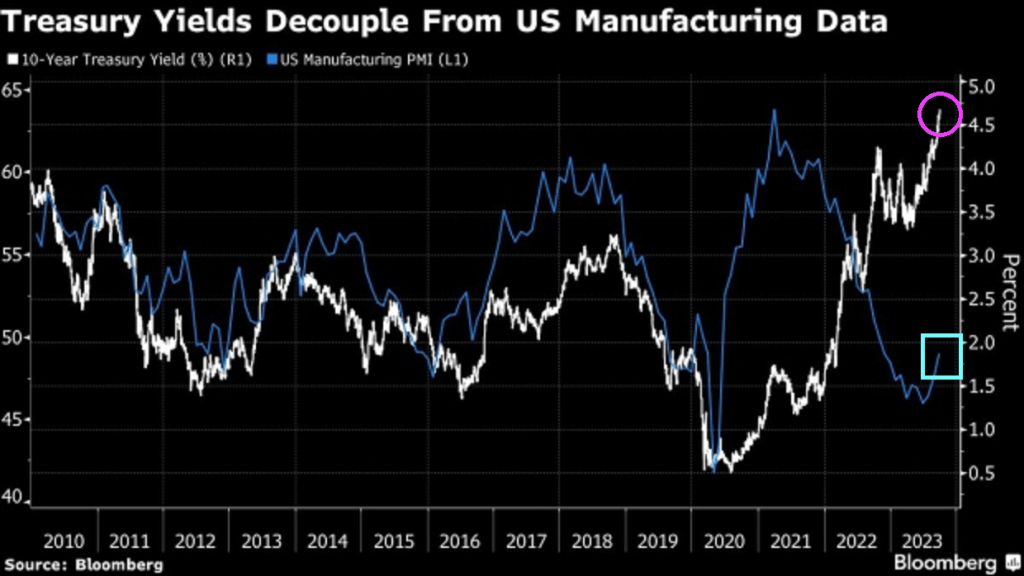
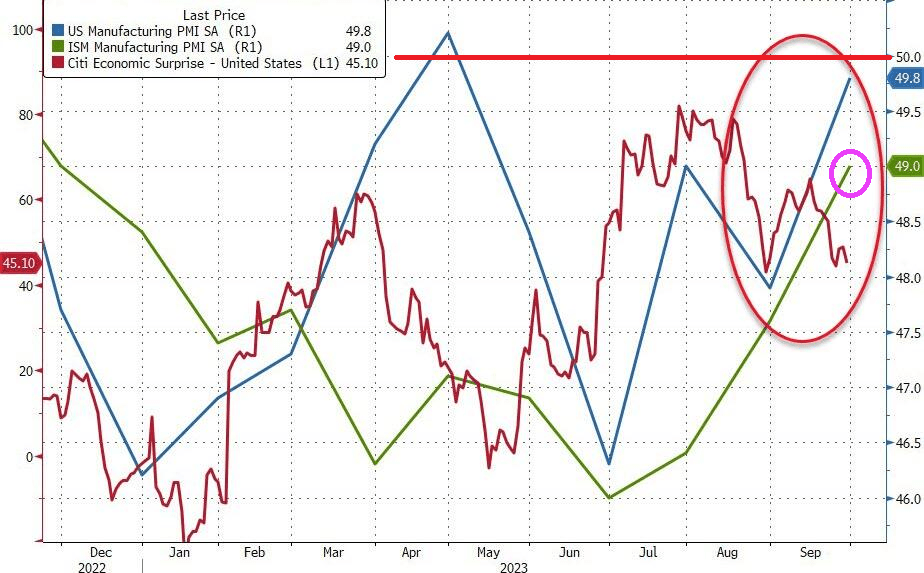
Treaury yields have decoupled from US manufacturing data.
Best picture of Lael Brainard, Director of the National Economic Council of the United States and former Federal Reserve member and talking head. Or screaming head.
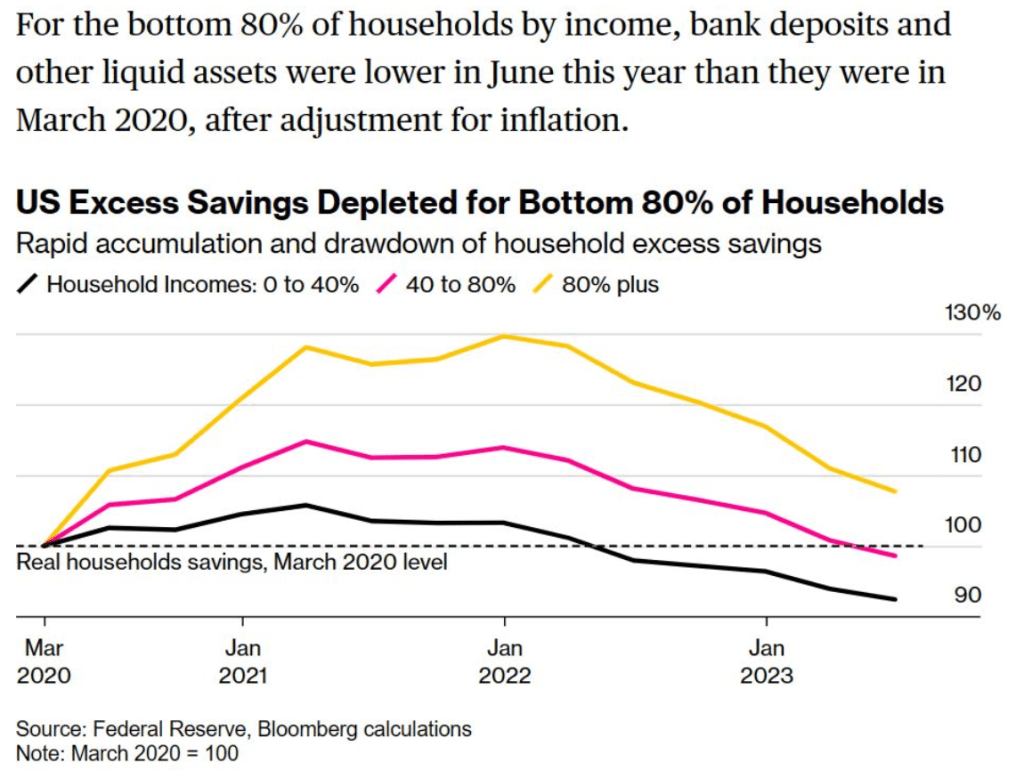
Wasting away again with Bidenomics, code for massive Federal subsidies to green energy donors. And incentives to buy impractical EVs. Imagine in an emergency and your car only goes 200 miles (and then you have to wait for an available charger to come open). Well, the top 1% are doing fine. But the bottom 80% of households by income are seeing rapid deplection of savings to cope with the rising costs of Bidenomics.
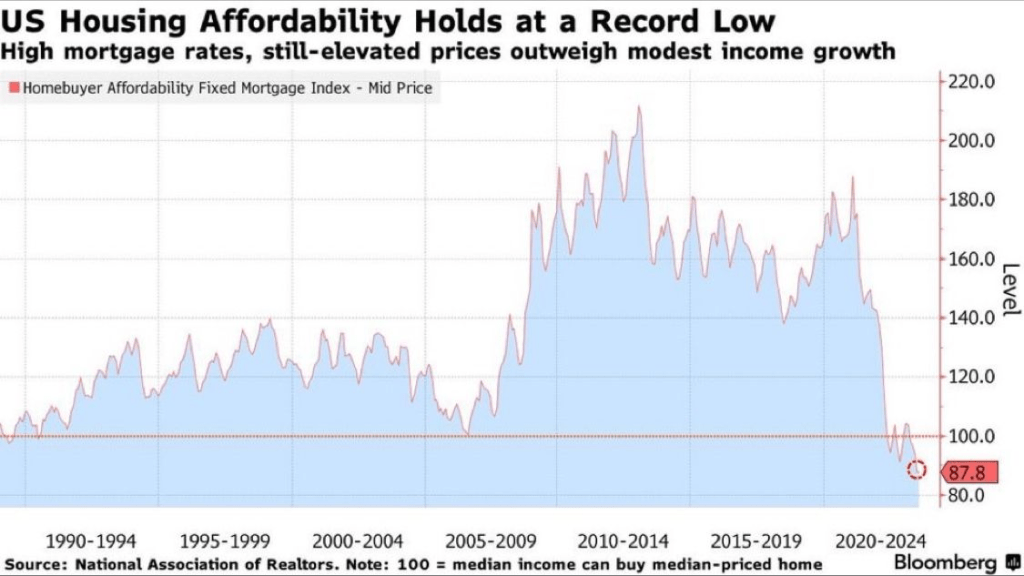
And then we have shrinking home affordability, now at a record low.
Well, it looks like Ukraine’s army is surrending in droves to Russian forces. Maybe this will end Biden’s obsession with doling billions of dollars to Ukraine. Nah, Biden will continue doling out billions to Ukraine, but this time it will be to rebuild Ukraine (while major US cities continue to rot). But in any case, Biden and Democrats refused to return to pre-Covid levels of spending.
Federal outlays (spending) has increased by 30% from January 2020, just prior to Covid. Yet, Republicans are unable (or unwilling) to get the Biden Administration and Democrats to cut Federal spending back to pre-Covid spending levels. M2 Money is up a whopping 36%.
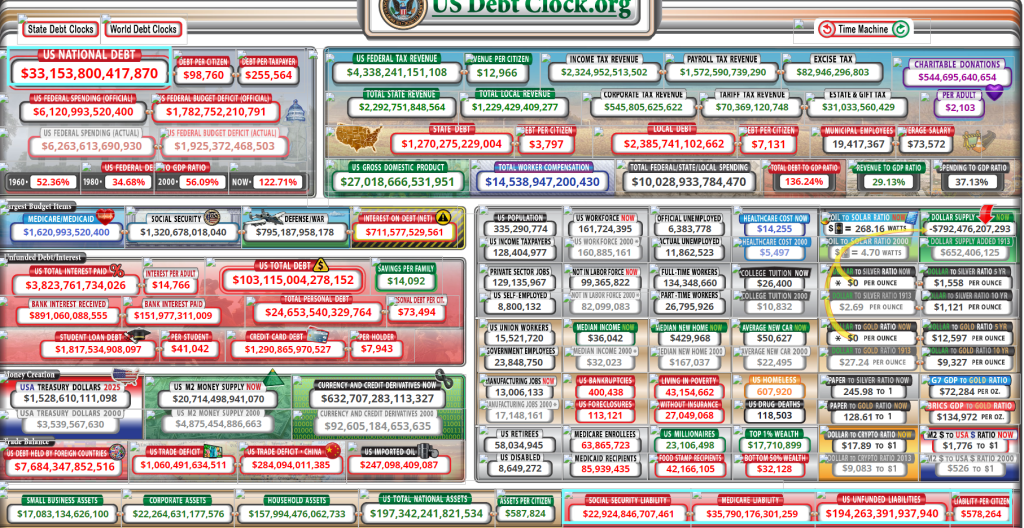
But never fear. US Federal debt is now above $33 trillion with $194+ TRILLION in unfunded liabilities. I feel dread after California governor “Gruesome” Newsom appointed The Fonz (a Democrat millionaire living in Maryland?) to replace Diane Feintstein in the US Senate.
S&P Global’s PMI Manufacturing jumped from 47.9 in August to 49.8 in September (and up from 48.9 in the flash September print). That is the highest print for US manufacturing since April but remains in contraction (below 5). That is the 5th straight month in contraction and 10th month in the last 11 in contraction (sub 50).
The ISM Manufacturing print also rose (to 49.0), up from 47.6 and better than the 47.9 exp (but still below 50 for the 10th straight month).
No, not Henry Winkler. But Laphonza Butler, a friend of VP Kamala Harris and the CEO of Emily’s List. And lauughably a resident of Maryland representing California.

























You must be logged in to post a comment.