The U.S. is poised to enter Year Three of the pandemic with both a booming economy and a still-mutating virus. But for Washington and Wall Street, one Covid aftershock is starting to eclipse almost everything else.
Already-hot inflation is forecast to climb even further when November data comes out on Friday, to 6.8%. That would be the highest rate since Jimmy Carter was president in the early 1980s — and in the lifetimes of most Americans.
And the CPI change since last year, according to the Federal Reserve of St Louis FRED is a staggering 16.262%.
And with U.S. Jobless Claims plunge to 52-year low, its about time that The Fed begins removing the humongous monetary stimulus.
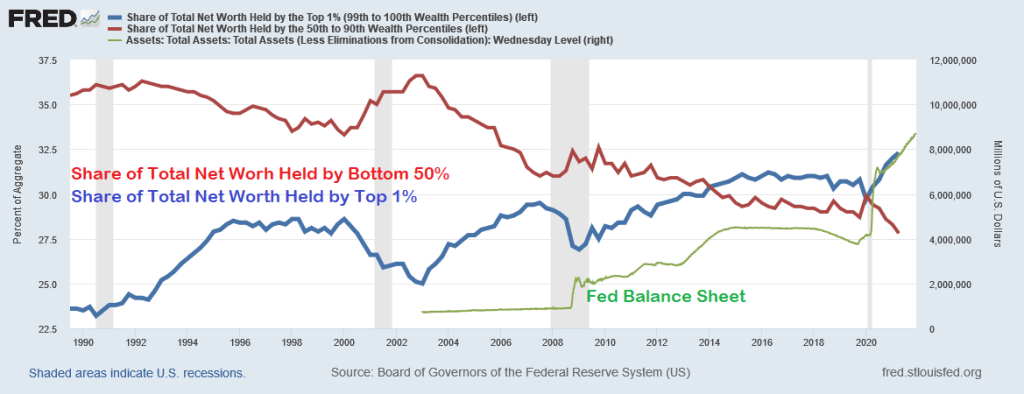
After all, largely thanks to Federal Reserve policies, we have seen the greatest wealth redistribution in US history … to the top 1%.
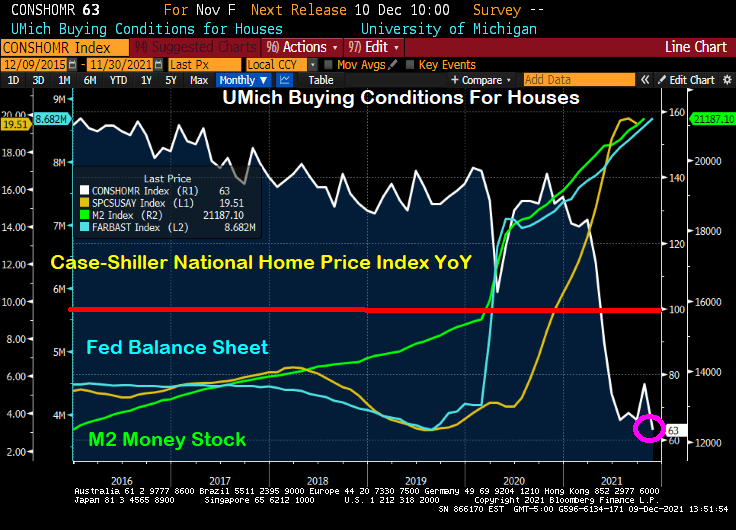
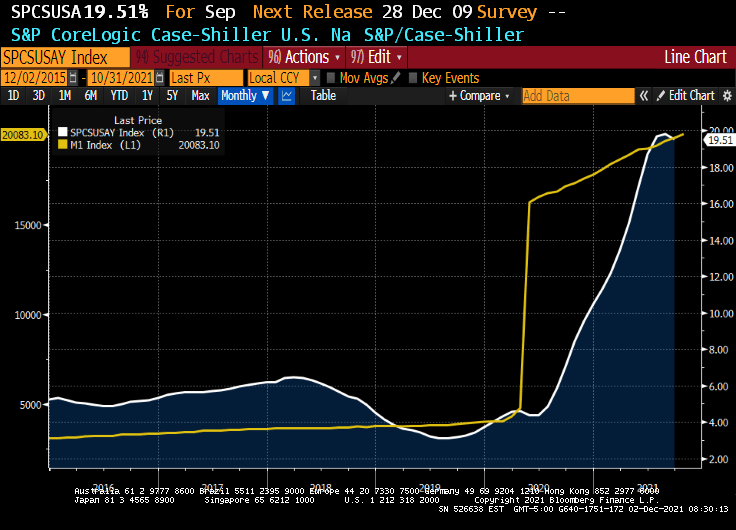
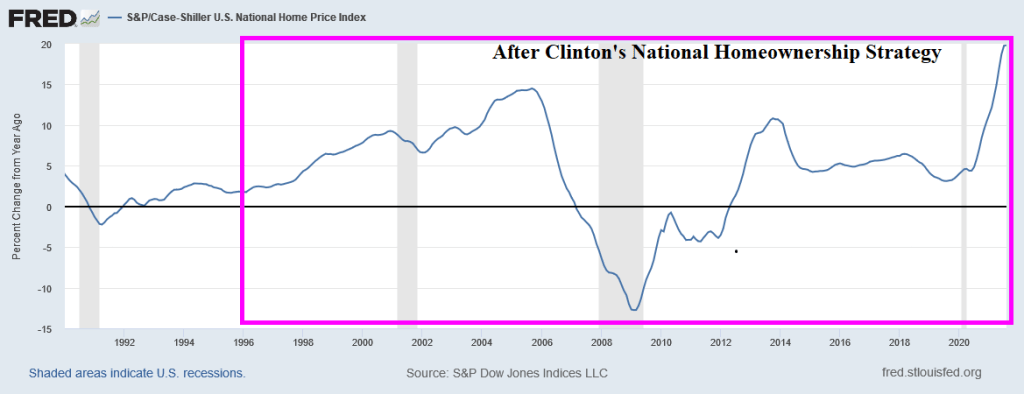
Just look at this chart of the University of Michigan Buying Conditions For Houses index. It was positive (meaning above 100) until shortly after COVID struck and The Federal Reserve rode to the rescue. National home price growth was already at 4.57% YoY in March 2020, then ballooned to 19.51% YoY at the last reading.
Here is the same chart with the broader M2 Money stock and The Fed’s Balance sheet. Same results, just not as dramatic as M1.
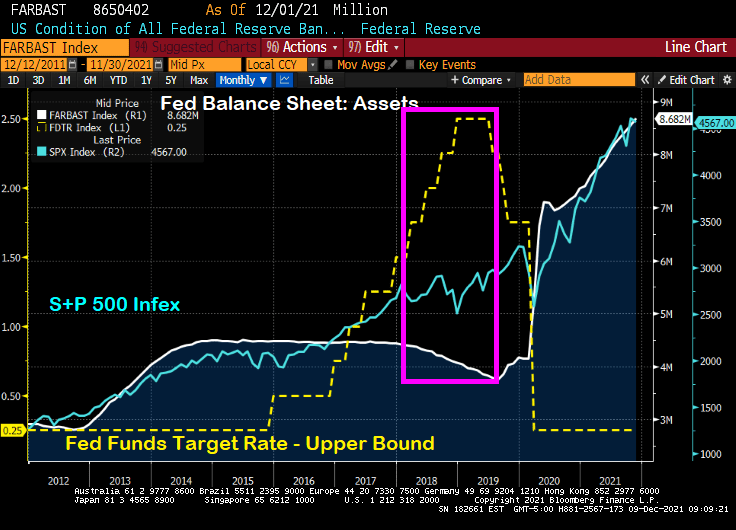
We will soon find out if The Federal Reserve will announce a rate hike or taper news. They are likely to confirm tapering, particularly if they believe that tapering won’t roil markets. After all, then Fed Chair Janet Yellen and the FOMC decided to let the Fed’s balance sheet taper (white line) while, at the same time, increasing the Fed’s target rate (yellow line). The S&P 500 index rose 9.5% over the taper/rate increase period of 12/29/2017 to 8/30/2019.
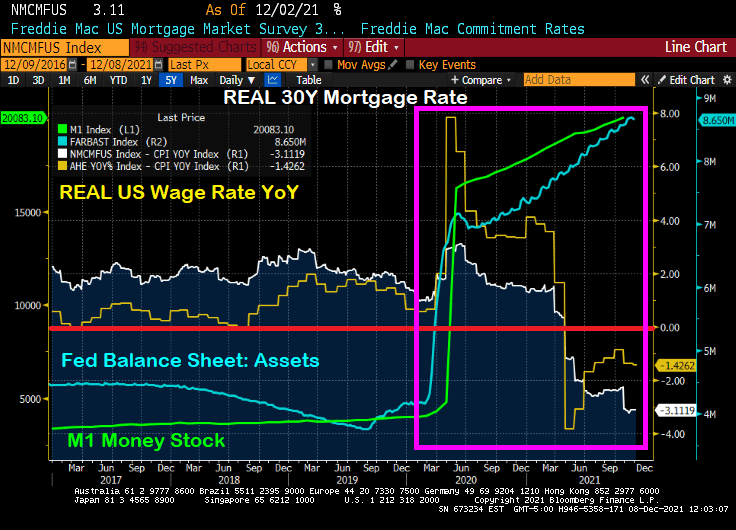
But since Stimulypto (2/28/2020 to 11/30/2021), the Fed’s balance sheet doubled+ from $4,158,637 to $8,681,771. And The Fed Funds Target Rate (UB) immediately fell from 1.75% in February 2020 to 0.25% in March 2020 … and has stayed there ever since. The S&P 500 index rose 54.6% over this Stimulypto period.
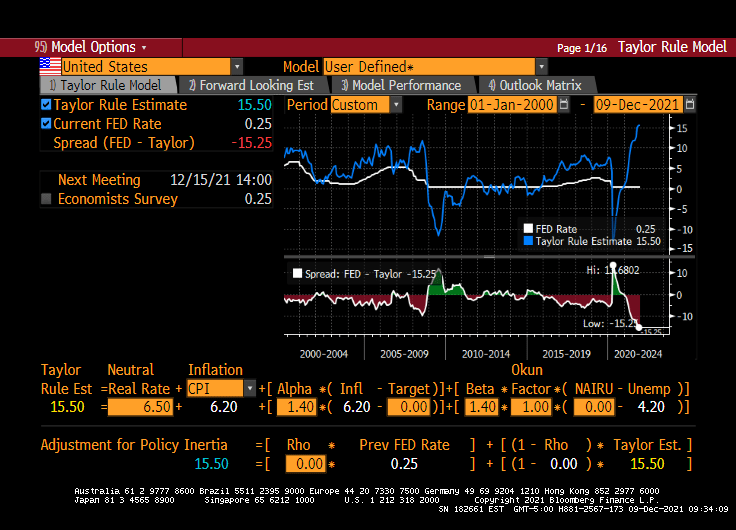
But The Fed’s upcoming decision on December 15, 2021 may be a Yellen-pivot (taper balance sheet, but raise The Fed Funds Target rate). But, then again, maybe not. The Fed is getting really bad about forward guidance and choose instead to surprise us. Hence, this is why an a-political rule is preferred (such as the Taylor Rule).
Unfortunately, the Taylor Rule infers a Fed Funds Target rate of 15.50% (using CPI YoY running at 6.20% YoY. If The Fed raises their target rate by 25-50 basis points at the December 15th meeting, color me surprised.
So, the Powell Pivot may just be the Yellen Pivot after all.
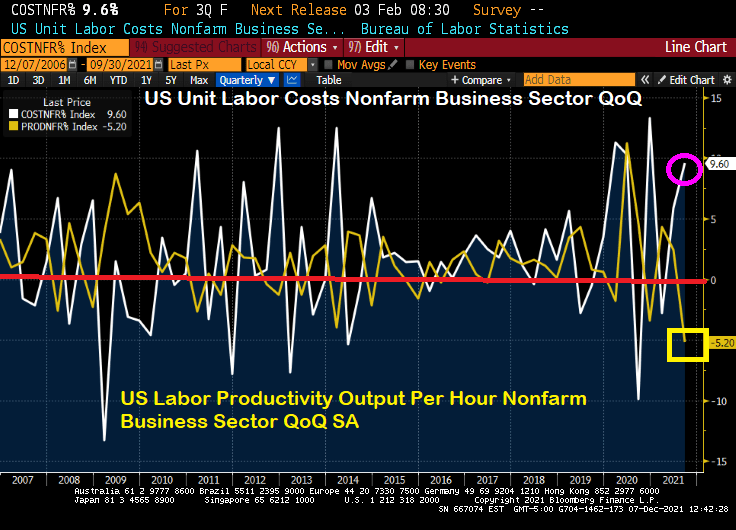
If this what the Biden Administration had in mind? Soaring labor costs at the same time that labor productivity is falling to its lowest level since 1960?
Powell and the Gang’s monetary approach doesn’t seem to be working for the labor market …
As we are all painfully aware, The Federal Reserve went on a 2nd money printing spree to allegedly stave-off the economic impacts of the COVID outbreak in March 2020. The first money printing spree took place in late 2008 as The Fed tried to stave-off the economic impacts of the housing bubble burst of 2008 and the ensuing financial crisis.
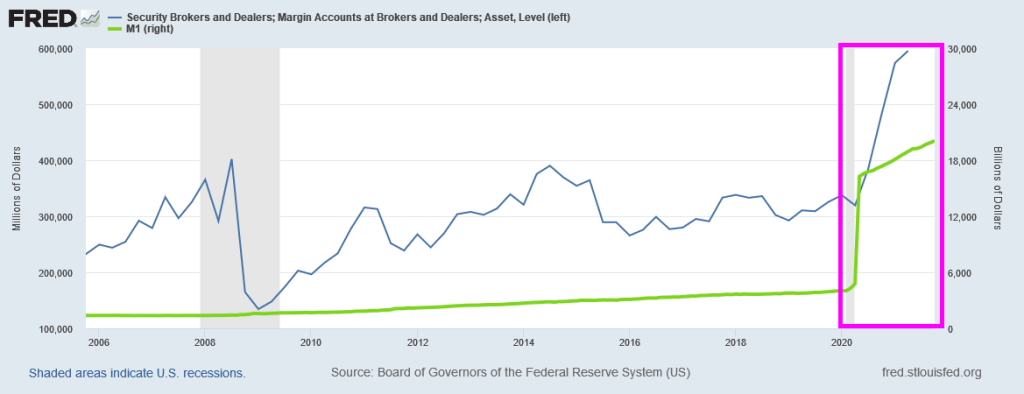
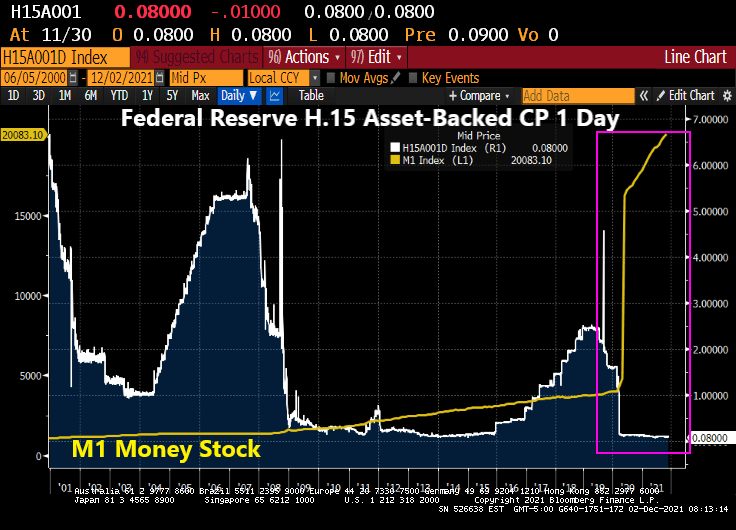
But for now, we have this horrifying chart showing the exploding margin accounts at security brokers and dealers (not, not the Walter White-type dealers, but Wall Street dealers). Notice the 400% surge in M1 Money stock after COVID struck.
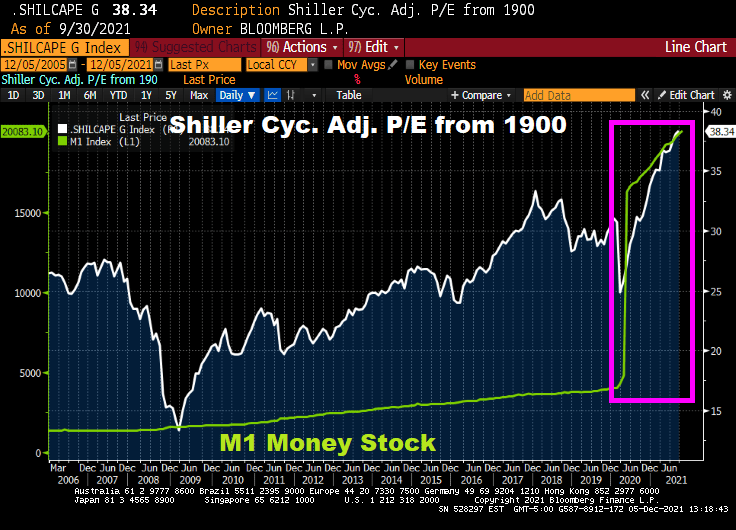
Of course, the soaring stock market is feeding the margin loop, encouraged by The Fed. Check out the Shiller Cyclically Adjusted Price Earnings (CAPE) ratio after The Fed’s M1 printing storm.
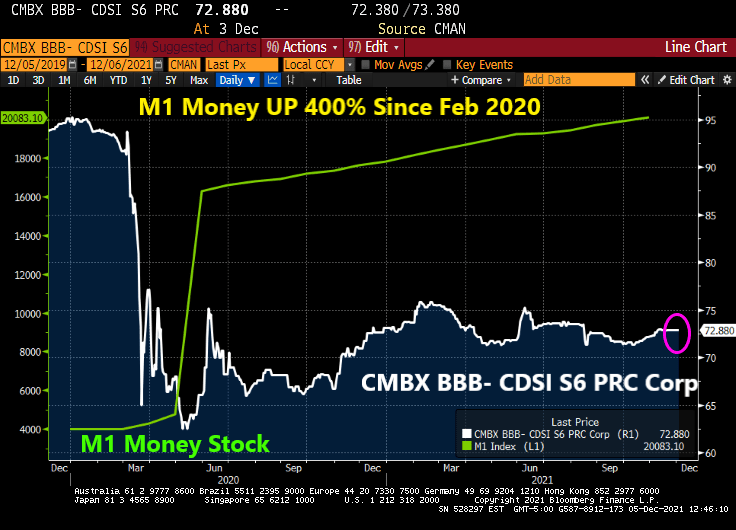
What can’t money printing fix? How about CMBS prices (or CMBX BBB- S6 prices … down 30.5% since just before COVID struck.
Let’s see if The Fed sucks the 400% growth back to zero.
Treasury Secretary Janet Yellen said yesterday that “It’s Fed’s Job to Avoid Any Wage-Price Spiral.” Well, The Fed is helping to avoid a wage increase in real terms, since the November jobs report revealed that REAL US Average Hourly Earnings growth YoY fell to -1.378%. In other words, inflation is greater than hourly earnings.
And in other jobs related news, nonfarm payrolls rose by only 210k versus expectations of 550k jobs to be added. Even NOMINAL hourly earnings growth (4.8% YoY) was less than expected (5.0%).
Labor force participation rose a bit to 61.8%, still well below the pre-COVID levels of 63.4% in January 2020.
The U-3 unemployment fell to 7.8%. Still higher than the pre-COVID rate of 7.0% in February 2020, but getting close! As for what this means for The Fed, the new target rate implied by the Taylor Rule is 15.50%.
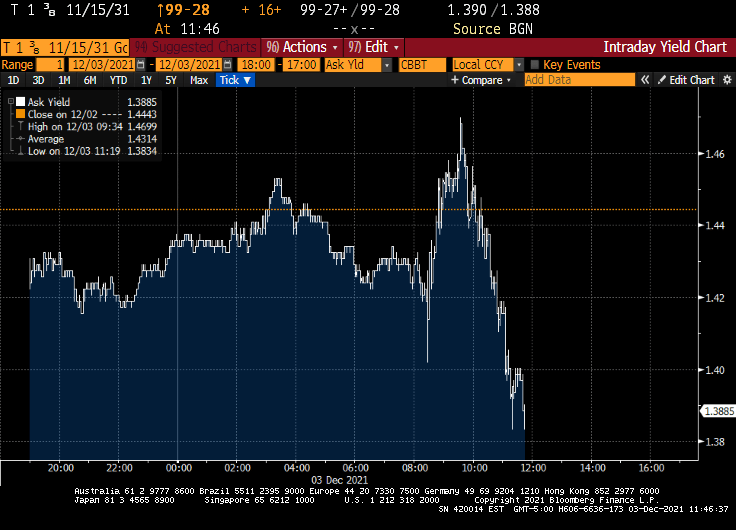
After this lousy jobs report, 10-year Treasury yields dropped … like Biden’s approval ratings.
The Dream Team (Fed Chair Jay Powell and Treasury Secretary Janet Yellen) just can’t believe that inflation struck even after M1 Money Stock increased by 369% from March 2020 to today while interest rates remained near zero.
From The Hill: Federal Reserve Chairman Jerome Powell and Treasury Secretary Janet Yellen on Wednesday said they underestimated how quickly the U.S. economy would rebound from the COVID-19 recession and strain supply chains.
During a Wednesday hearing before the House Financial Services Committee, the top two U.S. economic policymakers acknowledged that high inflation has risen higher and lingered much longer than they expected.
“We understood demand would be strong,” Powell said. “We didn’t understand [the] significant problems of the supply side.”
Both Yellen and Powell said substantial fiscal and monetary stimulus played a role in stoking the higher demand that fueled inflation, but they called it a challenging side-effect of an otherwise fast recovery.
Seriously? The Fed and the Federal government dumped trillions of dollars into an economic system and didn’t think there would be negative consequences??
Look at the surge in M1 Money Stock at the same time asset-backed commercial paper rates are 0.08%. That is, about 1/3rd The Fed Funds Target rate (upper bound). None of this concerned The Dream Team?
An example of what The Dream Team didn’t see happening was the explosion of home prices. Home price growth was about 4% YoY prior to COVID, and is now 19.51% YoY.
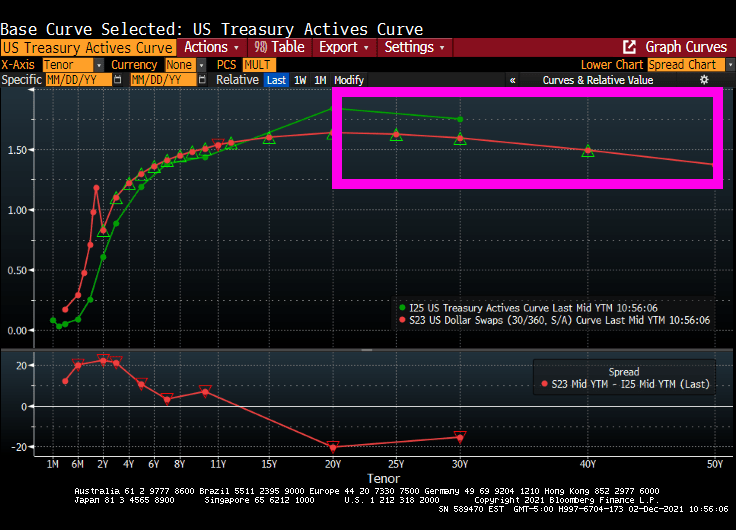
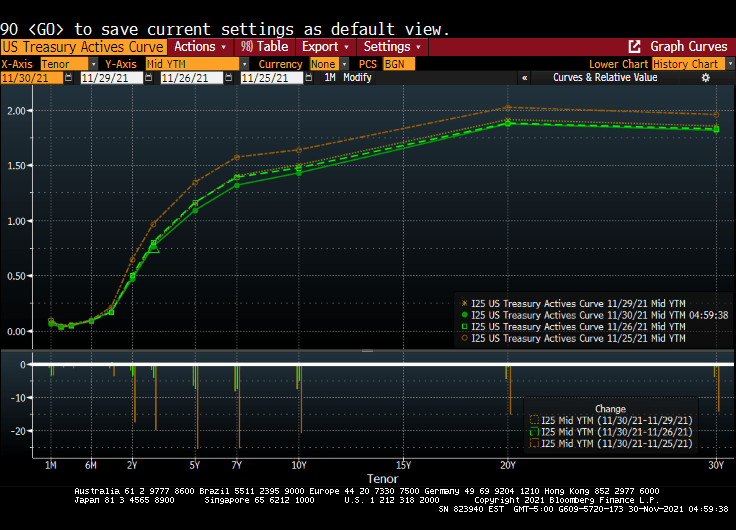
Now we have the US Treasury Actives curve inverting like the US Dollar Swaps curve after 20 years.
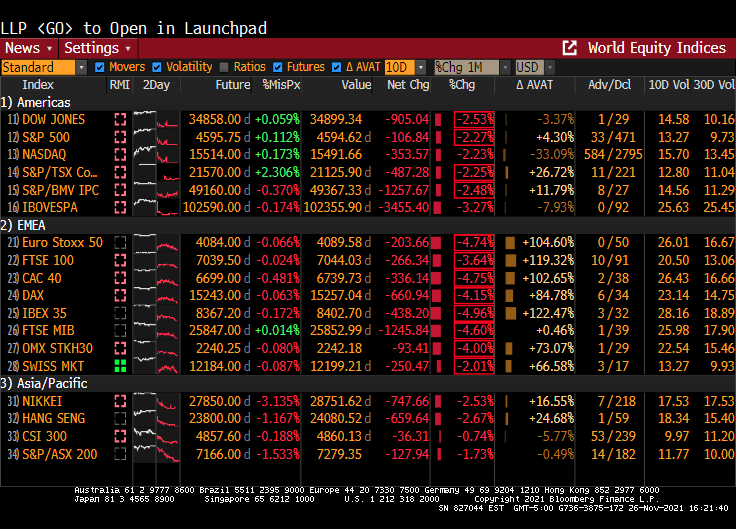
The latest scare hitting financial markets is the Omicron Variant (or Oh! Macron! Variant in France). While it caused an initial decline in global equity markets {Dow fell 900 points on early reports on Omicron), the Treasury market has been relatively unscathed.
For example, the US Treasury Actives curve dropped last Friday (the orange line represents the Wednesday before Thanksgiving), while the remaining three lines represent last Friday, Monday and Tuesdays (today). In other words, the US Treasury Actives curve has been quiet so far this week after Friday’s flattening.
The US Dollar Swaps curve shows the same dynamics. The dark blue line is last Wednesday, while the remaining lines are last Friday, this Monday and today. Not a lot happening after the initial Omicron fear factor was priced in.
Federal Reserve Chairman Jerome Powell believes that the omicron variant of Covid-19 and a recent uptick in coronavirus cases pose a threat to the U.S. economy and muddle an already-uncertain inflation outlook.
“The recent rise in COVID-19 cases and the emergence of the Omicron variant pose downside risks to employment and economic activity and increased uncertainty for inflation,” Powell said in remarks he plans to deliver to Senate lawmakers on Tuesday. “Greater concerns about the virus could reduce people’s willingness to work in person, which would slow progress in the labor market and intensify supply-chain disruptions.”
Do I detect FEAR in Powell’s voice? The odds of rate increases for next year just fell to one rate increase at the September 2022 meeting.
On the equity side, it seems to be all about whether The Fed will withdraw its support. Back in early 2018, then Fed Chair Janet Yellen and the FOMC started to shrink the Fed balance sheet (green line). This resulted in the “Smart Money Index” declining. The S&P 500 index received a jolt with the Fed stimulus around the COVID outbreak and have taken off like a jackrabbit. Despite the Smart Money Flow index being lower than in 2017.
So, is Omicron the “planet killer” or just another mild flu-like outbreak? The data is pointing towards the latter, but FEAR may cause it to be a bigger deal than is warranted.
I have written numerous times about nothing has been the same since the housing bubble burst and ensuing financial crisis of 2008. The crisis led to bank bailouts (TARP) and banking legislation (Dodd-Frank) giving The Federal Reserve even more power. And then the COVID lockdowns led to even MORE power for The Fed. And a horrid decline in money velocity (the ability of printing money to increase economic growth … or GDP).
But let’s take one step backwards. One the causes of the housing bubble that burst was President Clinton’s infamous National Homeownership Strategy that encouraged “partners” with the Federal government to soften underwriting standards for mortgage lending, particularly for minority households. The intent was to increase the homeownership rate in the US and it worked! Too well. Along with increasing the homeownership rate came rising home prices, culminating with home price growth reaching 14.5% YoY in September 2005. Only to start slowing to a crash.
Of course, the housing bubble was associated with no/low documentation and subprime mortgage lending. But the relaxing of underwriting standards by the National Homeownership Strategy helped fuel the no/low doc and subprime lending crisis. But weakening underwriting standards to increase homeownership rates is a dangerous strategy.
Note the surge in M1 Money Velocity (GDP/M1) starting in 1994. M1 Velocity grew until Q4 2007, then crashed along with home prices. The second and more sudden crash in M1 Velocity occurred with the COVID outbreak in March 2020 and the ensuing economic lockdowns and the intervention of The Federal Reserve in terms of money printing. M1 Money surged 173% from October 2008 to February 2020 and then another 369% from March 2020 to today. THAT is a Fed Storm Surge!!
M2, the broader definition of money, has not grown as rapidly as M1, but it still grew at an alarming rate. Atlanta Fed President Raphael Bostic blamed inflation on COVID but not The Fed’s insane money printing or government lockdowns. C’mon man!
Finally, the banking crisis (and TARP bailouts) along with COVID have made consumer purchasing power of King Dollar even worse.
Be careful of government strategies to make housing more “affordable” because they seem to make housing more expensive and can help crash the financial system.
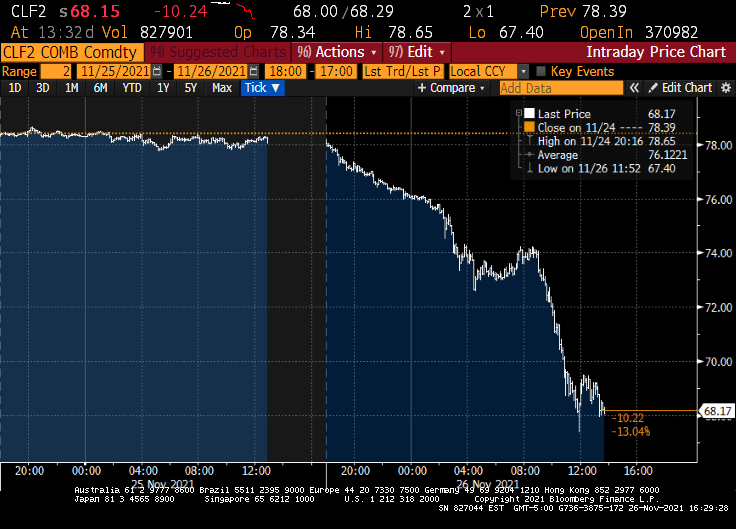
It has been a grim Friday. The Dow fell 900 points, 10Y Treasury yields fell 16.1 basis points and West Texas Crude fell to $68.17.
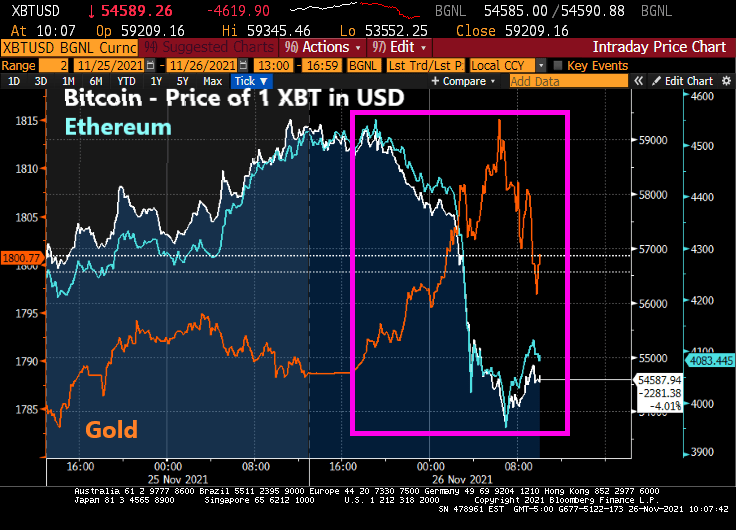
Bitcoin tumbled 20% from record highs notched earlier this month as a new variant of the coronavirus spurred traders to dump risk assets across the globe.
The world’s largest cryptocurrency fell as much as 8.9% to $53,624 on Friday during London trading hours. Ethereum, the second-largest digital currency, dropped more than 12%, while the wider Bloomberg Galaxy Crypto Index declined as much as 7.5%. On the other hand, gold rose as cryptos fell, then retreated as cryptos rebounded.
A new variant identified in southern Africa spurred liquidations across markets, with European stocks falling the most since July and emerging markets also slumping.
The Dow is down around 900 points … and look at Europe!
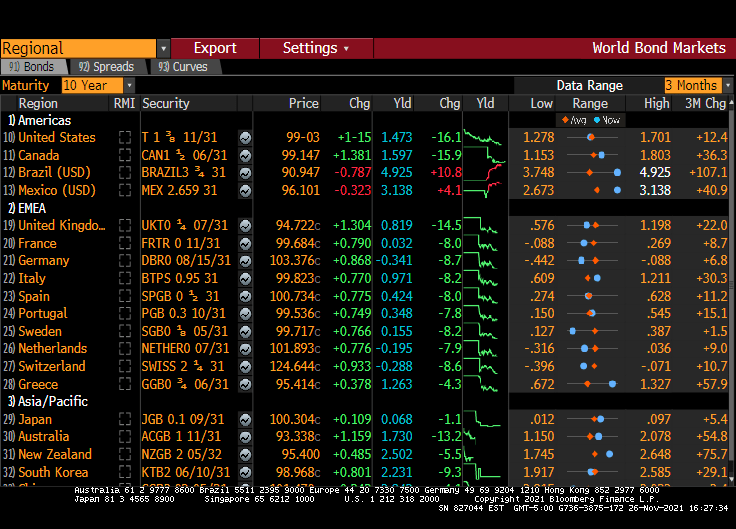
The 10-year Treasury yield is down 16.1 basis points. Most of Europe is down around 8-9 basis points while the UK is down 14.5 BPS.
And West Texas Intermediate crude futures are down to 68.17 from 78.39. No Jen Paski, this isn’t due to Cousin Eddie (Biden) releasing the Strategic Petroleum Reserve (SPR).
Maybe it was all the tryptophan released by eating turkey.


You must be logged in to post a comment.