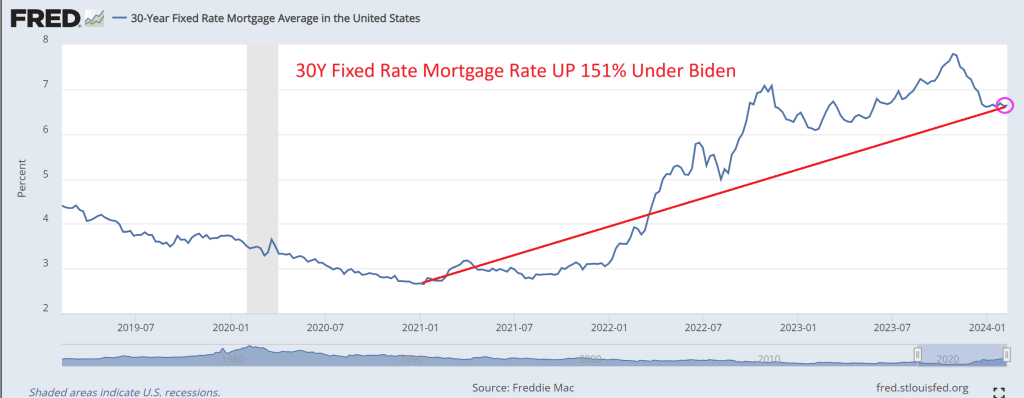
That’s Bidenomics for you!
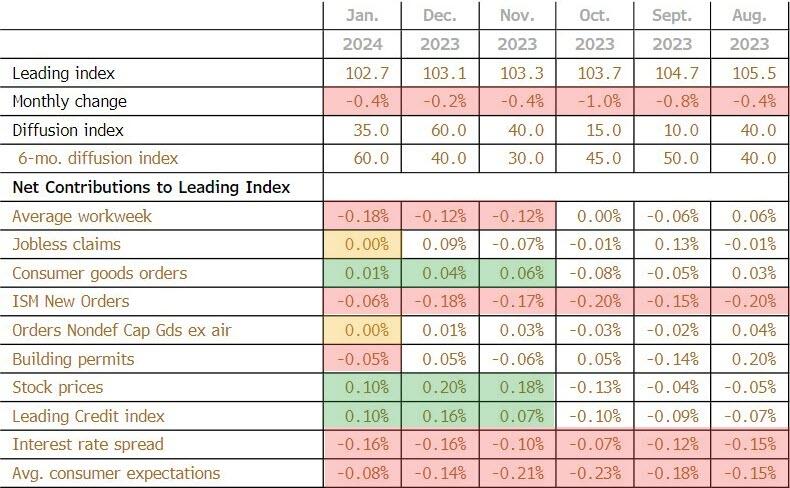
- The biggest positive contributor to the leading index was stock prices (again) at +0.10
- The biggest negative contributor was average workweek at -0.18
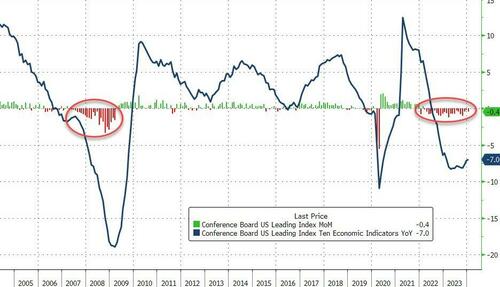
This is the 22nd straight MoM decline in the LEI (and 23rd month of 25) – equaling the longest streak of declines since ‘Lehman’ (22 straight months of declines from June 2007 to April 2008)
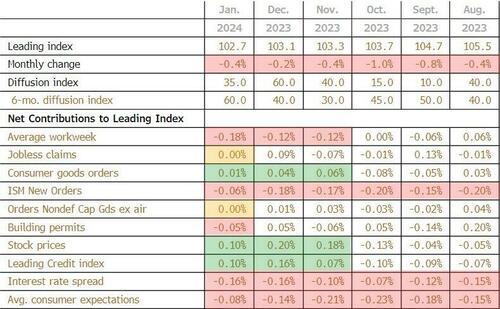
“The U.S. LEI fell further in January, as weekly hours worked in manufacturing continued to decline and the yield spread remained negative,” said Justyna Zabinska-La Monica, Senior Manager, Business Cycle Indicators, at The Conference Board.
“While the declining LEI continues to signal headwinds to economic activity, for the first time in the past two years, six out of its ten components were positive contributors over the past six-month period (ending in January 2024).
As a result, the leading index currently does not signal recession ahead.
While no longer forecasting a recession in 2024, we do expect real GDP growth to slow to near zero percent over Q2 and Q3.”
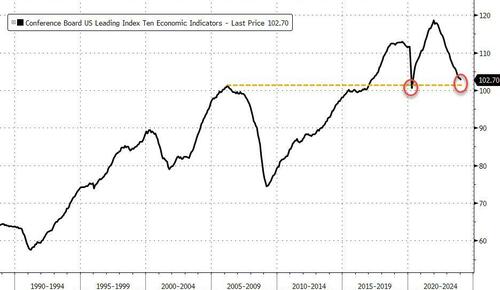
While the Conference Board seems optimistic, we are struggling to see any signs of hope! tumbling back below the peak in March 2006…
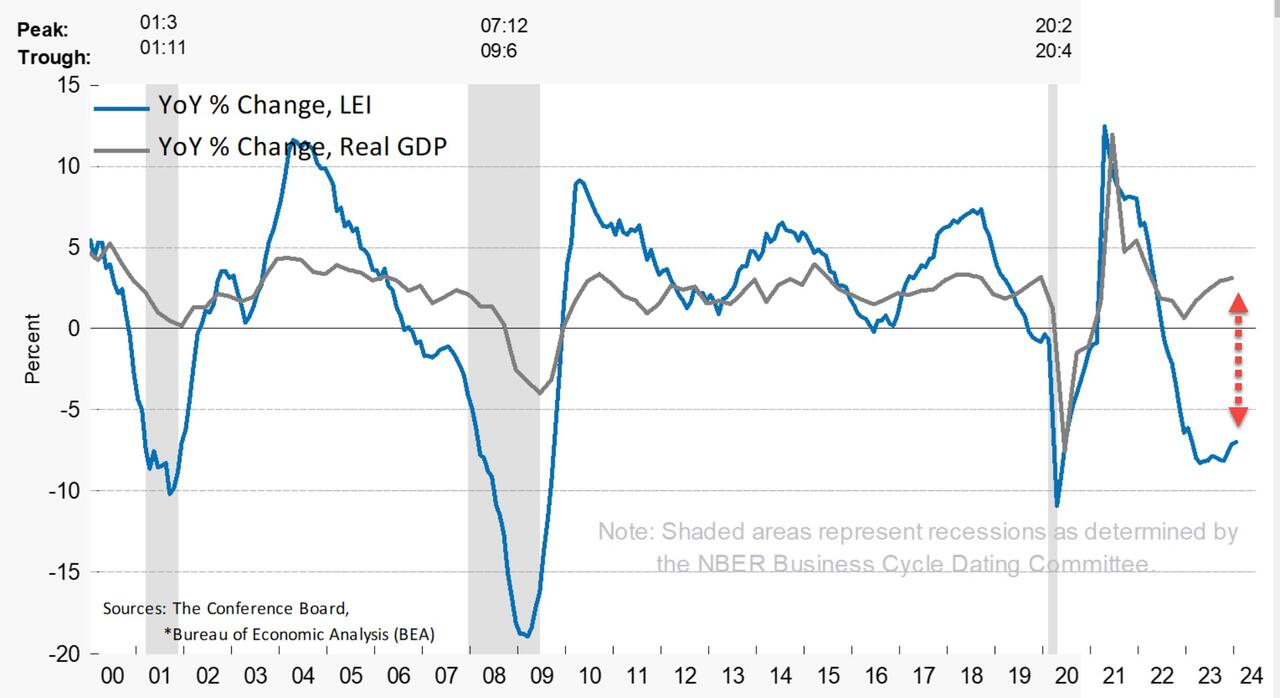
And on a year-over-year basis, the LEI is down 7.0% (down YoY for 19 straight months) – still close to its biggest YoY drop since 2008 (Lehman) outside of the COVID lockdown-enforced collapse (but starting to inflect)…
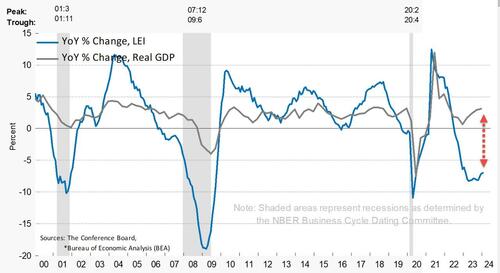
The annual growth rate of the LEI remains deeply negative and decoupled from Real GDP…..
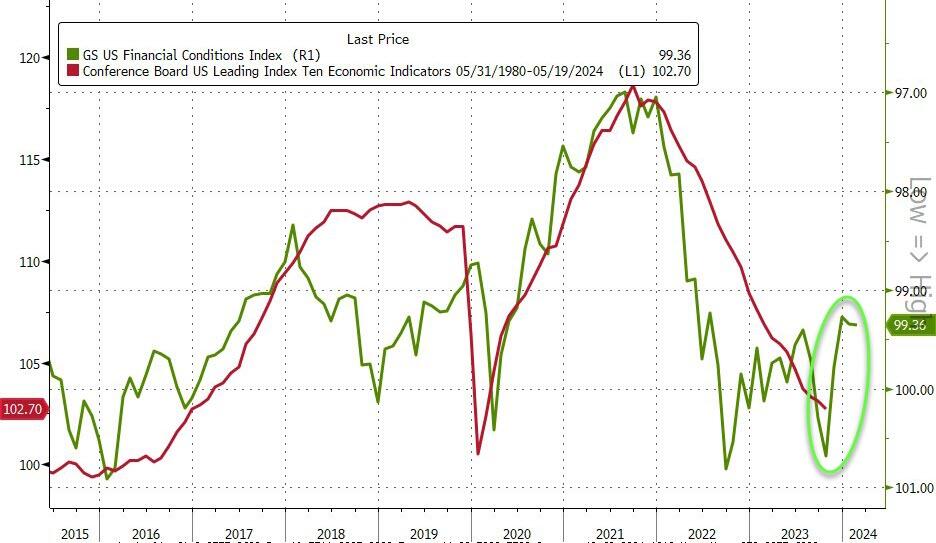
Finally, the massive easing of financial conditions in the last few months suggests a turn in LEI is imminent…

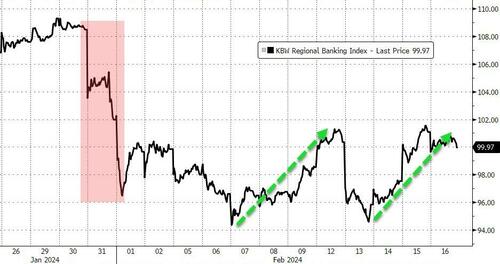
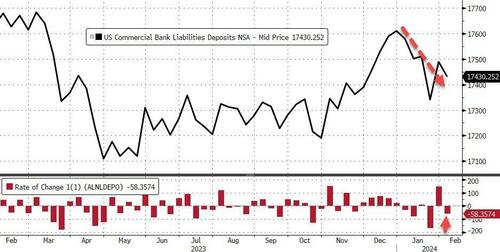
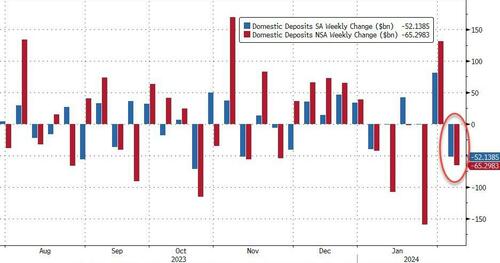
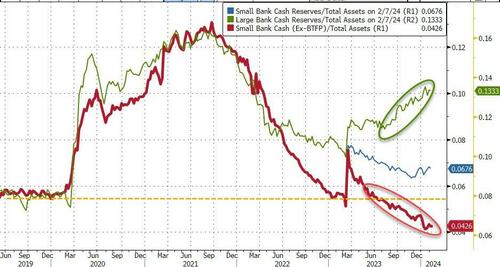
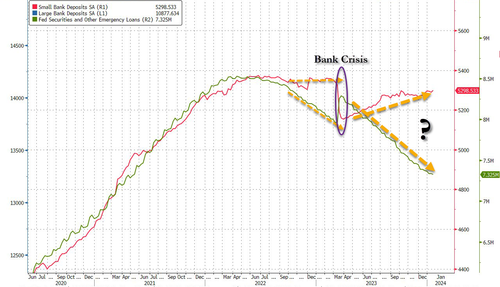
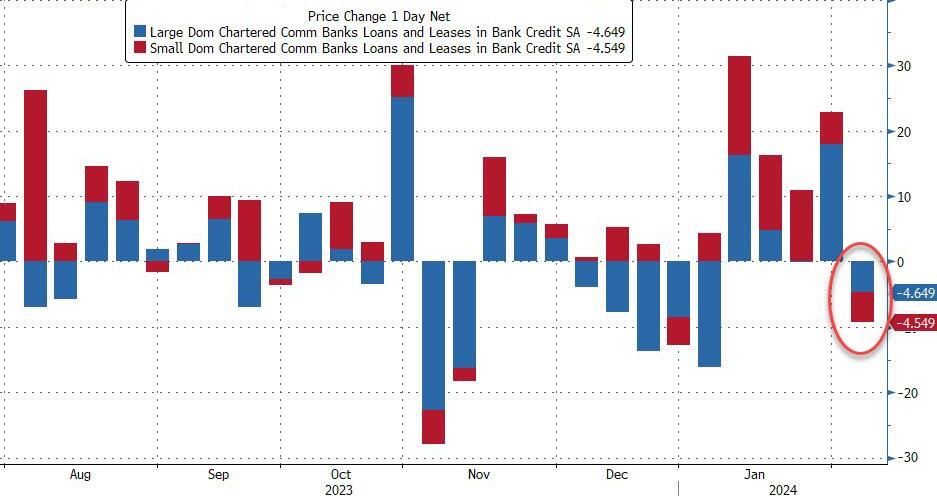
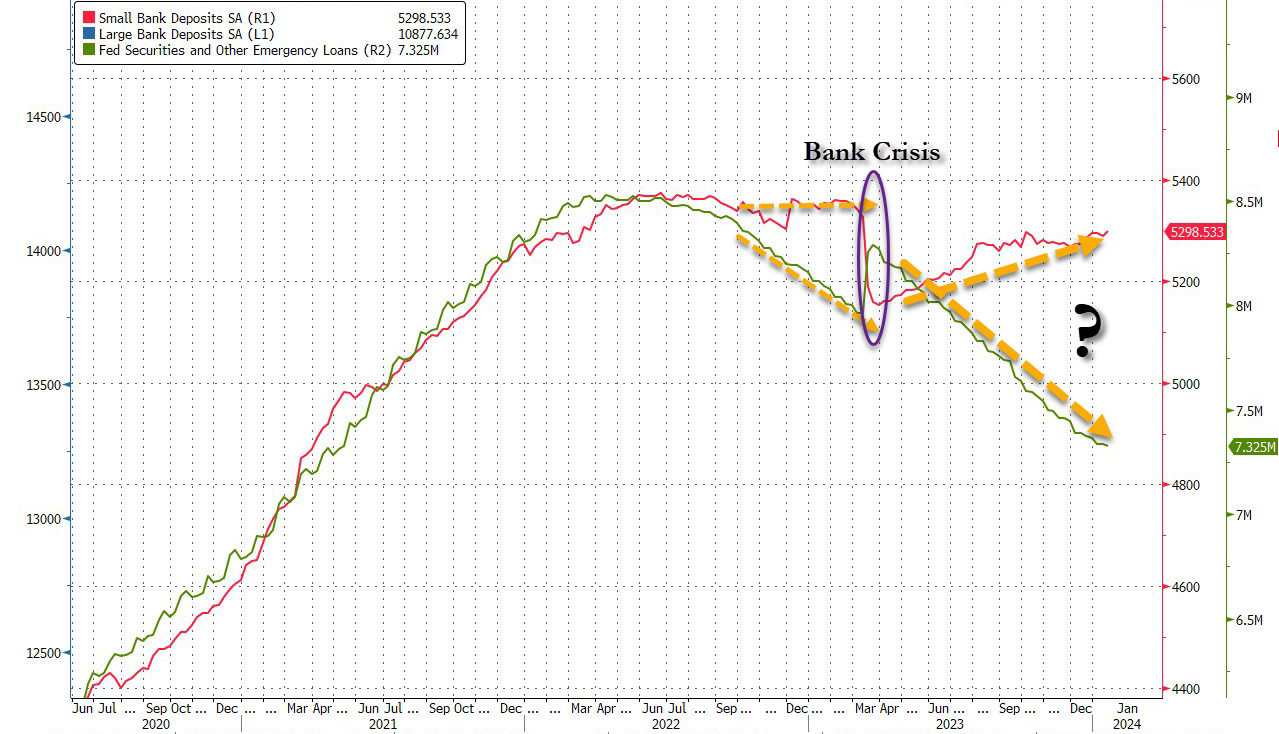
And hence the ‘soft landing’ mission is accomplished… so no need for rate-cuts? (Except for the banking crisis that looms in March).
Here is the roadmap for Bidenomics.


You must be logged in to post a comment.