Housing is simply unaffordable under Bidenomics, a strange brew of big corporate green subsidies, political handouts (any wonder why Biden is forgiving student loans in an election year?) and bad Fed policy errors.
But young Americans don’t always have a sugar daddy like Hunter Biden has who are willing to pay for rent for political parasites like those in Washington DC.
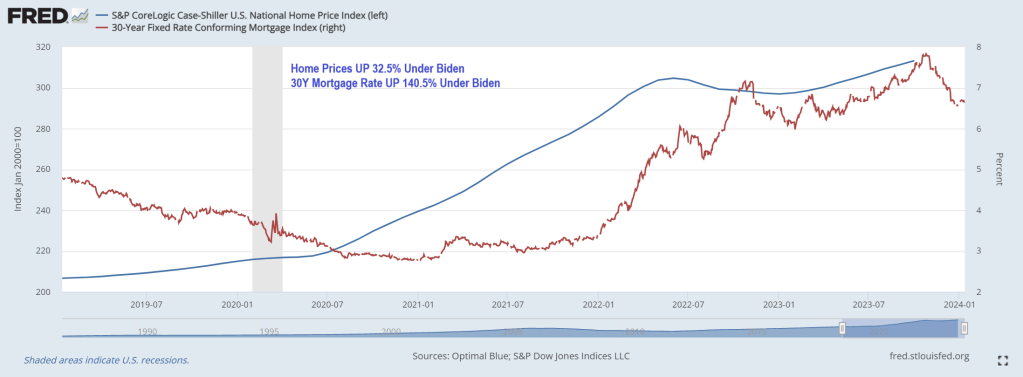
Young adults used to dream of moving out of their parents’ homes and into their own apartments, but living alone has become a luxury not everyone can afford. Not surprising, since home prices under Biden have risen 32.5% while 30-year mortgage rates are up a staggering 140.5% under Clueless Joe.
But in growth terms (year-over-year), White House Propagandists Karine Jean Pierre and John Kirby will no doubt focus on the cooling of housing prices and mortgage rates … although both are reaccelerating.
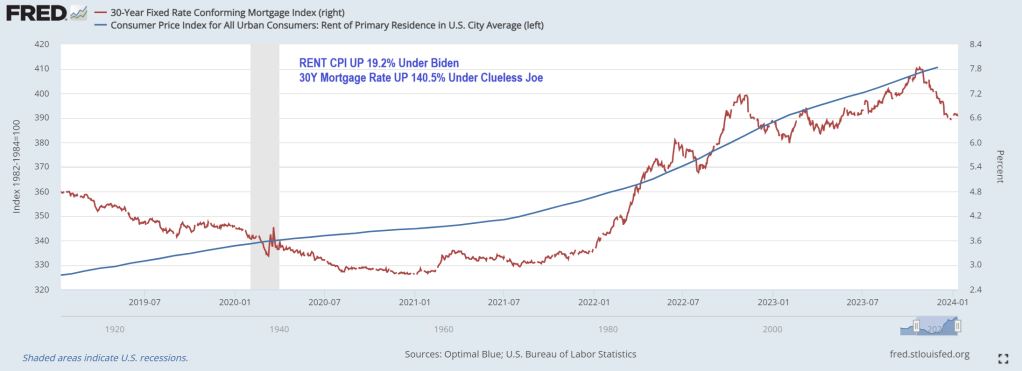
Rent CPI is up 19.2% under Clueless Joe.
How does this impact younger Americans? According to a recent study by Intuit Credit Karma, 31% of Gen Zers are living with their parents because they can’t afford to rent or buy their own place. Overall, 11% of American adults still live at home with their parents.
“The current housing market has many Americans making adjustments to their living situations, including relocating to less-expensive cities and even moving back in with their families,” said Courtney Alev, a consumer financial advocate at Intuit Credit Karma.
Even young adults who live alone are reconsidering their living arrangements because costs are too high.
About a quarter (27%) of Gen Zers reported that they could no longer afford rent and 25% said they’ll have to move back in with family to make ends meet.
Millennials are in the same boat: 30% say rent is unaffordable, and 25% are thinking about moving back in with their parents.
The research is consistent with a 2021 study conducted by the U.S. Census Bureau, which showed that one in three adults ages 18 to 34 live with their parents.
In a 2022 study, Pew Research also found that the percentage of Americans living with their parents has increased steadily since 2000. Pew calls these living arrangements “multigenerational households,” and said young adults ages 25 to 29 are most likely to cohabit with their parents.
Different studies, but all tell the same story: Finances are the top reason young adults are still living with family.
Housing and rental costs rise
It’s hardly surprising that young adults are struggling to make ends meet. Housing costs and living expenses have skyrocketed since the pandemic, and younger generations have faced the most financial hardship.
As Creditnews Research reports, Millennials and Gen Zers have been locked out of homeownership due to rising home prices, elevated interest rates, and stagnant real wages (adjusted for inflation).
For example, in 2023, Millennials accounted for only 28% of homebuyers despite being in their prime home-buying age. Gen Zers barely made a dent in the housing market, accounting for a paltry 4% of all buyers.
According to Fed data, average home prices were $431,000 as of the third quarter of 2023.
The rental market isn’t much better. Although rent costs have declined for three straight months, landlords are still asking for $1,964 per month on average, per Redfin data. Average rents were below $1,650 at the start of Covid.
But the problem of surging rents goes back much longer than that. According to a report from Moody’s Analytics, rent prices grew 135% between 1999 and 2022, while average incomes for all age groups were up 77% over the same period.
In terms of earning potential, younger generations are at the lower end of the totem pole, so they’re more likely to be affected by rising rent prices.
Where’s the “strong economy” everyone always talks about?
While the U.S. economy has steered clear of recession and unemployment remains near historic lows, Americans are still struggling to afford basic expenses. This is especially true for younger generations.
A 2023 study conducted by Deloitte found that more than half of Millennials and Gen Zers were living paycheck to paycheck. Perhaps shockingly, 37% of Millennials and 46% of Gen Z reported taking another part-time or full-time job just to afford their bills.
Working longer hours and barely scraping by is one of the main reasons why younger adults feel they’re worse off financially than their parents were at their age.
An August 2023 study conducted by The Harris Poll found that 74% of Millennials and 65% of Gen Zers believe they are starting further behind financially than previous generations.
“They’re telling us they can’t buy into that American dream the way that their parents and grandparents thought about it—because it’s not attainable,” said The Harris Poll CEO John Gerzema.
Remember, Clueless Joe Biden is in charge!(or Obama, take your pick).
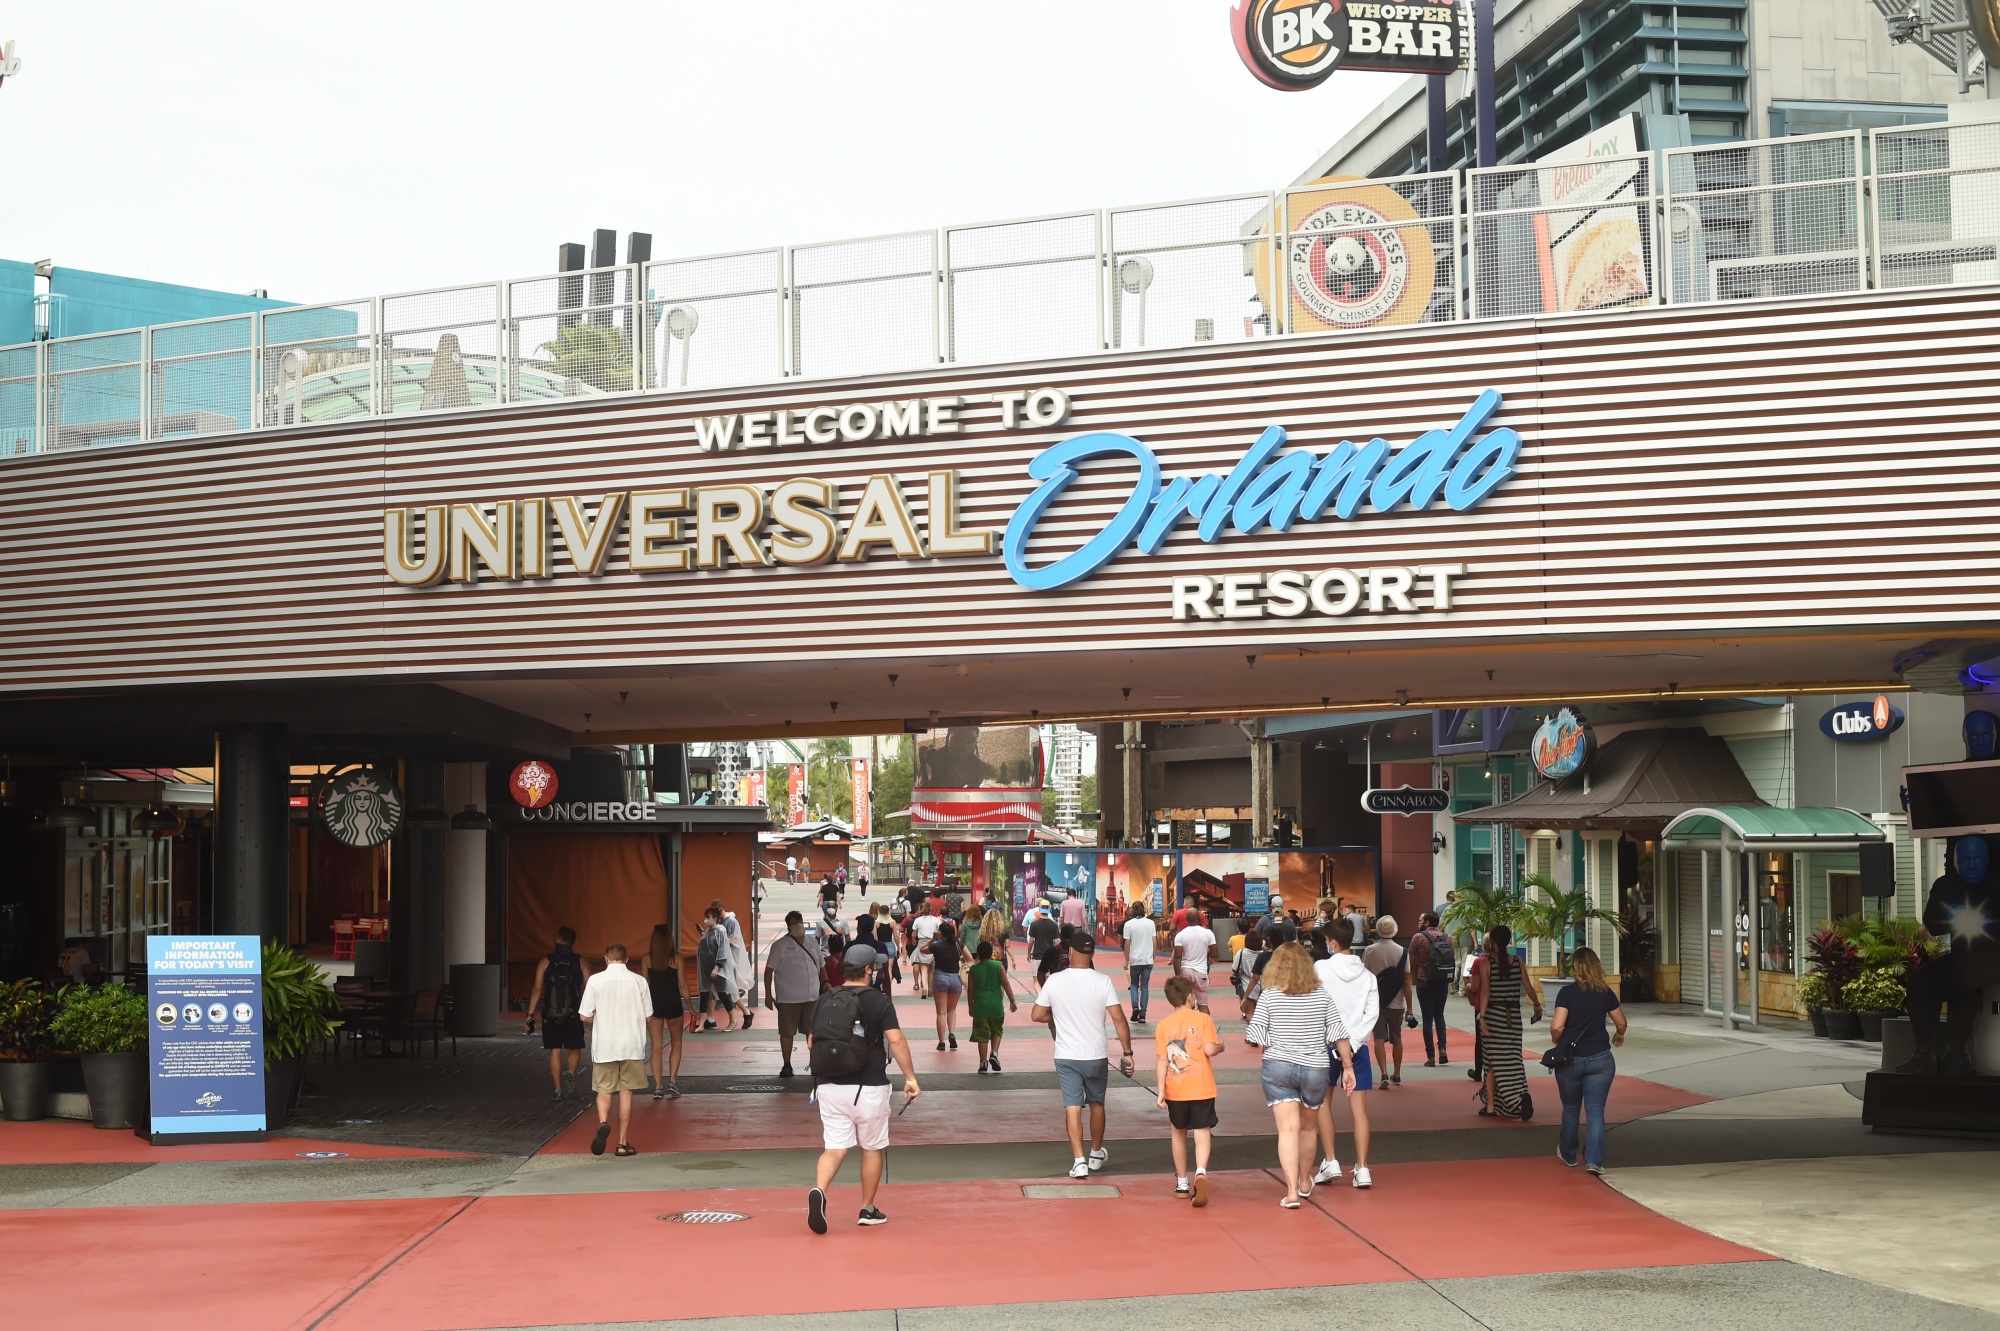
For visitors, Universal Studios Florida offers a chance to visit a fantastical land full of wizards, Minions and various characters from NBC Universal’s many film and television properties. But for the roughly 28,000 men and women who work at the 840-acre theme park and resort complex in Orlando, the troubles of the real world — like the rising cost of housing — are not far away.
Central Florida has seen some of the nation’s fastest pandemic-era rent increases, thanks to a confluence of job growth, migration and housing underproduction that has put a strain on residents. The average tenant in the region saw their monthly rent jump by $600 between early 2020 and early 2023. According to the National Low Income Housing Coalition, the Orlando-Kissimmee-Sanford metro area has one of the worst affordable housing shortages in the US, with only 15 available units for every 100 extremely low-income renter households.
The dire need for workforce housing is behind the entertainment conglomerate’s latest project in Central Florida: a 1,000-unit mixed-use development, set to open in 2026, that promises to give tenants who work in the service industry a short commute to the constellation of tourist attractions and hotels nearby. To launch the project, Universal donated 20 acres of land adjacent to the Orange County convention center. Called Catchlight Crossings and built in partnership with local developer Wendover Housing Partners, the project broke ground in November.
Universal’s nearby rival is also wading into affordable housing. In 2022, Walt Disney Co.announced plans to donate 80 acres for a proposed 1,450-unit affordable development a few miles to the southwest. Also set to open in 2026, the project would be built near Flamingo Crossings Village, a campus for participants in Disney’s college internship program that also leases units to some Disney World cast members. (Oh great, brainwashing by woke Disney types).
As housing costs in Central Florida have soared, the theme park giants have faced criticism for underpaying workers. In June, Universal raised its minimum wage by $2 to $17 an hour, while Disney, which employs 82,00 people in Florida, agreed to bump its starting hourly rate to $18 in 2024. Still, both lag behind the $18.85 that the Massachusetts Institute of Technology’s Living Wage Calculator estimates would be needed to support an adult with no children in Orange County.
Visitors throng Disney’s Magic Kingdom in Orlando.Photographer: David Ryder/Bloomberg
Even smaller theme parks in more affordable areas have become homebuilders in an effort to ease the housing crunch. In May, Indiana’s Holiday World opened a $7 million development called Compass Commons, which is meant to provide seasonal housing for up to 136 employees. It will replace a proposed theme park attraction that was set to open last summer.
Such partnerships between entertainment industry employers, developers and local government represent the latest spin on a solution for the ongoing scarcity of apartments for lower-income households. Catchlight Crossings is part of Universal’s Housing to Tomorrow initiative, which was inspired by the Orange County mayor’s Housing for All Task Force. The company represents almost 10% of the tax base of Orange County, which includes Orlando.
“What could we do that would be more than just the typical corporate response?” said John Sprouls, executive vice president and chief administrative officer at Universal Parks and Resorts. “If you’re going to provide affordable housing, providing affordable housing where the jobs are sure makes a lot of sense.”
The Truly Missing Middle
Workforce housing is a much-needed housing type without a precise definition. Unlike affordable housing, which must meet stringent rental rates matched to specific income levels to qualify for government support and subsidies — typically 40% of units need to be priced to support those households who make 60% of the area median income — workforce housing stands as more of a catch-all term. Some define it as housing that serves those making between 80% and 120% of median area income. Often, the term is used to invoke housing for teachers, first responders and other public servants who have been increasingly priced out of expensive metros.
Over the last decade, and through the recent pandemic-era surge in apartment construction, developers have largely ignored the lower end of the market, focusing instead on Class A apartments. Beginning in 2013, half or more of units delivered each year were considered high-end or luxury, according to statistics from the National Multifamily Housing Council. Only since the middle of 2022 has that shifted towards Class B, or more affordable units.
Seeking lower production costs and rents, a handful of big developers have created new sub-brands of apartments designed to appeal to less-monied tenants. Grubb Properties launched a series of “car-light” developments called Link, which emphasize accessibility to major urban employers, while Greystar’s Modern Living Solutions concept offers modular multifamily buildings that are assembled on site from factory-built elements in an effort to trim construction costs.
To promote more construction of this type of housing, a bipartisan coalition of federal lawmakers recently introduced the Workforce Housing Tax Credit Act. Like the low-income housing tax credit, the proposed legislation would provide tax credit to investors who build affordable apartments. The bill’s sponsors, including Oregon Senator Ron Wyden, say the credit would finance approximately 344,000 affordable rental homes. It’s been a pet issue for Wyden in particular; 70% of Oregon school districts have built or rented housing to provide support for their teachers.
Nationwide, the US is short approximately 2.2 million workforce units, according to a 2022 Fannie Mae study. Central Florida’s service-based economy has left it with one of the highest levels of need, Wendover founder and Chief Executive Officer Jonathan Wolf said. There are roughly 100,000 people living within a five-mile radius of Catchlight Crossings who would income-qualify for the development.
Besides pools for residents, the proposed Universal development will include such amenities as a preschool and adult education center.Credit: Wendover Housing Partners
Rents at the Universal-led project will range from $400 to $2,200, depending on income qualifications (the average two-bedroom unit in the area rents for just shy of $1,900 a month). The development will also contain medical offices, retail, community space including pools and fitness centers, bike and walking paths and a tuition-free Bezos Academy preschool and adult education center. A transit center will connect residents to buses, ride-hailing services and company shuttles; a stop on the proposed Sunshine Corridor, a new east-west rail line that’s designed to help tourism workers get around, may take shape nearby.
“You’re not creating an economic ghetto,” Wolf said. “You’re creating a lifestyle enhancement for so many people, giving folks the ability for mobility.”
The theme park giant owns a few thousand acres in the area, so this was a relatively small donation, according to Sprouls. It also comes during a time of booming profits: Central Florida’s tourism industry generated a record $87.6 billion in economic impact in 2022. And since Universal transferred the land via a 501c3 charity with deed restrictions, the donation can lower development costs and help ensure long-term affordability; lots of affordable housing tends to revert back to market-rate pricing after a set term.
Employer-sponsored projects like Catchlight Crossings can’t mandate that only their employees can be tenants — that would violate fair housing rules. But for a customer-facing company like Universal, working to close the region’s housing gap can pay direct benefits, Sprouls said. When employees can’t find housing nearby and need to drive hours to get to work, it impacts not just their performance, but the guest experiences that drive satisfaction and repeat visits.
Park guests arrive at the Universal Studios theme park in Orlando in 2020.Photographer: Zack Wittman/Bloomberg
“It helps us to be able to recruit because people are able to have jobs here,” Sprouls said. “Salaries go into making you an attractive employer in the area, but you also need to make this an attractive place to live.”
Corporate Housing’s Mixed Record
Still, it remains to be seen if privately financed efforts like the Universal and Disney investments can have a significant impact on the lives of local renters. Other industries, most notably tech, have poured hundreds of millions of dollars and even billions into financing the construction of workforce housing near their headquarters. Amazon.com Inc., Google and Meta Platforms Inc. have all done variations of this kind of development, with mixed results. Many such efforts took off after severe backlash to the impact tech jobs had on local housing markets, and most were in the forms of loans, financing and leases, which can be helpful but not exactly game-changing. Recent swings in interest rates and increases in housing costs, not to mention struggles in the tech industry, have curtailed many of these programs.
“There was a lot of energy, and then there wasn’t,” Alex Schafran, a visiting scholar at San Jose State University’s Institute for Metropolitan Studies and a former consultant for Facebook’s housing initiative, told the Guardian. “The balloon didn’t pop overnight, but now there’s very little air in it.”
And the support of powerful local employers can’t inoculate these projects from community pushback. At a town meeting for the Disney project in September, residents raised a host of familiar objections about traffic congestion, school crowding and site location. When it comes to building multifamily developments, even Goofy has to contend with NIMBYs.
Wendover’s Wolf argues that while the financing part is critical, it may not be enough. His firm has been very involved in pushing for more government support for the affordable housing projects they specialize in. Associate Ryan von Weller, for example, was among the local developers who consulted with Florida lawmakers on a state bill, Live Local, which directed more than $700 million into supporting affordable housing. (Sprouls said Universal won’t see any tax benefits from their land donation.) But Wolf believes the area’s big corporate employers need to play a bigger role in solving this crisis.
“We need your involvement in it in a very direct way to work alongside us, to make this a success,” he said. “It’s not just a simple check and walk away. We need the land. We need cooperation.”
Here is the REAL problem with the lack of housing stock. Growth of new housing units has slowed to negative speeds as mortgage rates soared, but aren’t growing again with declining mortgage rates which remain relatively high. Add in the 11 million or so illegal immigrants crossing the border and we have a major problem.
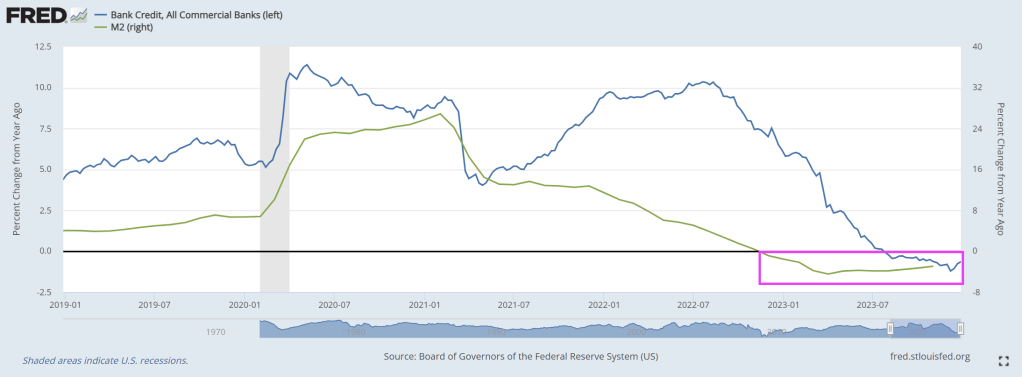
The Federal Reserve has tightened their monetary manipulations to combat inflation caused by loose monetary policy and excessive spending by Biden and Congress.
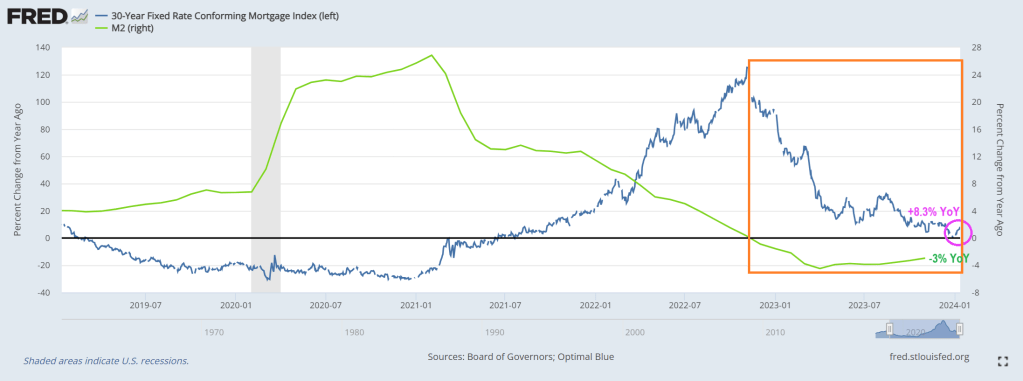
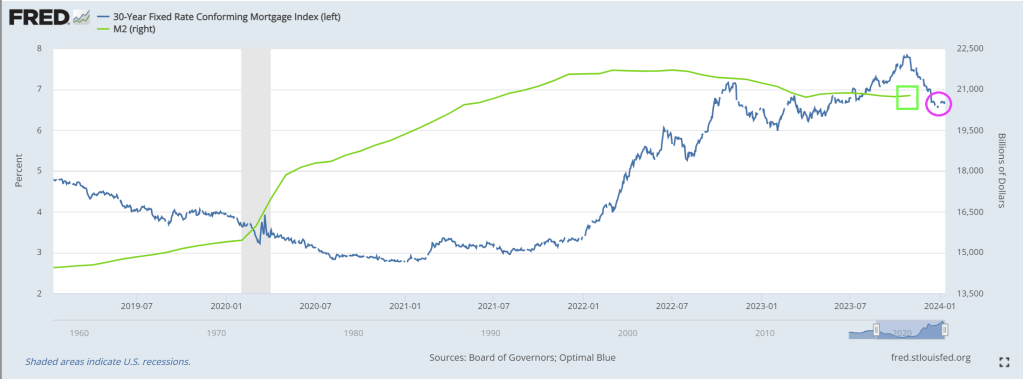
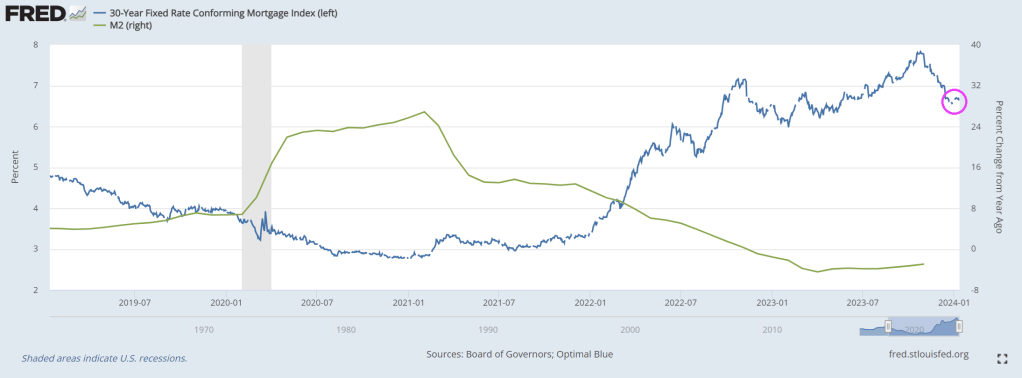
The result? US conforming 30-year mortgage rates are up 8.3% since last year and up a whopping 141% since the beginning of 2021 (the year Biden was selected to be President).
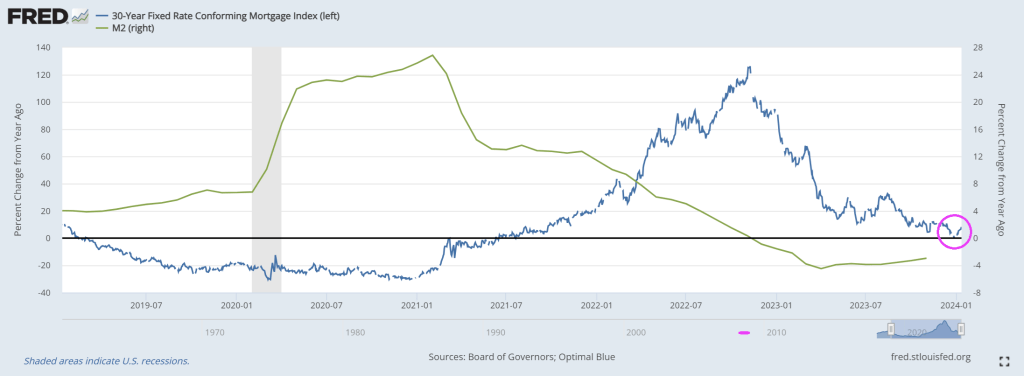
Check out mortgage rate GROWTH (blue line) as M2 Money growth *green line) went negative (orange box).
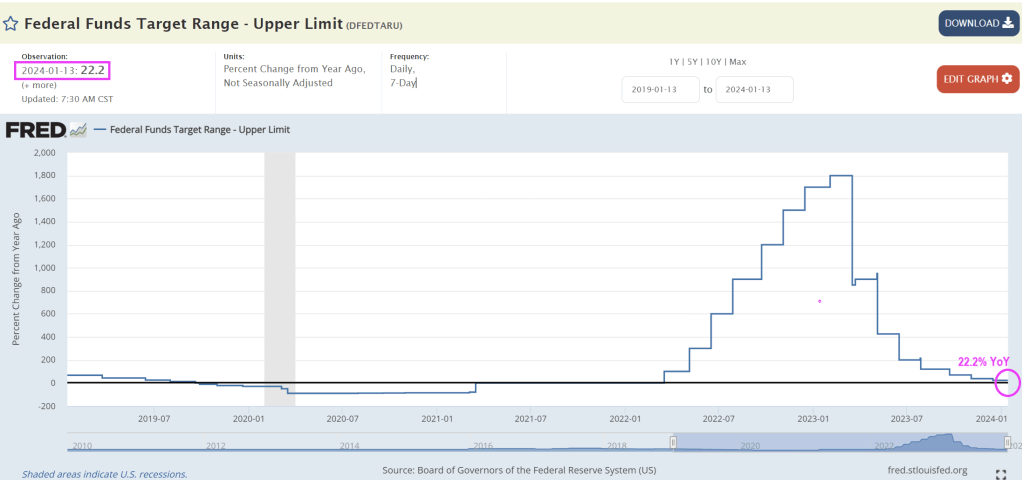
This graph corresponds nicely with this chart of YoY changes in The Fed Funds rate. Which is still rising at a rate of 22.2% year-over-year (YoY).
The 30-year mortgage rate had been falling after peaking in August 2023 after peaking at 7.299%. The latest reading on January 11, 2024 was 6.662%.
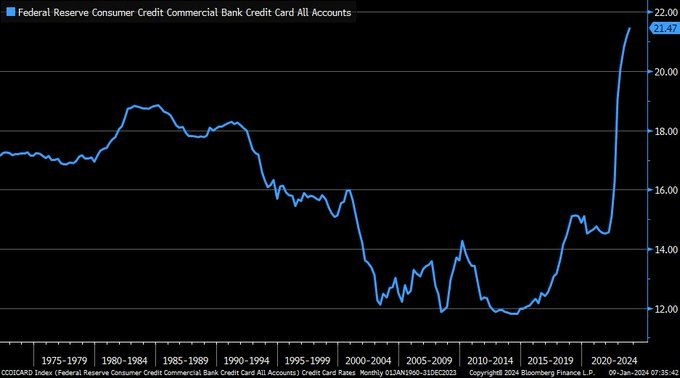
For example, US credit card debt is at an all-time high as consumers attempt to cope with inflation under Biden.
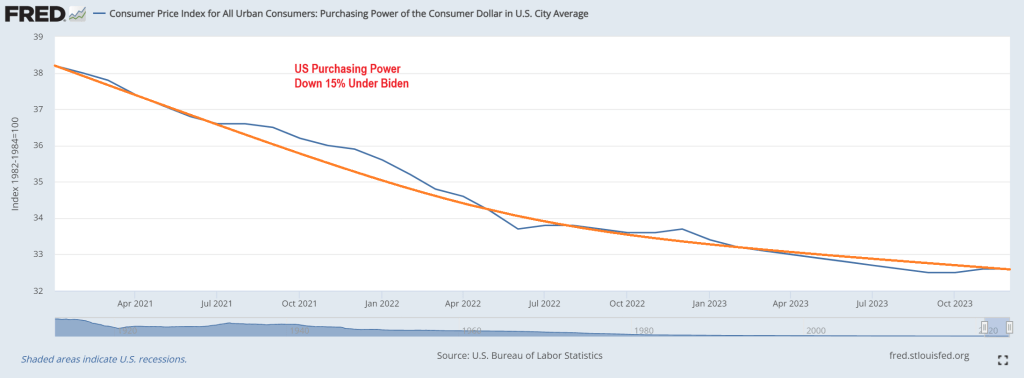
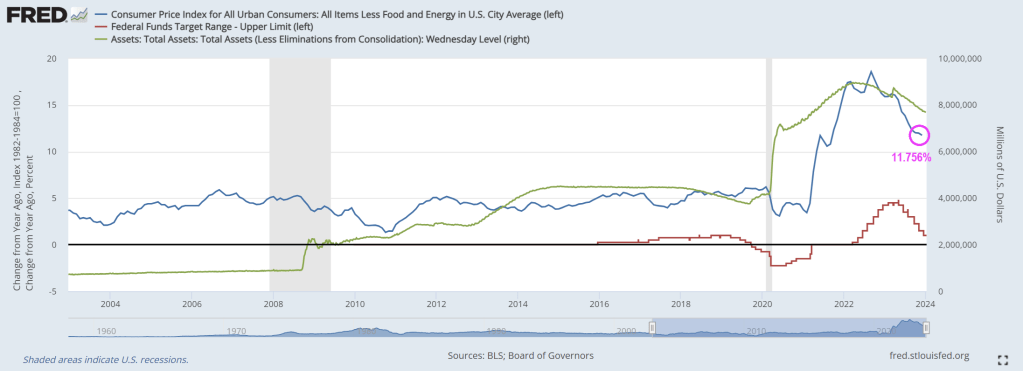
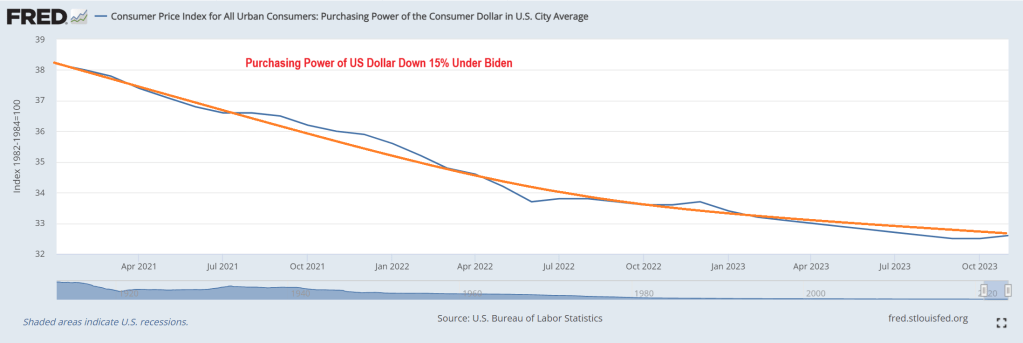
While inflation RATE is finally cooling off, the LEVEL of inflation remains high. Purchasing power for consumers is down 15% under Vacation Joe.
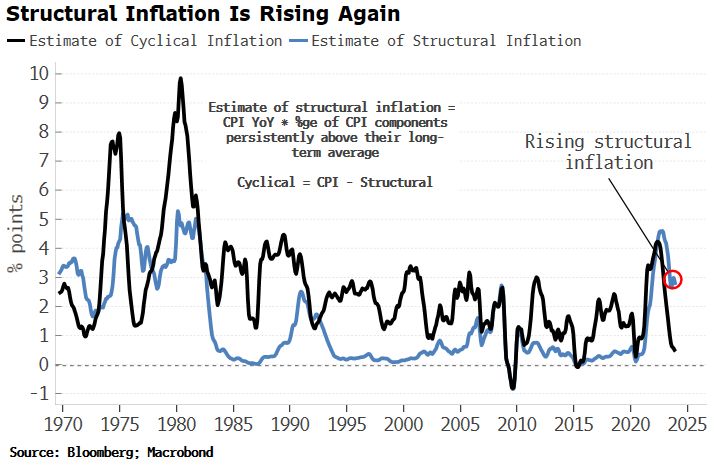
With structural inflation rising again.
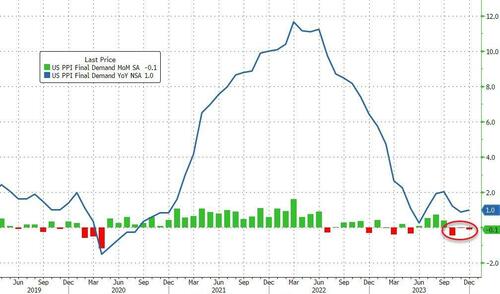
Following yesterday’s hotter-than-expected CPI, this morning’s Producer Price Index was expected to accelerate (headline not core). However, it did not – headline PPI actually decline 0.1% MoM (+0.1% MoM exp). That is the 3rd straight month of ‘deflation’ but inched PPI YoY up to +1.0%
Source: Bloomberg
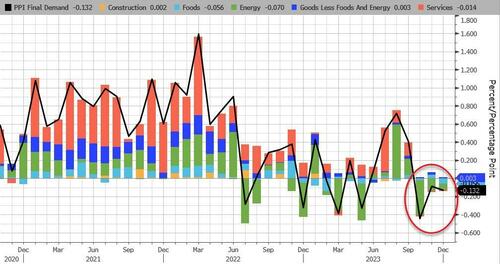
Energy and Construction cost deflation dominated the headline PPI MoM decline…
Source: Bloomberg
Energy and Food deflation dominated the slowing of the YoY PPI (though Services is re-accelerating)…
Source: Bloomberg
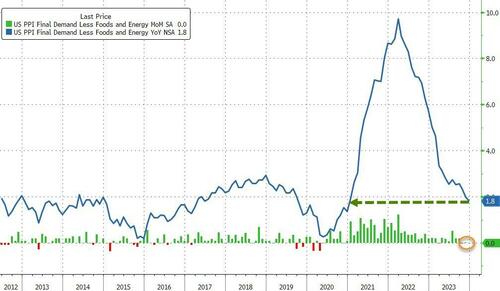
Excluding food and energy, the core PPI was unchanged MoM in December – the third month of unchanged in a row, which dfragged the Core PPI YoY down to +1.8% (the lowest since Dec 2020)…
Source: Bloomberg
Goods PPI deflated and Services was unchanged…
Half of the decrease in the index for final demand goods is attributable to prices for diesel fuel, which dropped 12.4%
Over 80% of the decrease in the index for unprocessed goods for intermediate demand can be attributed to a 13.2% drop in prices for crude petroleum.
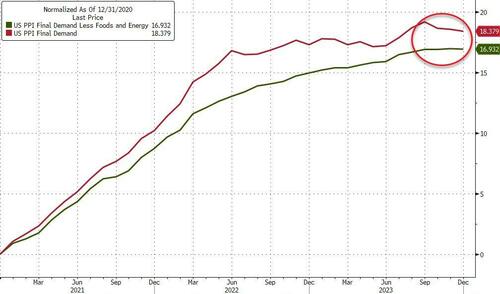
Reminder, disinflation does not mean lower prices. Core producer prices are up 16.9% since President Biden came into office (and headline PPI up over 18%)…
Source: Bloomberg
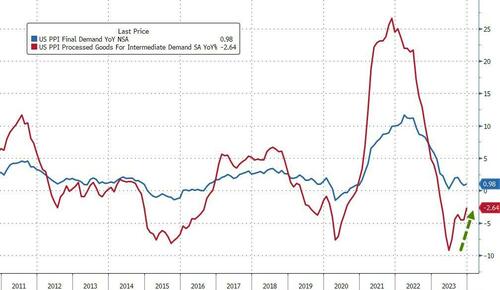
Finally, the deflationary impulse remains for the headline PPI as ‘intermediate PPI’ remains below zero BUT it is starting to accelerate higher…
Source: Bloomberg
That’s a little worrying given The Fed seems adamant it wants to cut in March to save the banking system from collapse.
I am amazed that the Biden family babysitter (Jill Biden) is trashing Trump supporters calling them insurrectionist and dangerous extremists while her demented husband tries to use courts to remove his primary Presidential candidate from the ballot and violates Federal law by leaving the border wide open, letting in millions of unvetted immigrants. Rep Jerry Nadler (D-NY) admitted that he is in favor of open borders because 1) fruits and vegetables need to be picked and 2) Democrats need to import Democrat voters because Americans are fed up with Democrat policies. Like rampant inflation.
And Jill Biden said Joe works hard EVERY DAY! Except for the near 40% of his Presidency spent on vacations to Delaware, Nantucket, Virgin Islands and whereever else large corporate donors live.
Well, we have news for you: if 2023 was bad, 2024 – an election year of course – is shaping up to be far worse.
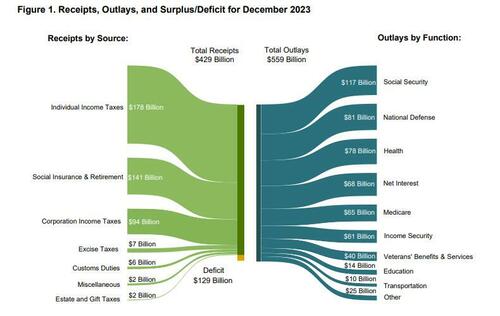
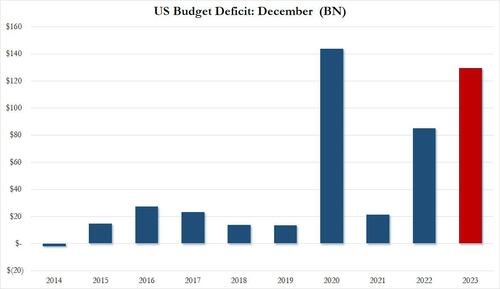
Moments ago the US Treasury reported the budget deficit picture for December and it will come as no surprise to anyone that the US has continued to spend like a drunken sailor, or rather, even more. As shown in the chart below, in the month of December, the US collected $429 billion through various taxes, while total outlays hit $559 billion…
… resulting in a December deficit of $129.4 billion.This may not sound like a lot, but December is actually one of those months when the US deficit is relatively tame, or used to be.
As shown in the next chart, traditionally the December deficit was barely in the $10-20BN range… until 2020 when it exploded to an all time high of $140BN. And while it dropped sharply in 2021, it rebounded dramatically in 2022, and rose to just shy of the December crisis high last month!
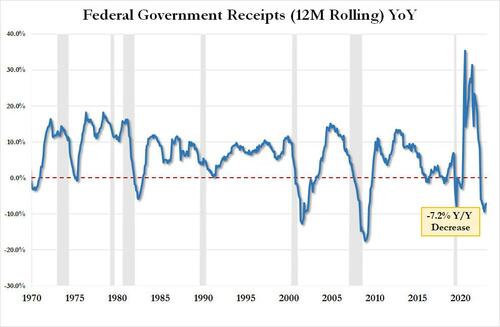
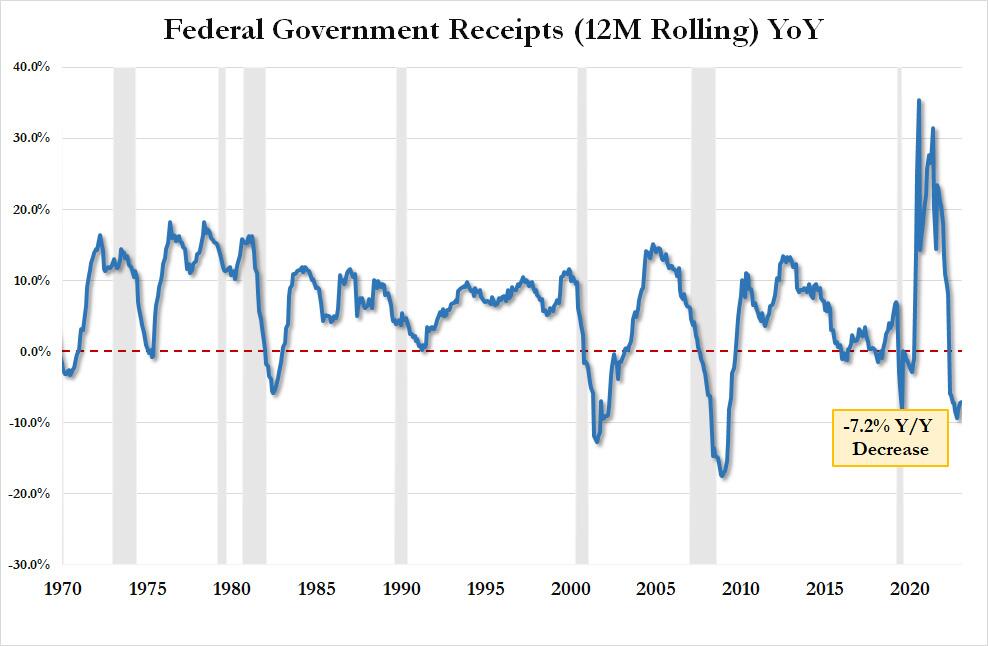
Here is some more context: tax receipts of $429.3BN in December were down 5.6% from the $454.9BN in December 2022 and down a whopping 11.8% from December 2021. On an LTM basis, US total tax receipts were $4.521TN, or down 7.2% YoY. This is now the 9th consecutive YoY decline in LTM tax receipts, something that historically has only taken place when the US was in a recession. As an aside, the “smart economists” were certain that the collapse in tax receipts would reverse after November when the postponed California taxes would be collected. Well, November has come and gone and the big picture is just as ugly.
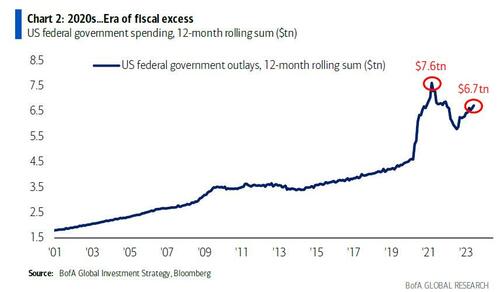
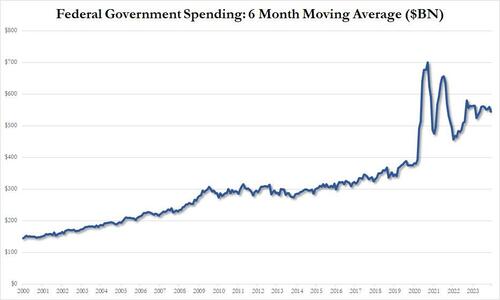
Looking at outlays, unlike tax receipts, there is danger of a decline… ever; and indeed in December the US spent a total of $559 billion, up 3.5% from the $540BN spent a year ago, and up even more from the $508BN in 2021. On a 6 month moving average basis, we are rapidly approaching the exponential phase even when accounting for the spending burst in 2020 and 2021.
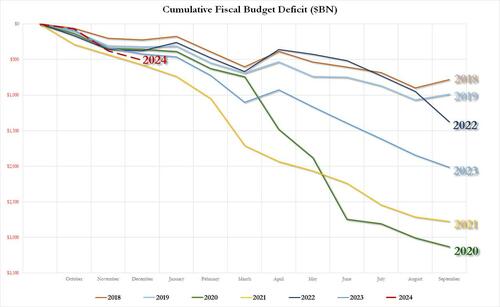
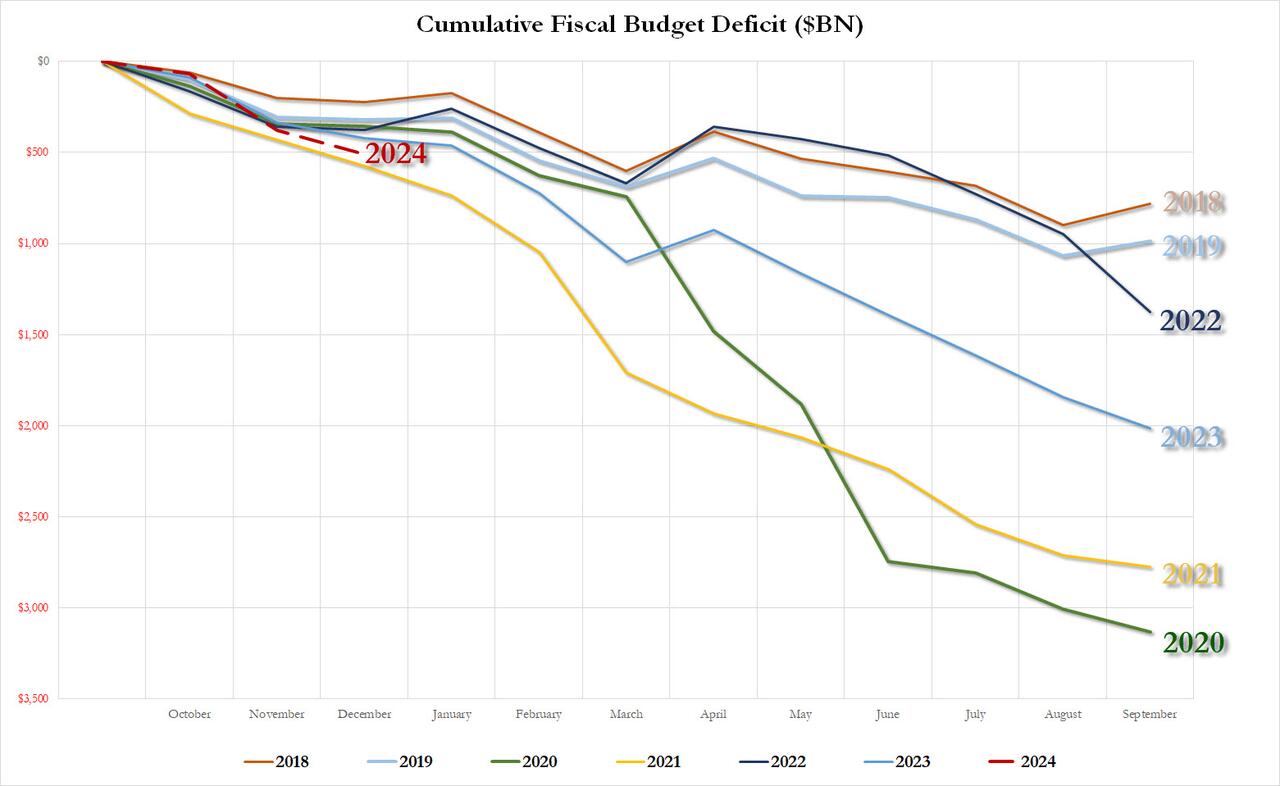
Putting it all together, we get the scariest chart of all: the YTD budget deficit three months into fiscal 2024 is already $509 billion, which would be the biggest deficit in US history after one quarter with the exception of the covid outlier year of 2021 when the US injected multiple trillions in stimmies.
As for the final, and most shocking, data point, the December budget deficit of $129.4 billion was more than $40BN higher than the $87.5BN median estimate, and was more than 50% higher compared to the $85BN December deficit in fiscal 2022.
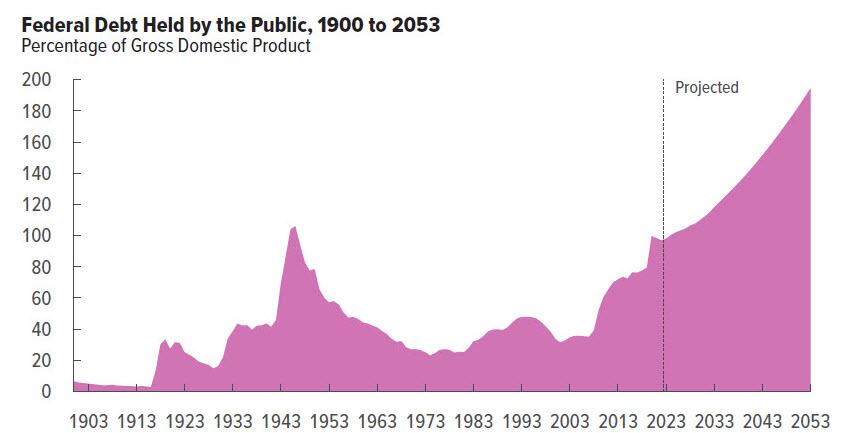
Needless to say, this is completely unsustainable and assures fiscal collapse for the US, not if, but when. Then again, we already knew this thanks to the CBO which was kind enough to chart the endgame:
What is funniest about all this is that the US is on an accelerating path to ruin less than one year after the imposter in the White House published this laughable propaganda.
We can’t wait to see what really happens to the budget deficit over the next 10 years. Spoiler alert: there won’t be a happy ending.
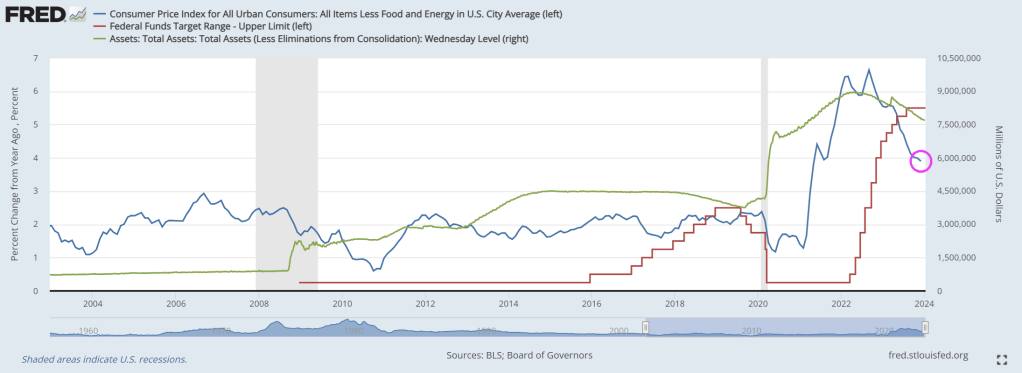
Although core inflation declined in December (CPI all items less food and energy), it is still hot, hot, hot at 4% Year-over-year (YoY). This raises the following question: Is The Fed tightening too much? Aka, yet another Fed policy error?? Since The Fed target rate is 5.50% and core inflation is now 4%?
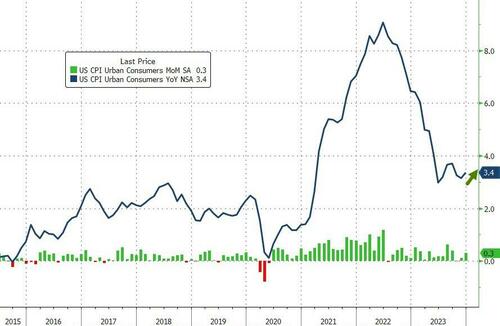
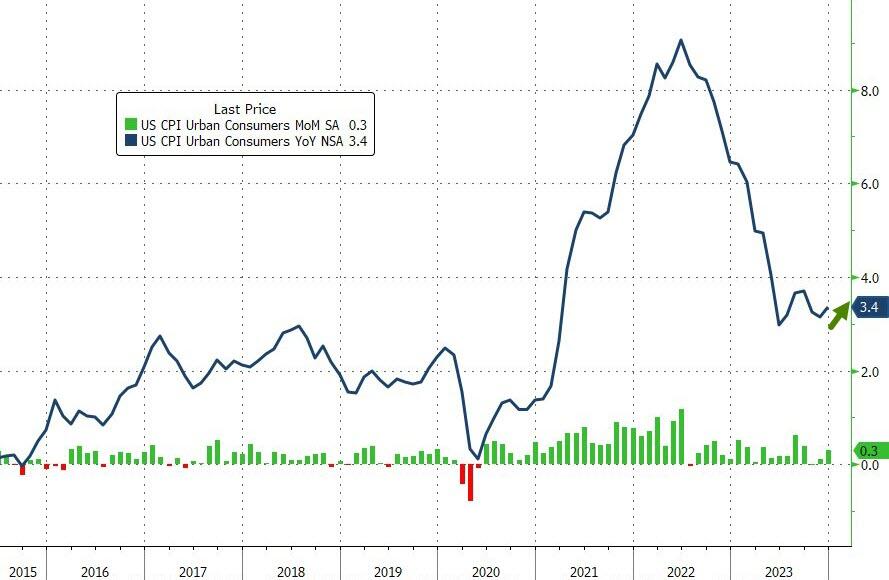
Headline Consumer Price Inflation printed hotter than expected in December, +0.3% MoM vs +0.2% exp and +0.1% prior, pushing the YoY headline CPI up to +3.4% (from +3.1% prior and hotter than the +3.2% exp)…
Source: Bloomberg
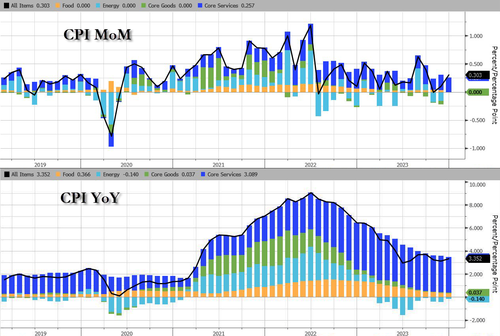
Services (Shelter mostly) costs re-accelerated and energy deflation stalled in December…
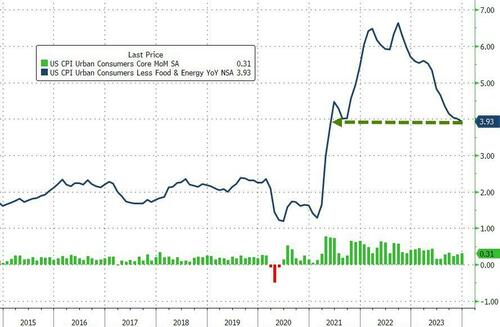
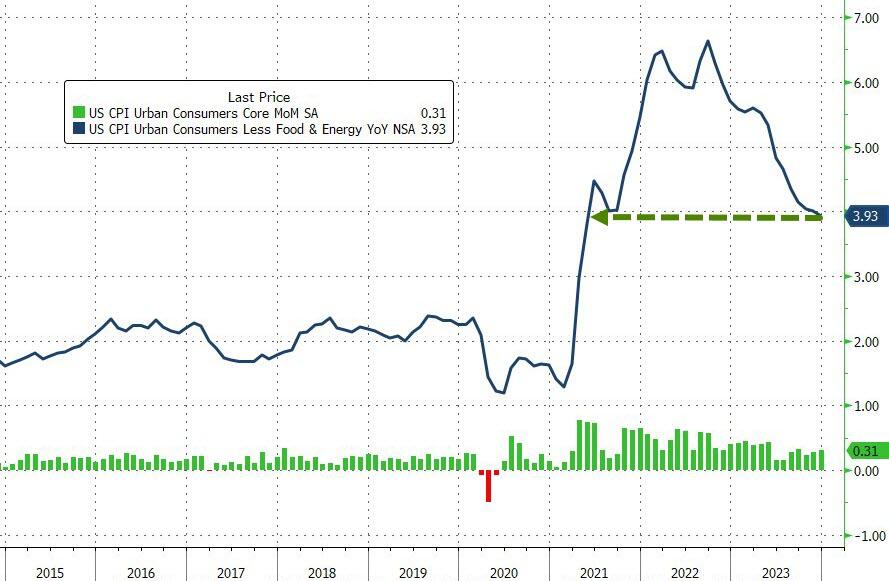
On the brighter side, core CPI according to the BLS rose 0.3% MoM as expected, dropping the YoY change below 4.00% for the first time since May 2021…
Source: Bloomberg
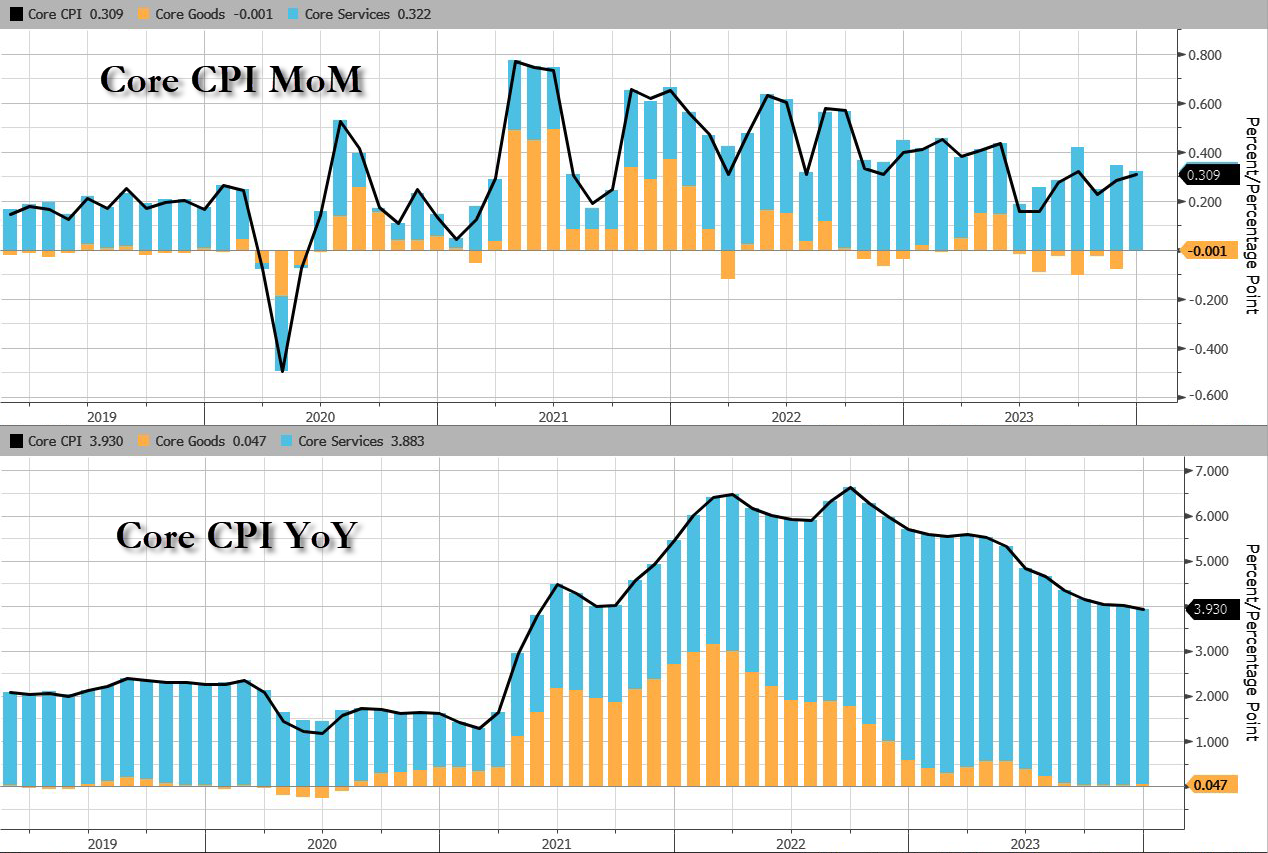
Goods deflation has stalled as the used cars and trucks index rose 0.5 percent over the month, after rising 1.6 percent in November.
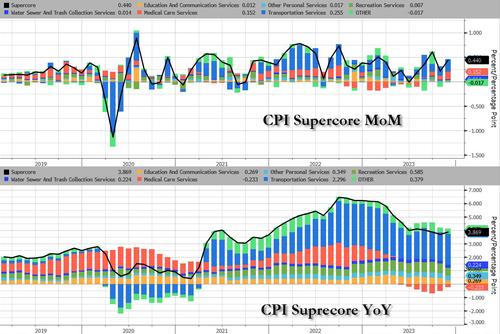
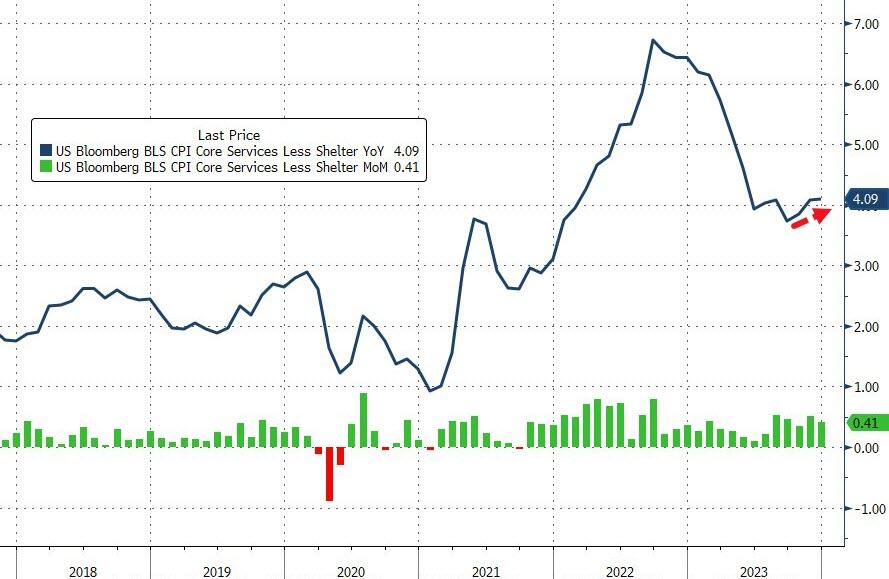
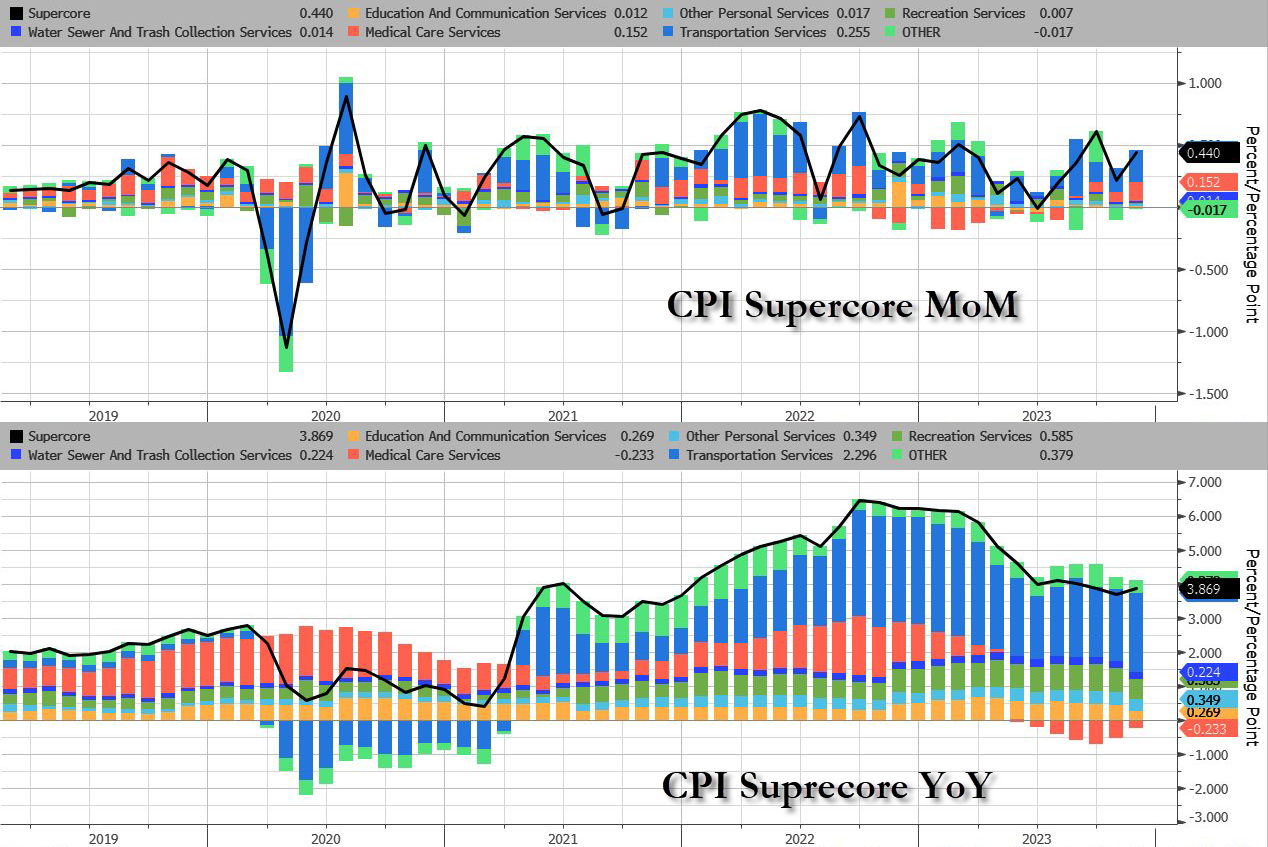
More problematically for The Fed (and the rate-cut ‘hypers’), is the fact that Core CPI Services Ex-Shelter (SuperCore) rose 0.4% MoM, upticking the YoY rise to +4.09%…
Source: Bloomberg
This is a category that Fed Chair Jerome Powell and other policymakers have highlighted as a focus.
All the subsectors of SuperCore rose MoM with the shelter index increased 6.2 percent over the last year, accounting for over two thirds of the total increase in the all items less food and energy index.
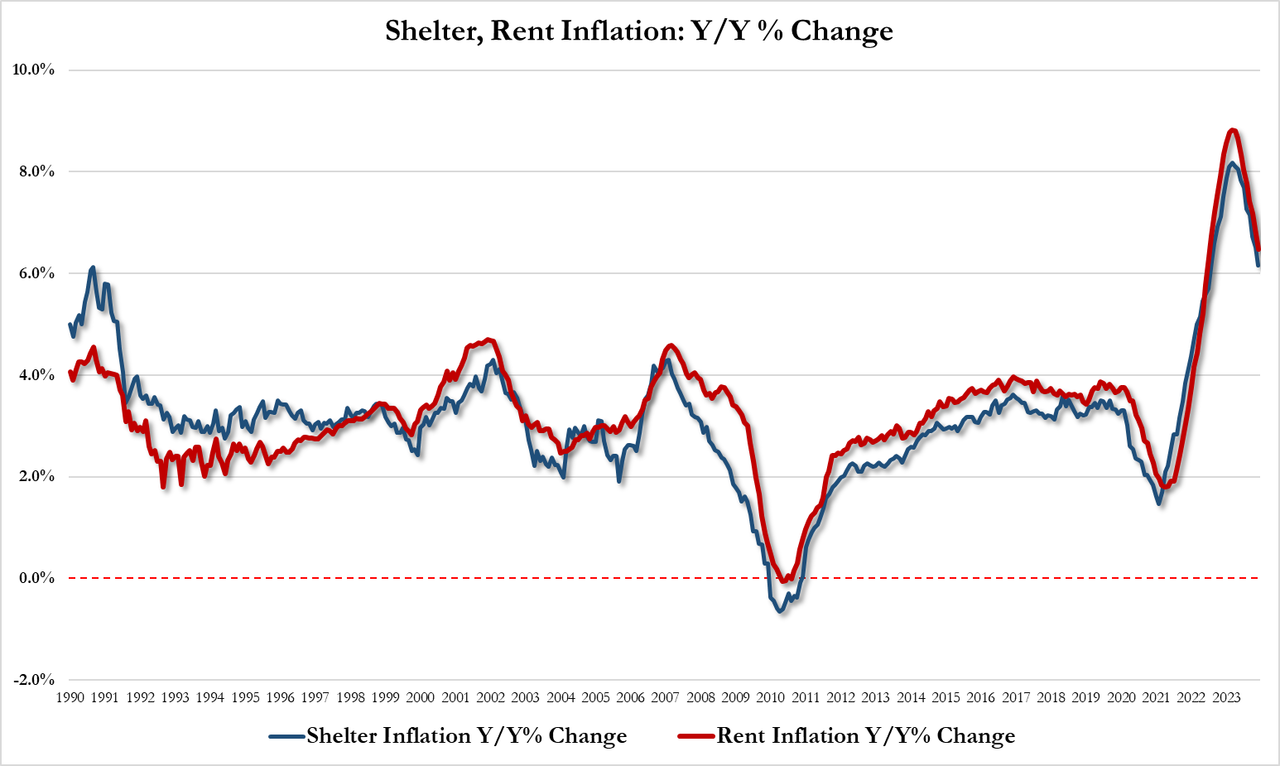
But shelter inflation is slowing (slowly):
Shelter inflation was up 6.15% YoY in Dec, down from 6.51% in Nov and the lowest since July 2022
Rent inflation was up 6.47% YoY in Dec, down from 6.87% in Nov and the lowest since July 2022
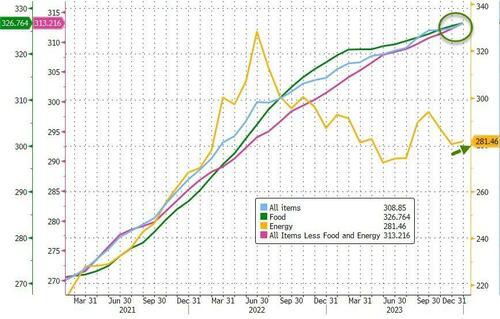
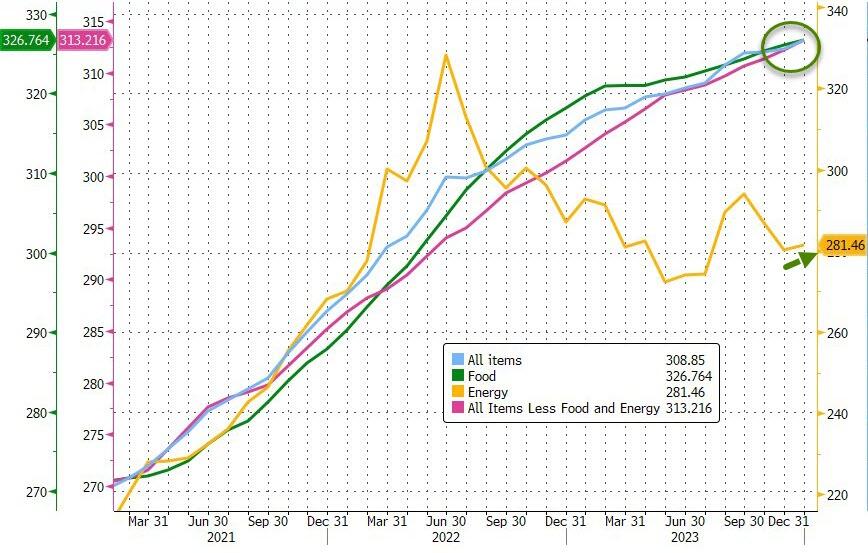
And the next time someone from the Biden administration says ‘inflation is down’ in an attempt to gaslight the public into believing ‘prices are down’ – show them this chart…
Headline costs at record highs
Core costs are record highs
Food costs at record highs
Fuel costs on the rise again
Source: Bloomberg
Four of the six major grocery store food group indexes increased over the month.
The index for meats, poultry, fish, and eggs rose 0.5 percent in December, led by an 8.9-percent increase in the index for eggs.
The index for food away from home rose 5.2 percent over the last year.
The index for limited service meals rose 5.9 percent over the last 12 months, and the index for full service meals rose 4.5 percent over the same period.
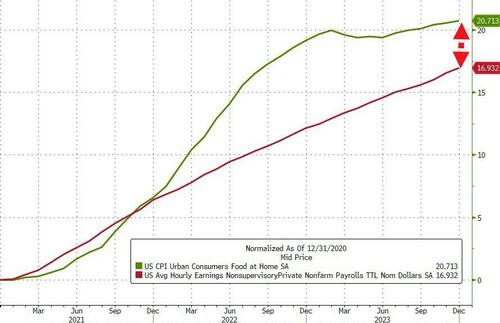
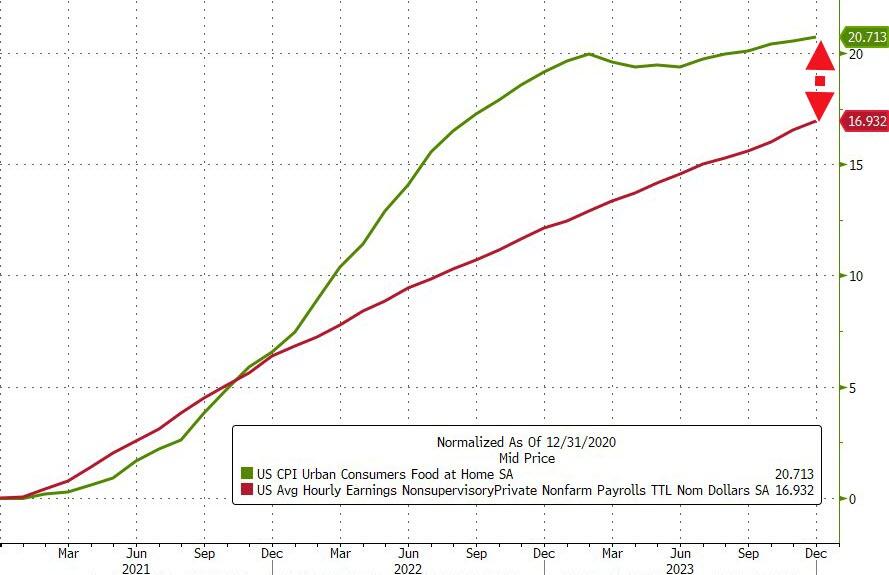
The White House was quick to note that real hourly earnings was positive in December (+0.8% YoY) but that number is the aggregate of ALL American workers.
If we drill down to the ‘average joe’ – production and non-supervisory jobs – their wages are up 17% since Biden was elected… The only problem is, the cost of food since then has surged almost 21%…
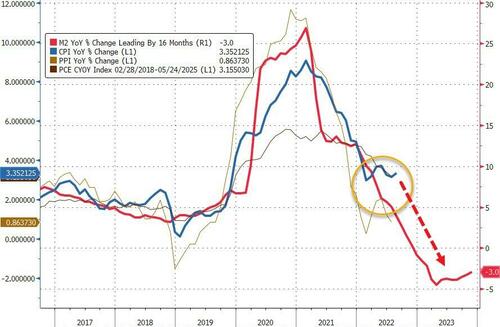
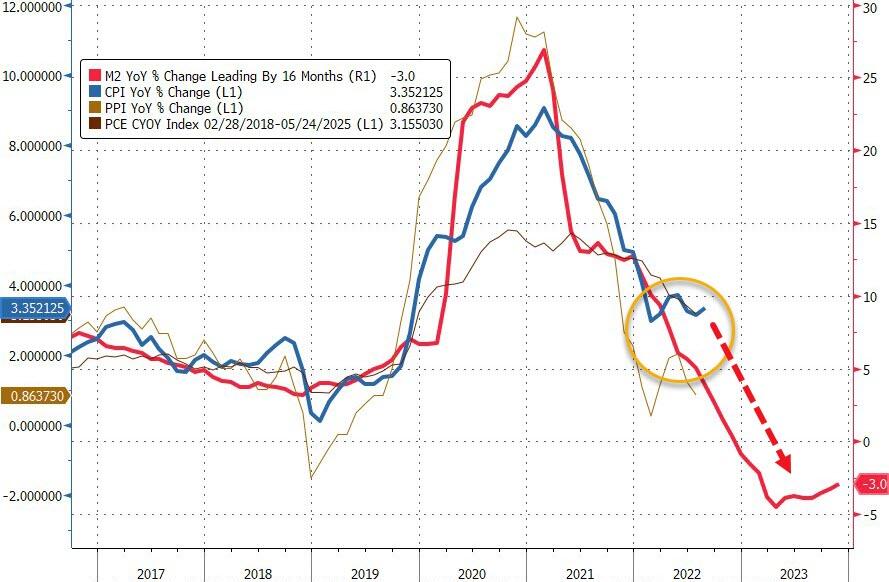
Is this a pause before the re-plunge? M2 thinks so…
So what happens next?
Not so much Goldilocks perfection.
Powell is in a real pickle now – does the Fed begin shrinking QT in March (which it has to if it is terminating BTFP and Reverse Repo is drained) without starting rate cuts.
Here we sit with core inflation rate BELOW the current Fed Funds Target Rate (upper bound). So is it time to start withdrawing its more than ample monetary stimulus. Like the Bank Term Funding Program.
The Federal Reserve is likely to retire the Bank Term Funding Program in March. This would entail an additional ongoing headwind for reserves, and thus liquidity, through 2024. At the margin, this adds weight to the case for the Fed cutting interest rates sooner in the year.
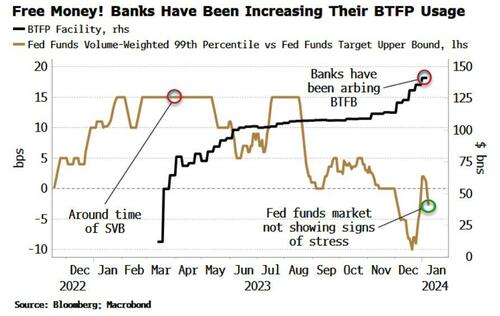
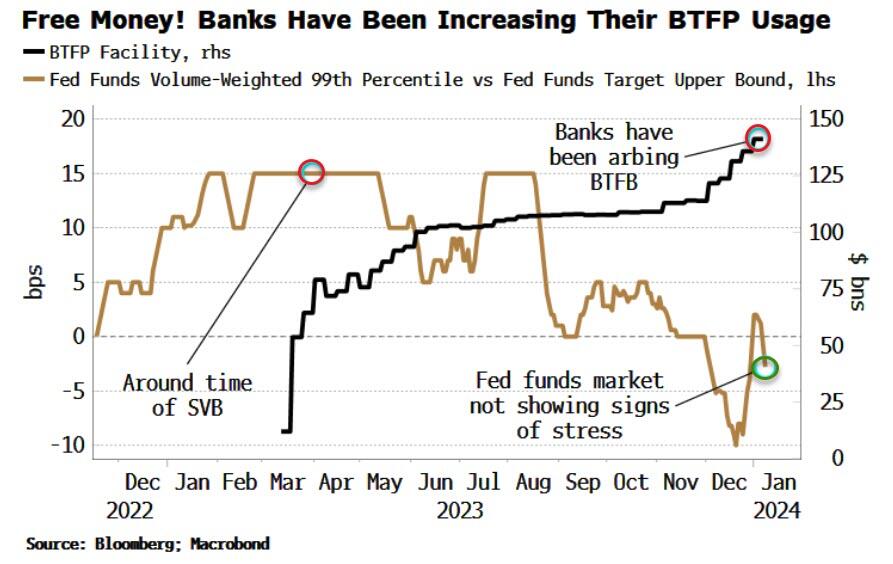
The BTFP was created in the wake of the SVB crisis to help struggling banks get access to liquidity when bond prices were dropping. However, its use in recent months has jumped to over $140 billion. That is not, however, a sign of banking stress.
The chart below shows the usage of the BTFP along with the rate paid at the 99th percentile in the fed funds market relative to the upper bound of the range for fed funds.
As can be seen, this is under zero, i.e. banks are not having to pay up to get liquidity.
This is in stark contrast to last March at the time of SVB’s fall when some banks were having to pay 15 bps above the fed funds upper bound for liquidity.
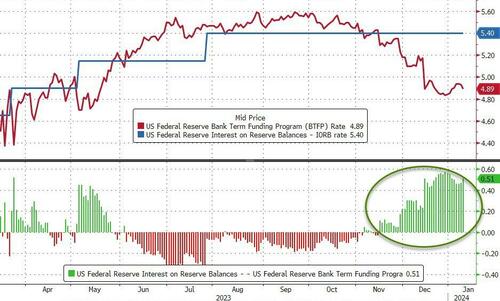
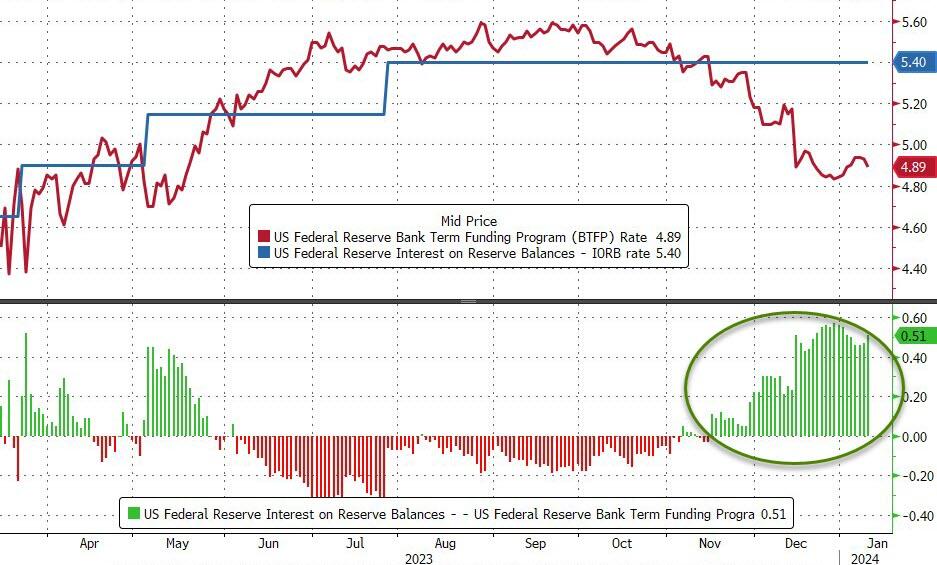
This time the rise in BTFP usage is good old-fashioned arbitrage. After the Fed’s pivot, term rates have come down relative to the policy rate. The cost to use the BTFP is 1y OIS + 10 bps, which is ~4.90%. Banks can post USTs at par as collateral, borrow at this rate, then deposit the funds back at the Fed at the IORB rate (interest on reserve balances), i.e. 5.40%, for a juicy risk-free profit.
This is not good optics, so it is unlikely the program will be renewed when it is due to expire on March 11. Michael Barr, the Fed’s vice chair for supervision, hinted as much on Tuesday when he emphasized the BTFP is an “emergency program.”
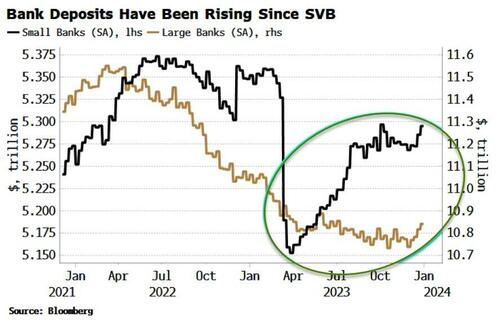
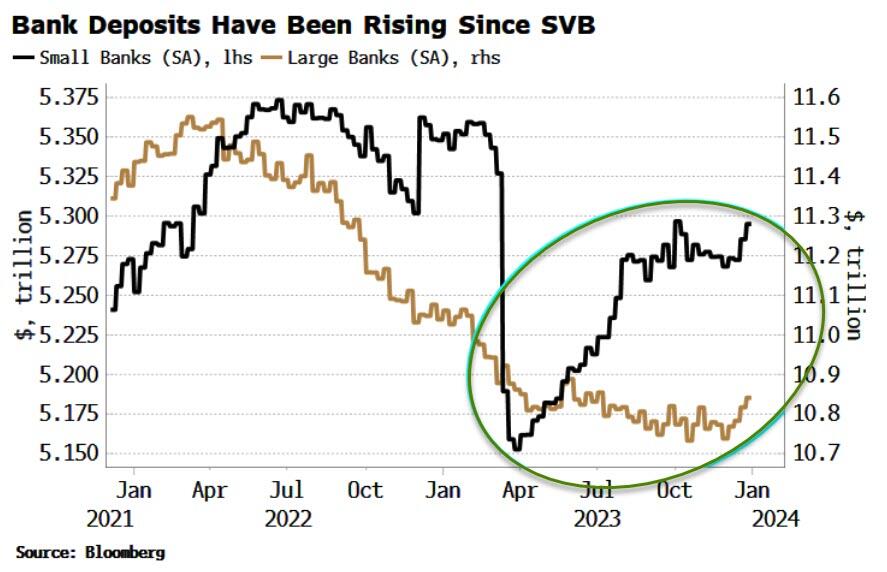
And it seems clear the emergency is over. Deposits of small banks (for whom the program was aimed at) have been rising since their drop after SVB’s collapse (both on a seasonally and non-seasonally adjusted basis). That, along with the quiescent fed funds market, suggests banks are not facing stress. Furthermore, the Fed’s pivot has also increased collateral values, making banks’ hold-to-maturity portfolios less underwater.
The BTFP’s expiry would mean another ongoing drain on reserves as the loans expire over the year.
With the Fed now seemingly focused on liquidity in this new paradigm, this adds to reasons why the central bank may cut earlier in the year.
The market is currently pricing 17 bps of cuts for the March 20 meeting, so that’s not an attractive risk-reward, but at under ~7 bps or so that proposition changes – more so if the BTFP is no more.
Meanwhile, the futures market is forecasting rate cuts of over 200 basis points!
The Federal Reserve is a private enterprise that works with The Federal government like in the film “Prometheus” or “Chariots of the Clods.”
Unfortunately, that period of relative stability appears to be ending.
The pace of layoffs really seemed to pick up steam at the end of 2023, and the outlook for the coming year is not promising at all. In fact, a survey that was just conducted by Resume Builder discovered that a whopping 38 percent of U.S. companies anticipate that they will conduct layoffs in 2024…
38% of companies say they are likely to have layoffs in 2024
52% are likely to implement a hiring freeze in 2024
Half say anticipation of a recession is a reason for potential layoffs
4 in 10 say layoffs are due to replacing workers with artificial intelligence (AI)
3 in 10 companies reducing or eliminating holiday bonuses this year
If you currently have a job that you highly value, try to hold on to it as tightly as you can.
Because the employment market is starting to shift in a major way.
Nike has announced a $2 billion cutback over the next three years, with an uncertain number of job cuts included. Toy giant Hasbro will cut nearly 20% of its workforce in 2024, according to reports from the Wall Street Journal. Music service Spotify announced a third round of layoffs. A recent email from CEO Daniel Ek says the company plans to cut its workforce by nearly 20%. Roku is going to be limiting new hires, and laying off about 10% of its workforce, while Amazon layoffs are effecting its new gaming division (all 180 jobs there are being eliminated). Citi CEO Jane Fraser announced layoffs in September, and sources have told CNBC that the bank could let go of at least 10% of its workforce, across several business lines. Flexport Logistics plans to cut up to 30% of its employees, and financial services company Charles Schwab is cutting back by 5-6% of its workforce, according to reports from Business Insider.
Unfortunately, this is just the tip of the iceberg.
With the continued rise of online shopping, along with record inflation, it’s no wonder that retailers are suffering steep financial losses. Unfortunately, this means that companies all across the U.S. are downsizing brick-and-mortar storefronts to make ends meet. In 2023, we’ve seen closures from big-name retailers and local shops alike—and the shutdowns don’t appear to be easing up anytime soon.
More than 3,000 retail locations were shut down in 2023, but that is nothing compared to what is coming…
According to UBS equity analyst Michael Lasser, the U.S. remains over-retailed. Lasser estimated that the U.S. will shed almost 50,000 retail stores by 2028. He cites rising operating costs and a higher proportion of e-commerce sales, causing retailers to look closely at store locations and performance.
Can you imagine what our communities will look like if that projection is even close to accurate?
As economic conditions deteriorate, people are going to get more desperate and the conditions in our streets will become even more chaotic.
A mob of over 100 looters purposefully crashed a Kia into a small bakery in Compton, Calif., before they flooded in and ransacked the store during a night of rampage on the streets earlier this week.
The thieves had gathered in the area for an illegal street takeover around 3 a.m. Tuesday before making the mile-long trek to Ruben’s Bakery & Mexican Food.
When they got to the locked store, a white Kia backed into the front doors, clearing an entryway for the crowd of pillagers to get to their loot.
And so it goes. Lawlessness is bad for retail businesses. Not to mention the morale of US citizens.
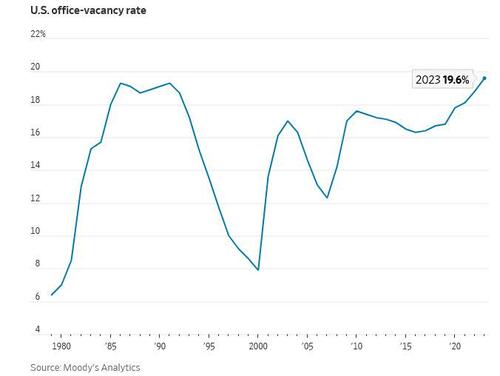
And then we have the office market. The office space vacancy rate in the US has reached its highest level since 1979. In the fourth quarter of 2023 19.6% of office space in major US cities was not leased according to data collected by Moody’s Analytics.
The increase in remote work since the COVID-19 pandemic has caused a large decline in demand for office space, despite increasing attempts to get Americans back in the office. What’s more, on the demand side the stock of office space in the US is the result of earlier booms in commercial real estate construction. The last boom took place between 2012 and 2017, when demand for commercial real estate loans strengthened. On the supply side, lending standards loosened between 2012 and 2015. This era coincides with a strong rise in the commercial real estate price index, which may have motivated banks to expand lending. Loan standards tightened during the pandemic, then loosened again when the economy rebounded, but have tightened since 2021.
Since the Great Recession, commercial real estate prices have more than doubled in nominal terms, but have moved sideways since 2021. This suggests that prices have reached a plateau. However, in recent years inflation has obscured the movement of commercial real estate prices in real terms, which shows a peak in 2021, but since then there has been a decline, almost to the level during the COVID-19 pandemic. In other words, commercial real estate prices are already failing to keep up with inflation. Is this an indication that the commercial real estate bubble is already deflating? With nominal commercial real estate prices remaining elevated, most of the nominal price correction is likely still to come. Since small banks are heavily exposed to commercial real estate, the enduring problems at small banks and the fragility of commercial real estate could provide a dangerous mix that could explode during a recession. For more details, we refer to The commercial real estate-small bank nexus.
I noticed that The Administration has handed propaganda duties off to John Kirby and relegated KJP to relief pitching away from Peter Doocey!
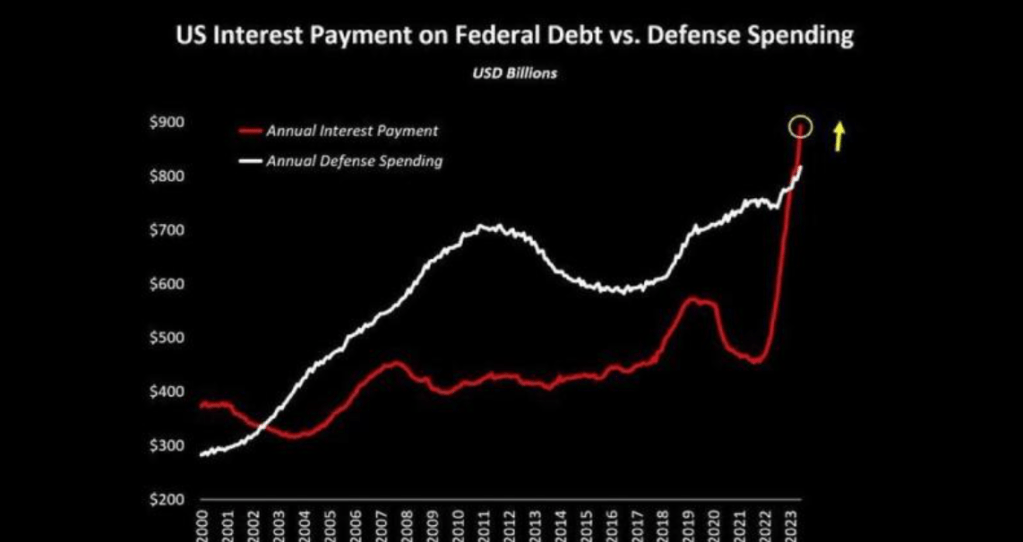
Joe Biden can be called “Sloppy Joe” because of the economic havoc he has sprung on an unsuspecting middle class. The following seven charts are what keeps me up at night (unlike what keeps multimillionaire Michelle Obama up at nights).
First, US interest payment on Federal debt is rising faster than our bloated military budget. Thanks mostly to The Fed raising rates to fight inflation under Biden.
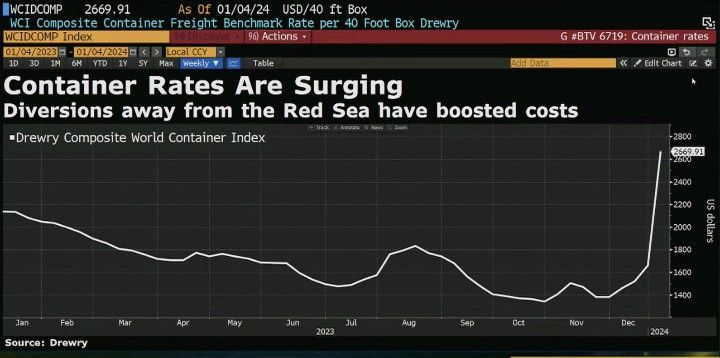
Second, contrainer shipping rates are soaring thanks to Iran’s interference in the Middle East and Biden’s failed diplomacy with Iran.
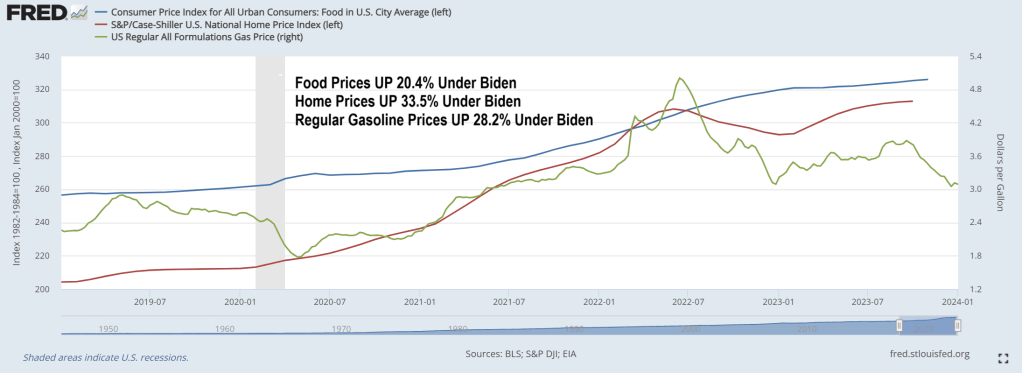
Third, food prices are over 20% more expensive under Biden while gasoline prices are over 28% more expensive under Biden. Housing is also more expensive under “Sloppy Joe” as in 33.5% more expensive.
Fourth, Bidenomics is about adding more non-productive government jobs.
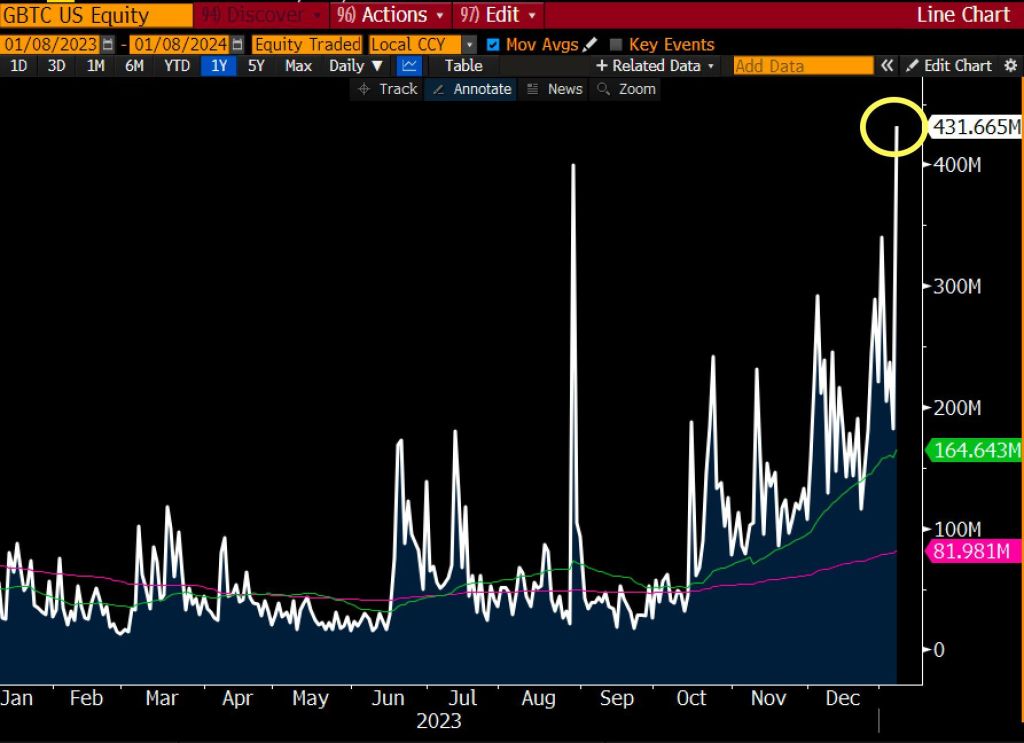
Sixth, Grayscale Bitcoin Trust $GBTC traded close to half a billion on Monday. Which shows the lack of confidence in Biden’s handling of the economy.
Seventh, purchasing power of the US Dollar is down 15% under Sloppy Joe.
While some may view Biden’s policies are planned destruction of the US economy, it could simply be that Biden (who is one of the stupidest people in Washington DC) simply is grossly incompetent and … sloppy.


You must be logged in to post a comment.