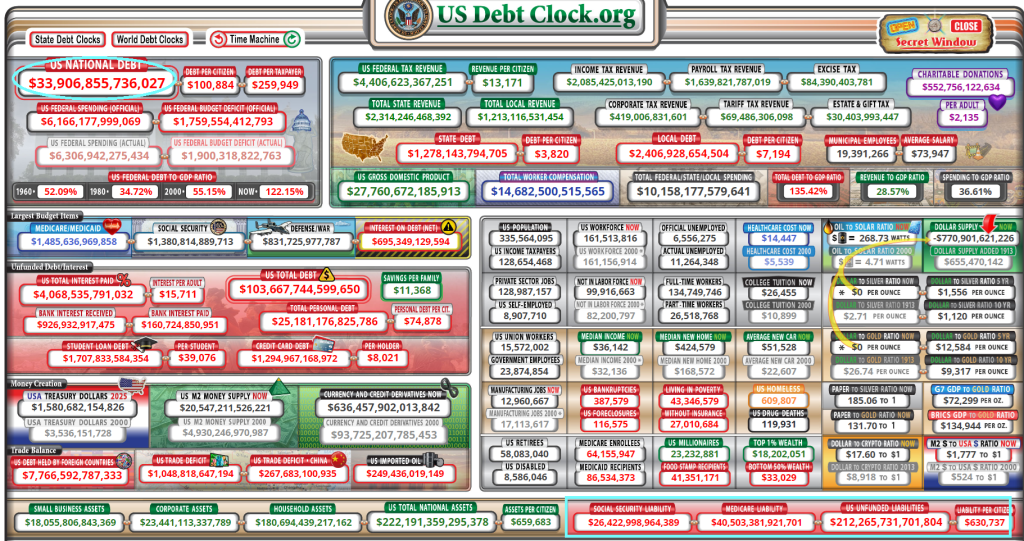
Both the US Federal government and California’s government are facing a fiscal inferno. Thanks to a softening economy and inane fiscal policies.
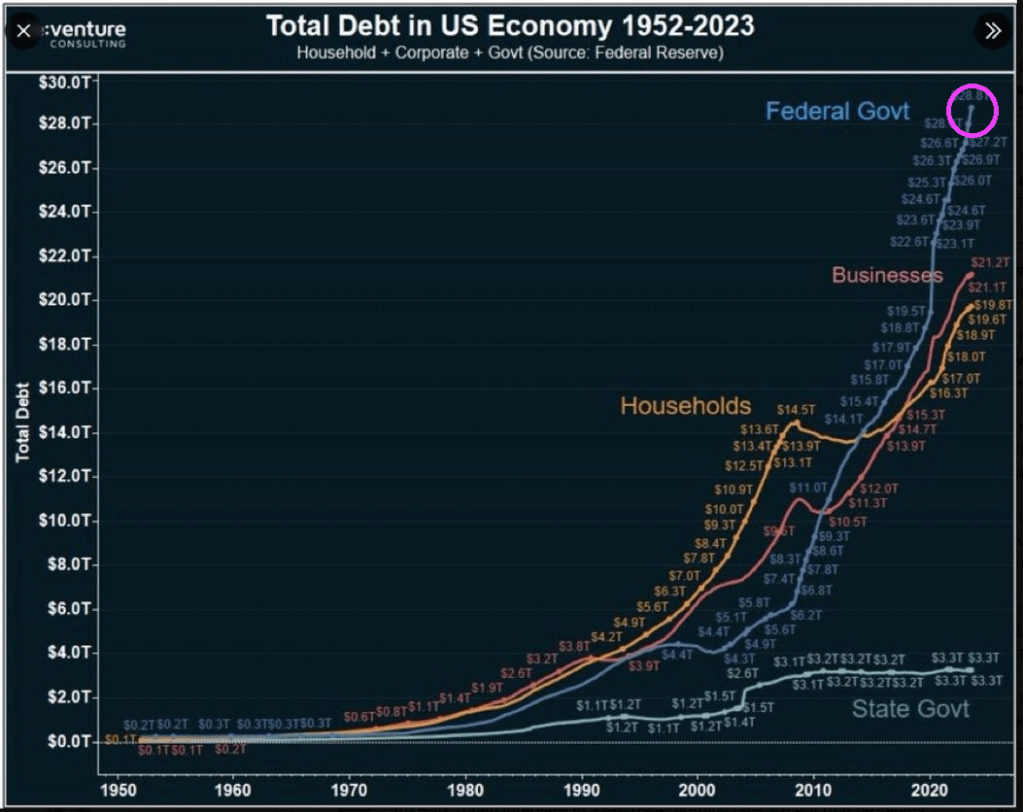
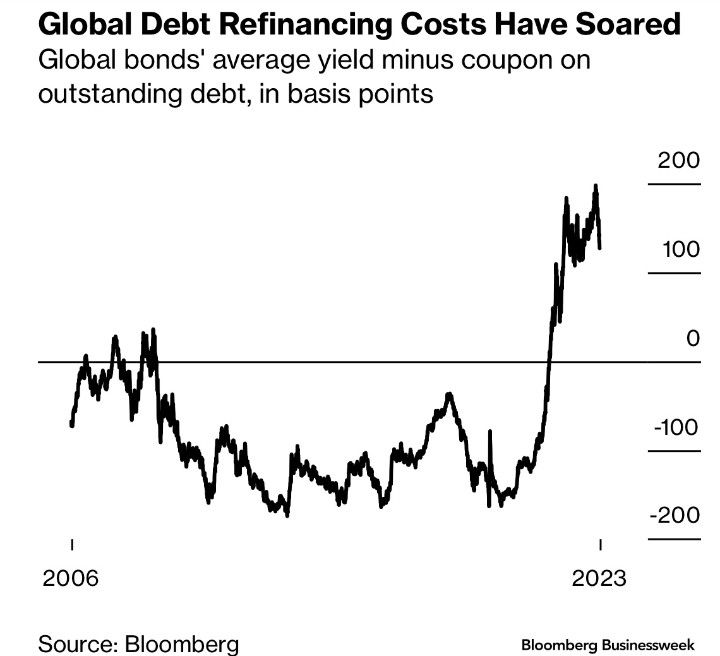
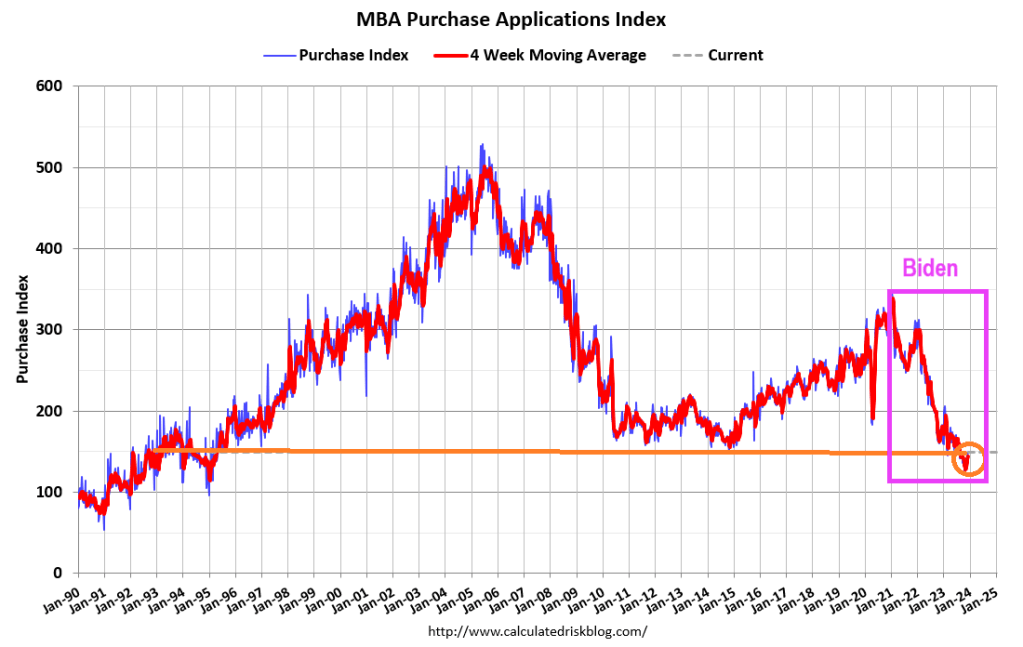
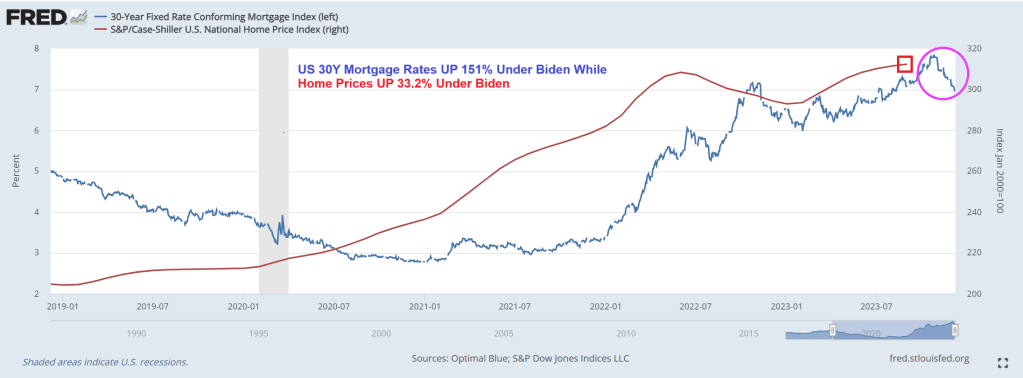
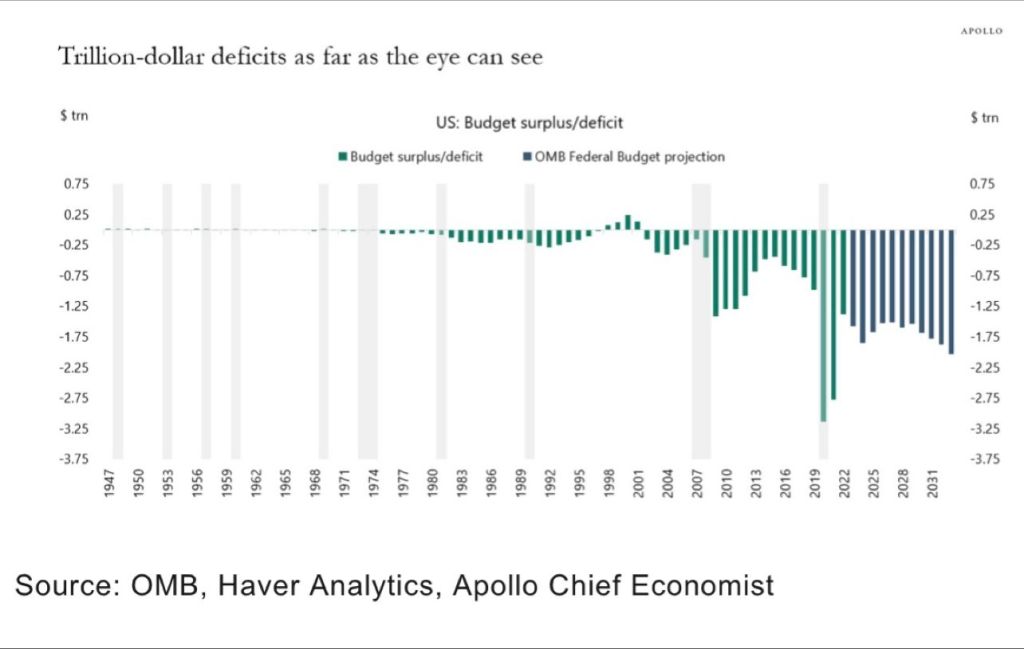
At the macro level, we see that The Federal government has gone wild spending money and borrowing it. Much more than businesses and households. Biden’s wild spending reduces the degrees of freedom that Treasury has if the US slips into another recession or depression.
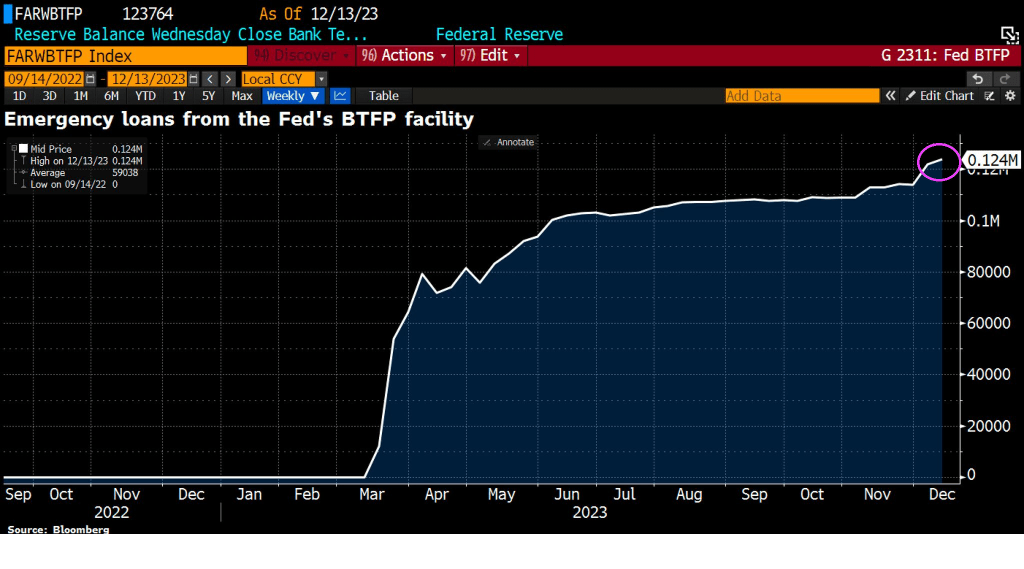
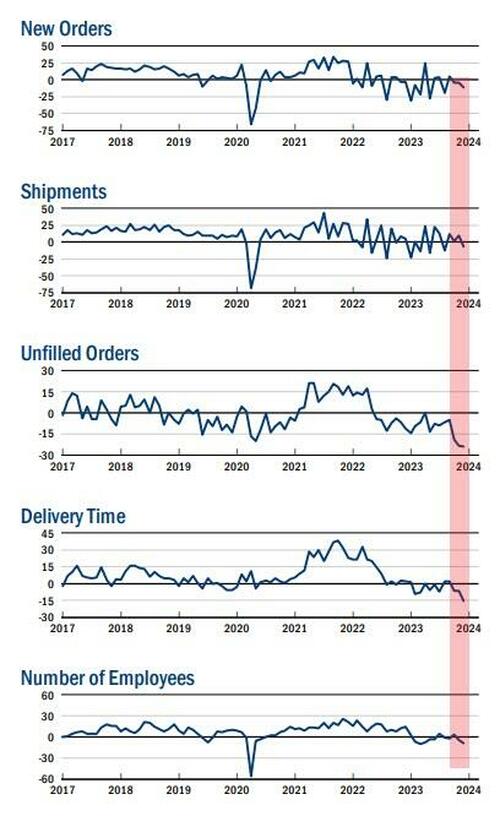
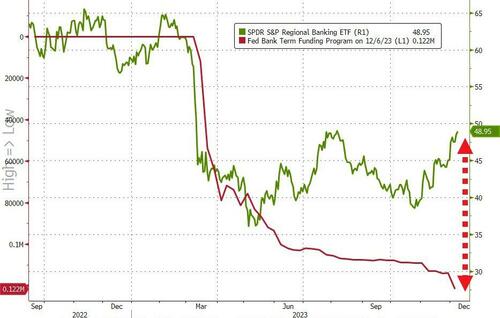
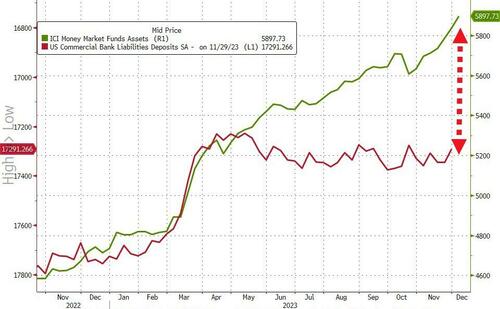
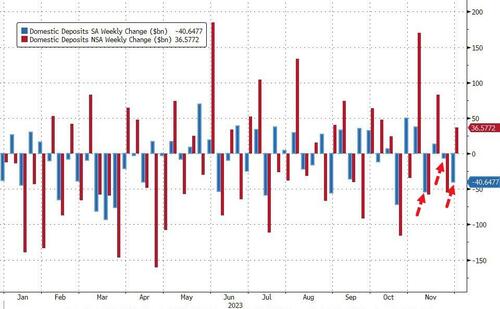
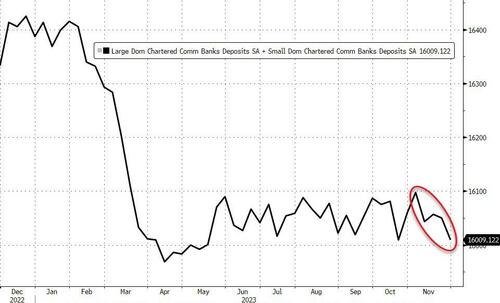
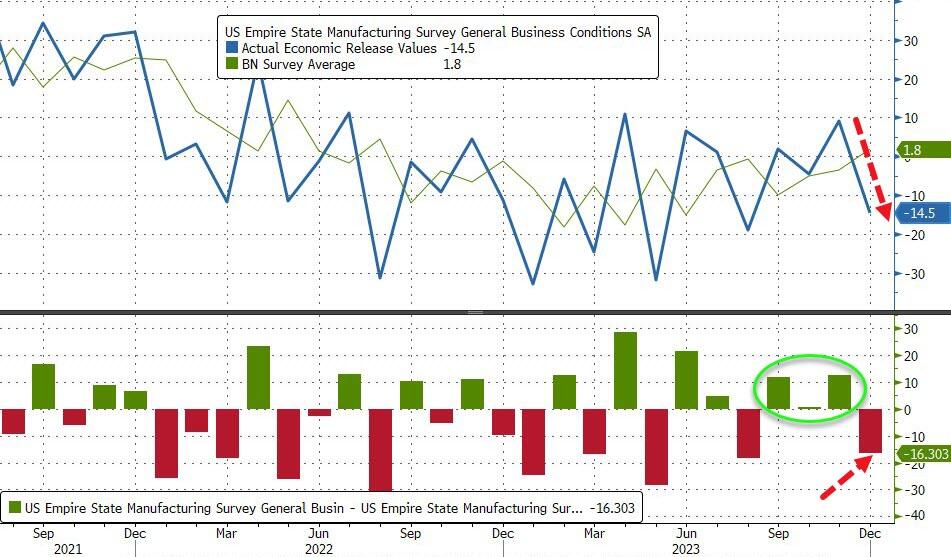
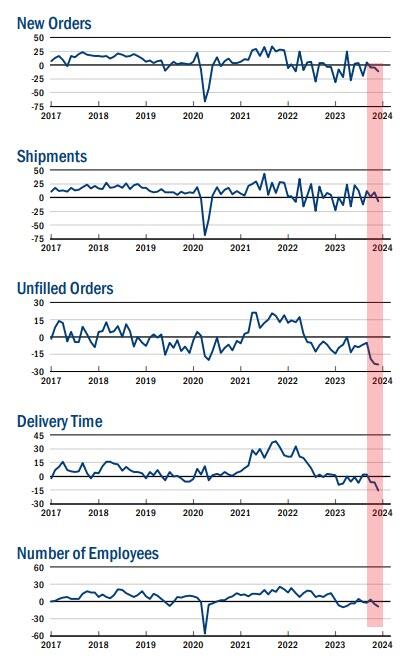
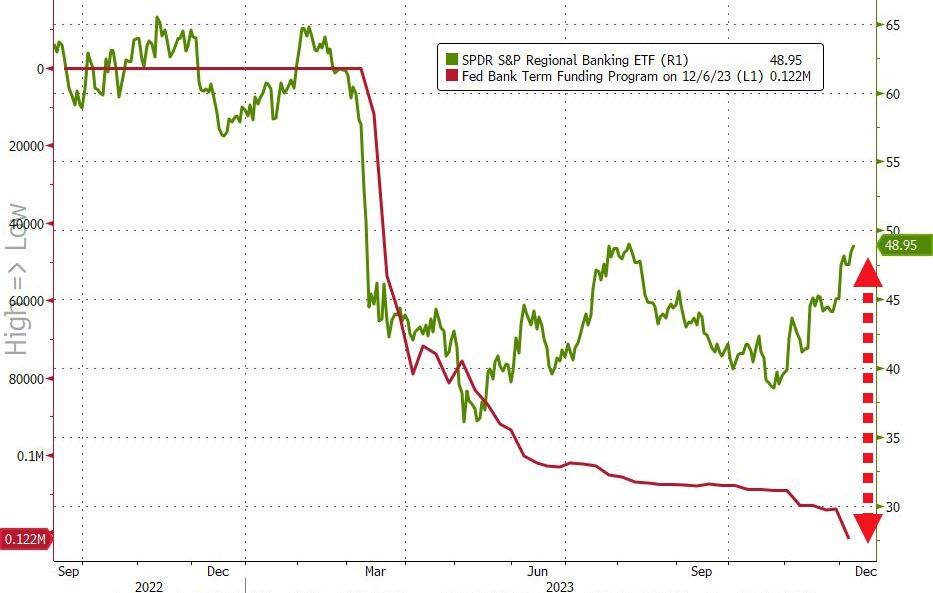
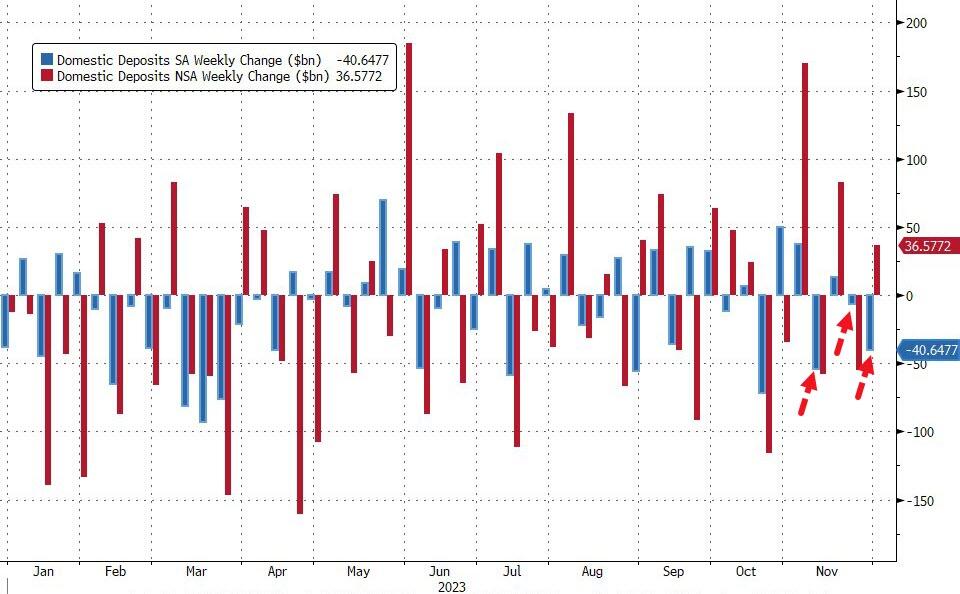
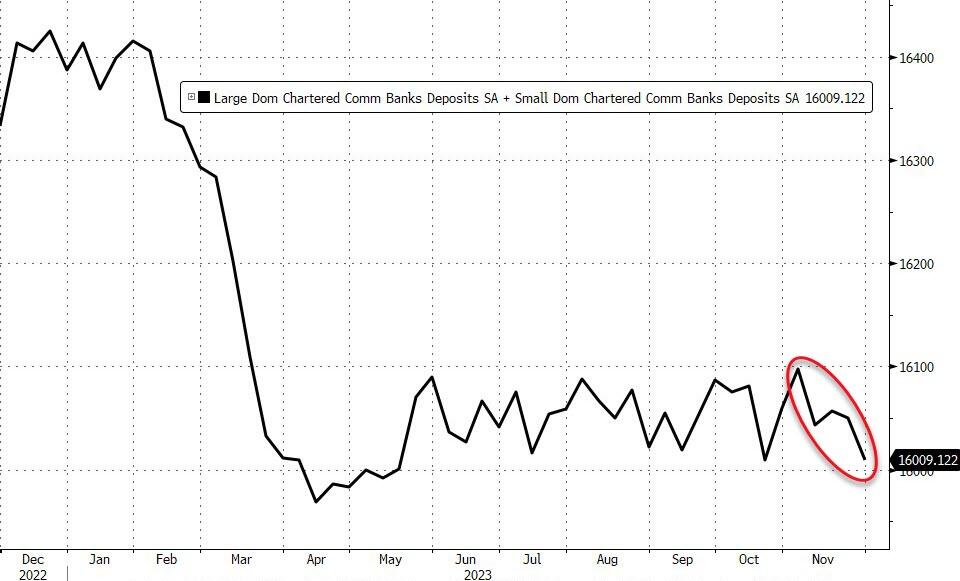
First, let’s begin with banks to illustrate the worsening condition of the economy. Emergency loans from The Fed’s Bank Term Funding Program (BTFP) is on the rise, signaling perceived trouble in the economy.
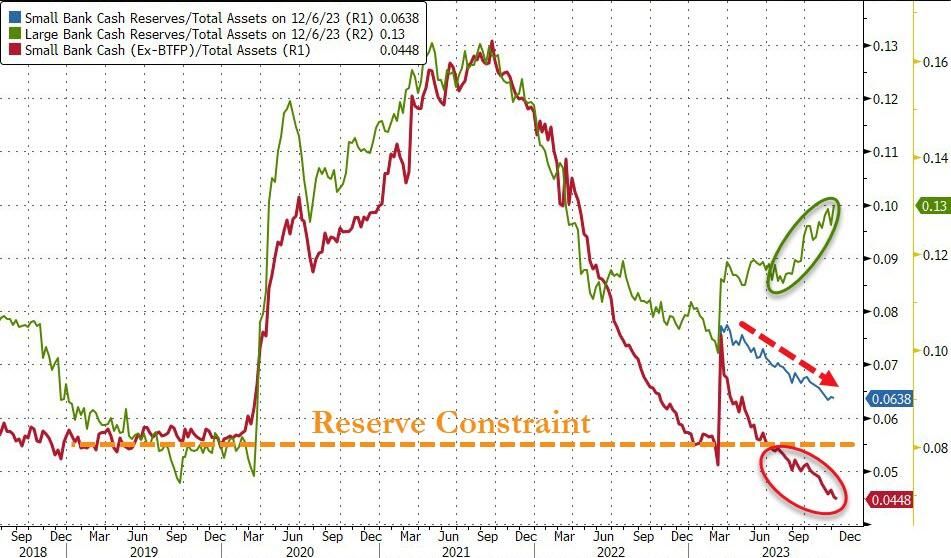
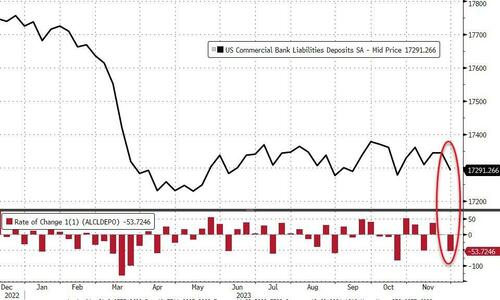
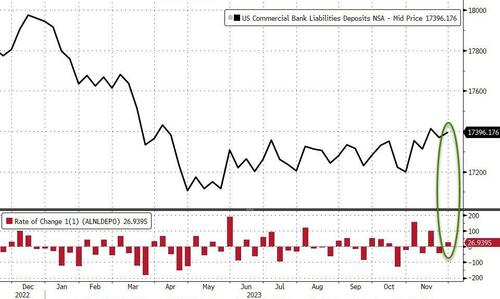
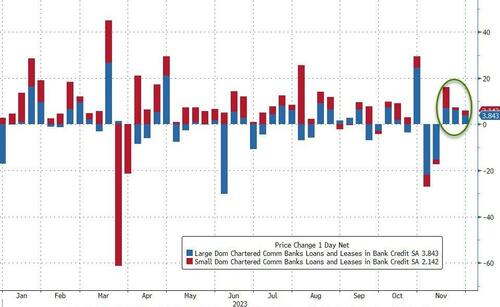
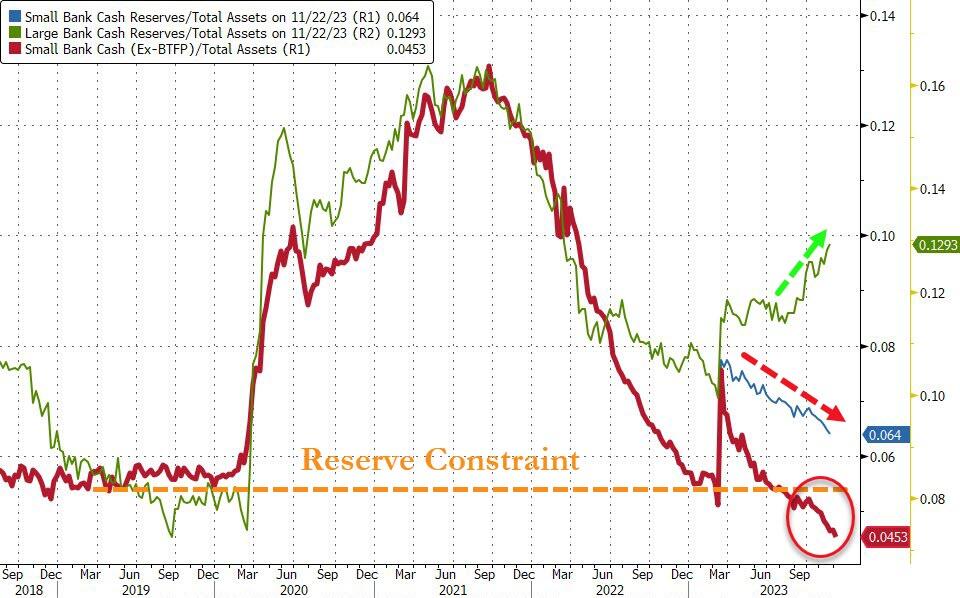
Small banks are suffering more than big banks.
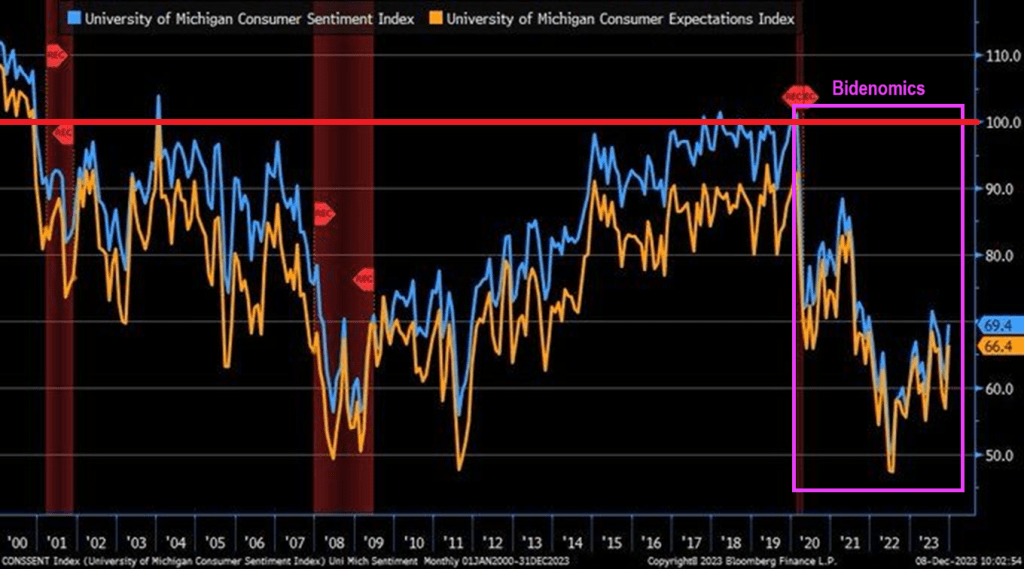
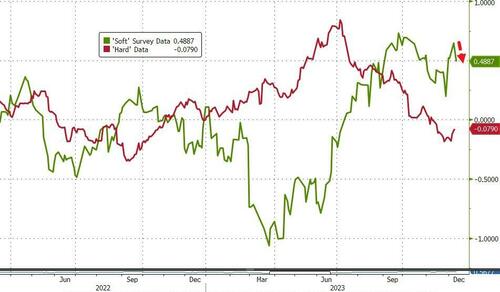
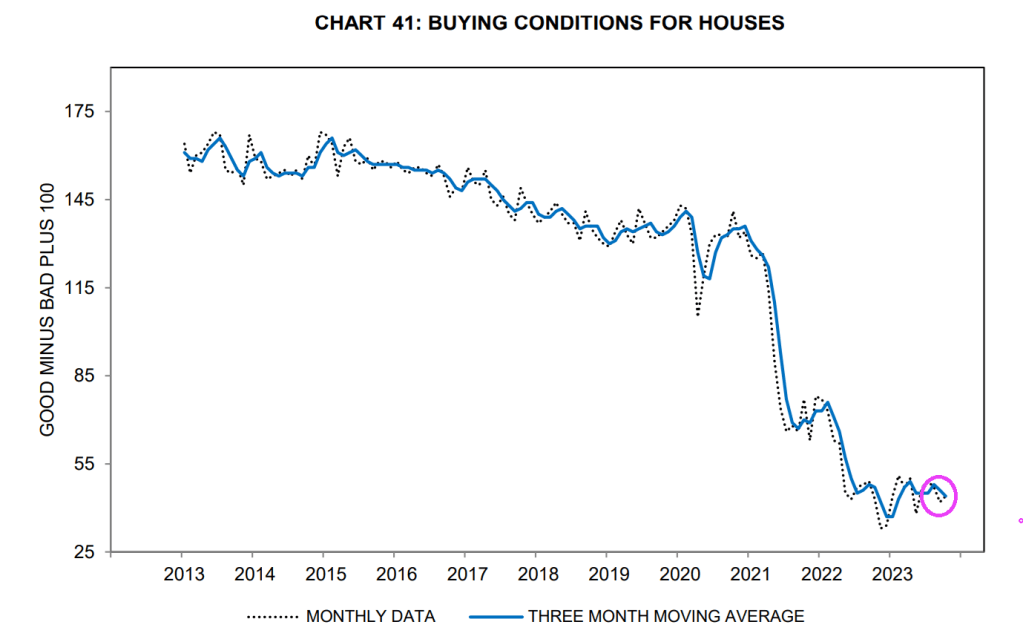
Consumer sentiment is below 70 (100 baseline) under Biden and Bidenomics.
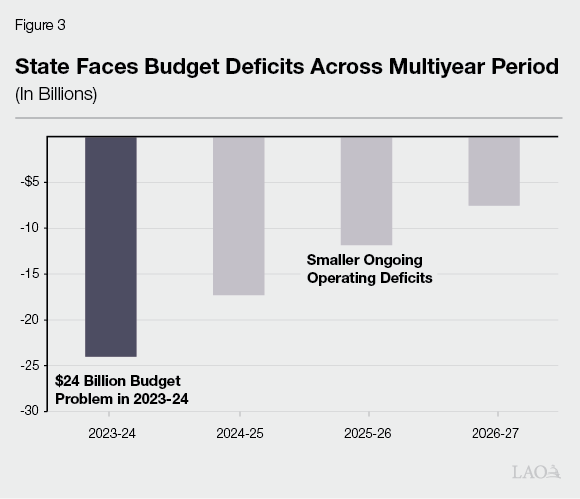
And then we have Gavin “Gruesome” Newsom and California. California is now facing a $68 billion deficit. It has also defaulted on a $20 billion loan from the federal government. The situation is so dire the state is telling agencies not to replace broken printers or re-stock office supplies. Workers are being stripped of benefits and could face furloughs. This is all happening as the state has spent billions funding High-Speed Rail and expanding Medi-Cal to all undocumented immigrants, while losing billions in tax revenue from people leaving the state.
$68 billion is over twice this forecast deficit of $24 billion.
But never fear. “Billions Biden” will make sure California is okay, ar least until the 2024 Presidential election.


You must be logged in to post a comment.