The song “Running on Empty” by Jackson Browne comes to mind when analyzing the state of American banking, especially regional banks.
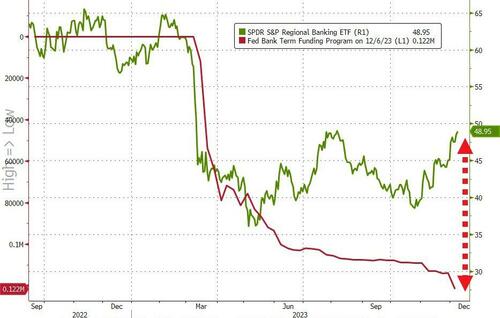
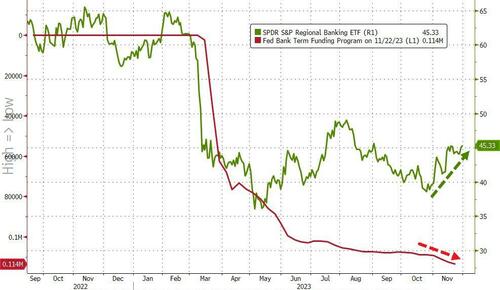
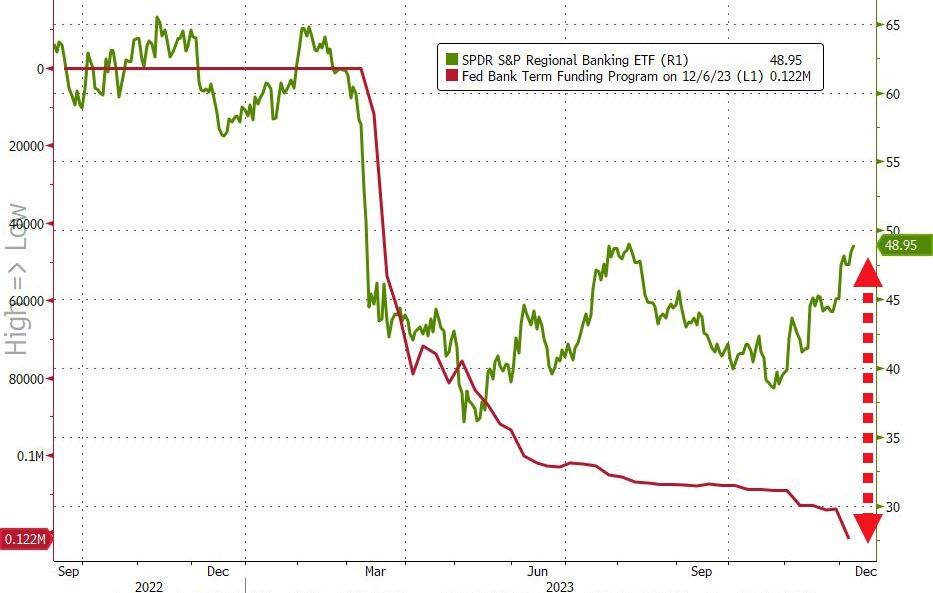
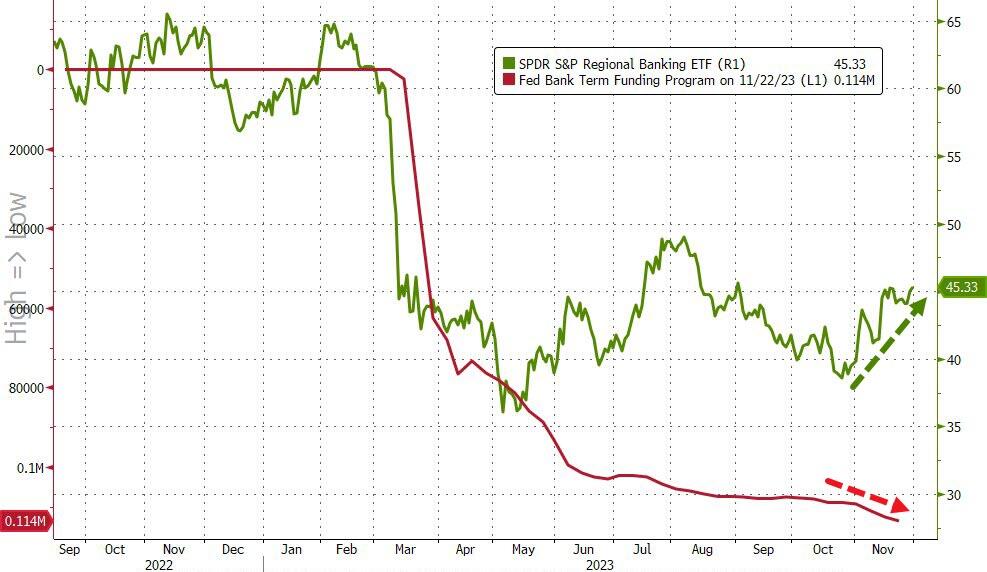
Yesterday we found out that inflows to money-market funds continue to be huge ($290BN in six weeks), and more importantly, regional banks’ usage of The Fed’s BTFP bailout facility surged to a new record high (even as regional banks surged…
Source: Bloomberg
And so, with that shitshow in mind, we await the glorious manipulation of The Fed’s bank deposits data to reinforce that equity confidence.
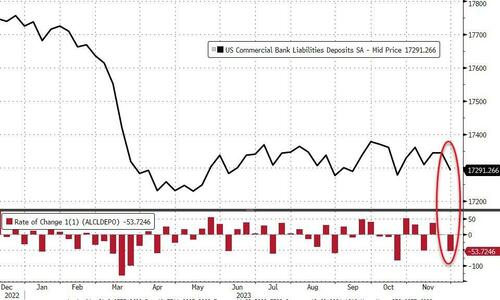
On a seasonally-adjusted basis, banks saw a $53.7BN deposit outflow…
Source: Bloomberg
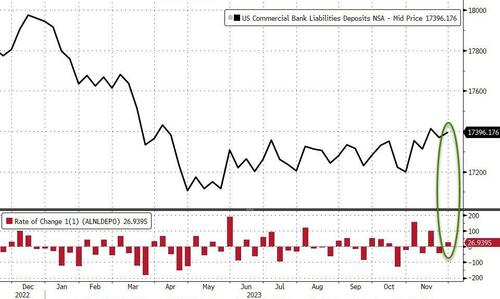
However, on a non-seasonally-adjusted basis, deposits rose by $27BN…
Source: Bloomberg
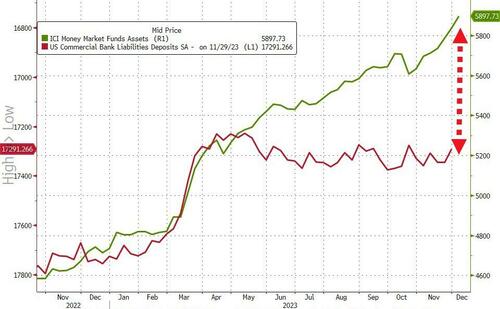
And even with the outflows (SA), the divergence between soaring money-market funds and bank deposits continues to widen…
Source: Bloomberg
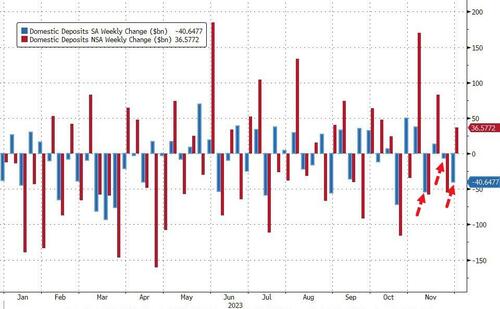
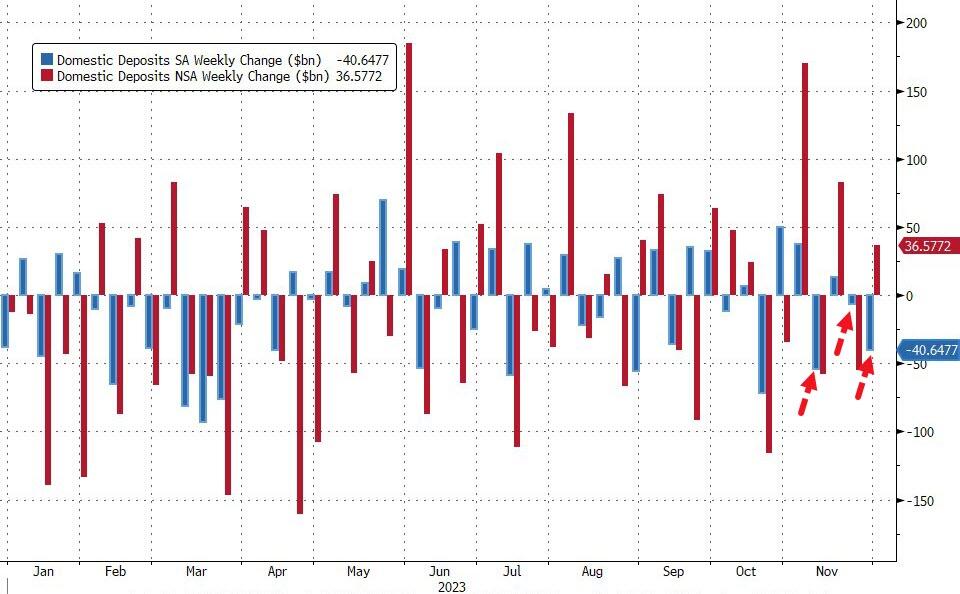
Excluding foreign bank deposits, domestic banks saw the third week of the last four of deposit outflows (-$40.6BN SA) with Large banks -$35BN (SA) and Small banks losing $5.7BN (SA). On an NSA basis, domestic banks saw inflows of $36.5BN last week with Large banks adding $32BN and Small banks adding $4BN…
Source: Bloomberg
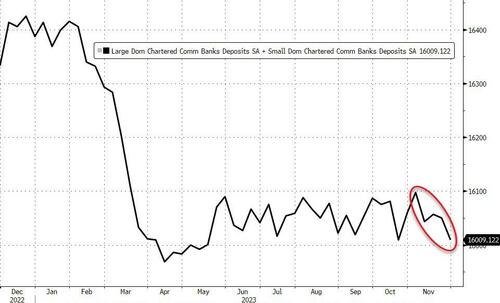
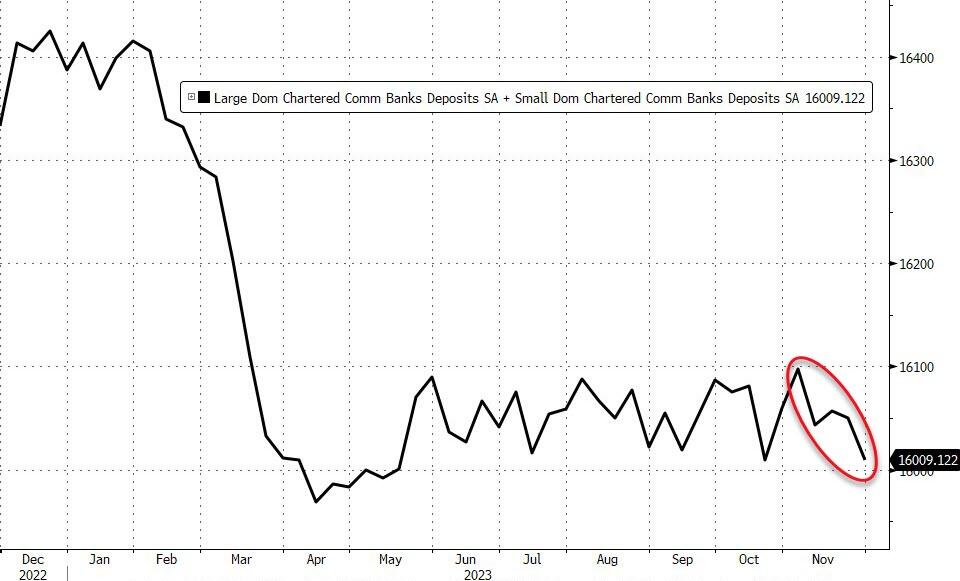
That adds up to $88BN (SA) of deposit outflows in the last four weeks (bank to its lowest total since May…
Source: Bloomberg
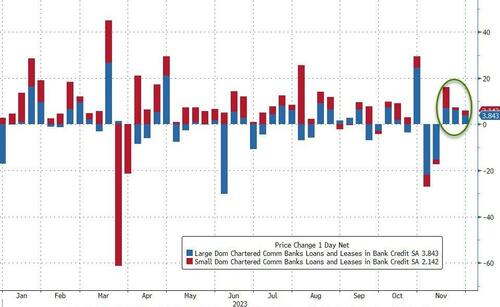
And on the other side of the ledger, despite deposits declining SA, loan volumes increased (SA) for the third week in a row with Small banks adding $2.1BN and Large banks adding $3.8BN…
Source: Bloomberg
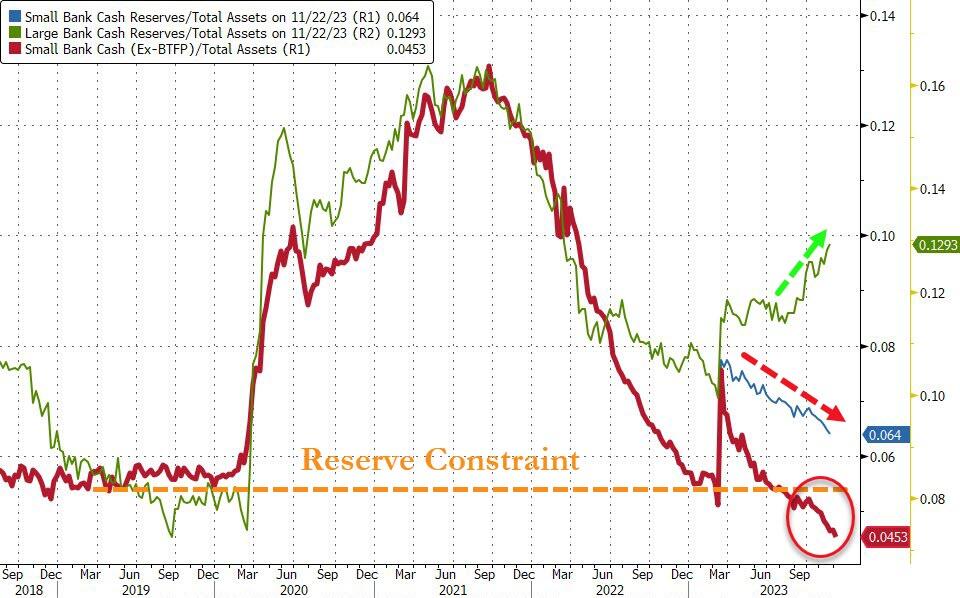
Finally, the key warning sign continues to trend ominously lower (Small Banks’ reserve constraint), supported above the critical level by The Fed’s emergency funds (for now)…
Source: Bloomberg
As the red line shows, without The Fed’s help, the crisis is back (and large bank cash needs a home – green line – like picking up a small bank from the FDIC).
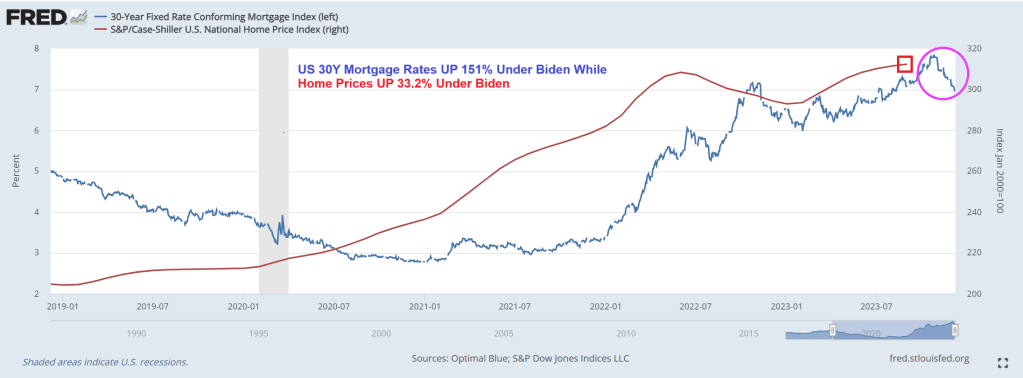
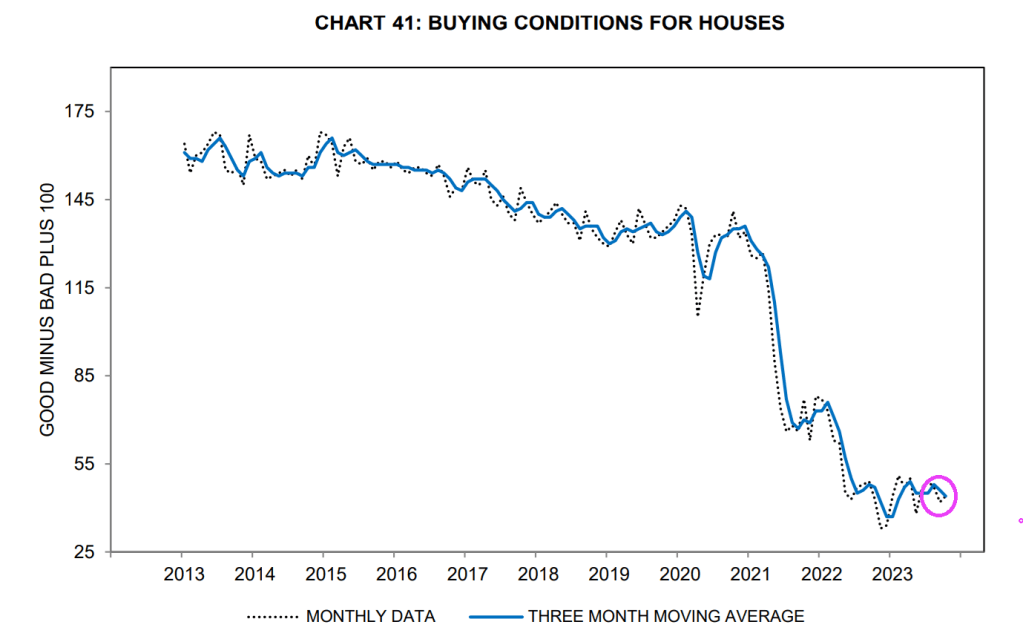
Mortgage rates, despite coming down recently, are still up 151% under Biden. And home prices are up 33.2%. So much for affordable housing for those renting.
So, “Running on Empty” applies to middle class and their ability to afford housing.
Why are buying conditions for houses so low? Well, mortgage rates, despite coming down recently, are still up 151% under Clueless Joe. And home prices are up 33.2% under Biden. So much for affordable housing for those renting.
Like the great Shoeles Joe Jackson on ChiSox and Cleveland Indian fame, Clueless Joe Biden cheated too. Except that Shoeless Joe was accused of accepting $5,000 to throw the World Series in 1919. Clueless Joe Biden and family are accused of accepting over $24 million from China, Ukraine, etc.
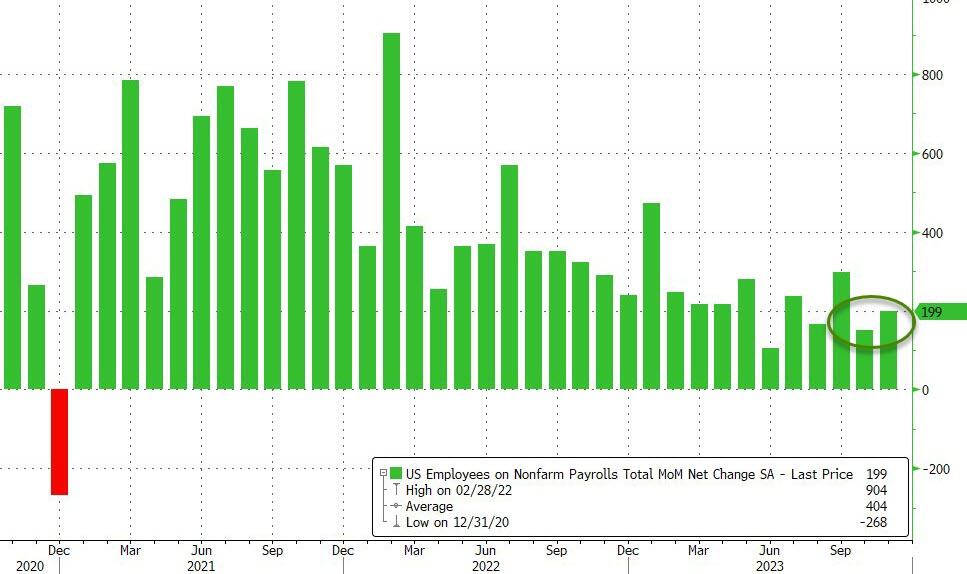
Several talking heads are salivating about the strong or solid jobs report in October. As if The Federal Reserve can’t read the jobs report. I call the report “Government gone wild!” since 51k government jobs were added in October.
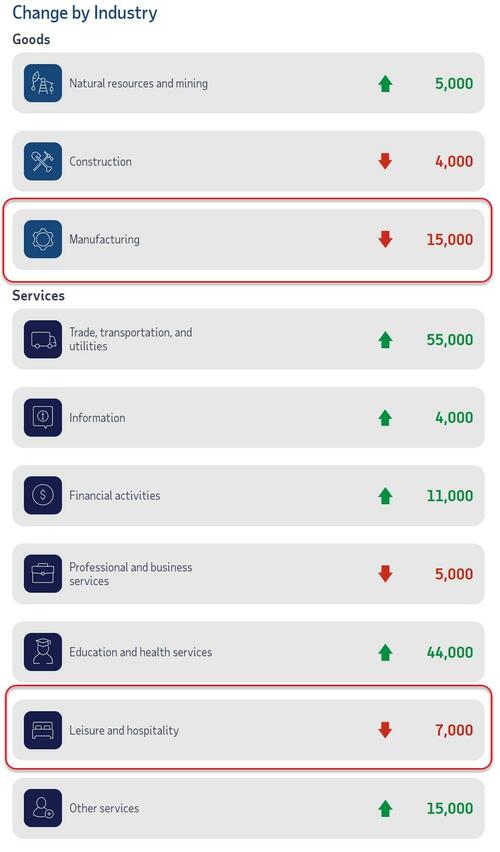
Job gains occurred in health care, government, and social assistance. Employment declined in manufacturing due to strike actvity.
Total nonfarm payroll employment increased by 150,000 in October, below the average monthly gain of 258,000 over the prior 12 months. In October, job gains occurred in health care, government, and social assistance. Employment in manufacturing declined due to strike activity. (See table B-1.) Health care added 58,000 jobs in October, in line with the average monthly gain of 53,000 over the prior 12 months. Over the month, employment continued to trend up in ambulatory health care services (+32,000), hospitals (+18,000), and nursing and residential care facilities (+8,000). Employment in government increased by 51,000 in October and has returned to its pre-pandemic February 2020 level. Monthly job growth in government had averaged 50,000 in the prior 12 months. In October, employment continued to trend up in local government (+38,000). Social assistance added 19,000 jobs in October, compared with the average monthly gain of 23,000 over the prior 12 months. Over the month, employment continued to trend up in individual and family services (+14,000). In October, construction employment continued to trend up (+23,000), about in line with the average monthly gain of 18,000 over the prior 12 months. Employment continued to trend up over the month in specialty trade contractors (+14,000) and construction of buildings (+6,000). Employment in manufacturing decreased by 35,000 in October, reflecting a decline of 33,000 in motor vehicles and parts that was largely due to strike activity. In October, employment in leisure and hospitality changed little (+19,000). The industry had added an average of 52,000 jobs per month over the prior 12 months. Employment in professional and business services was little changed in October (+15,000) and has shown little net change since May.
Speaking of Govzilla, my favorite quote showing the stupidity of BIG government is … Biden’s climate envoy John Kerry. “We’ve got to cut down on farming due to ‘Climate Change’…or people are going to starve…”
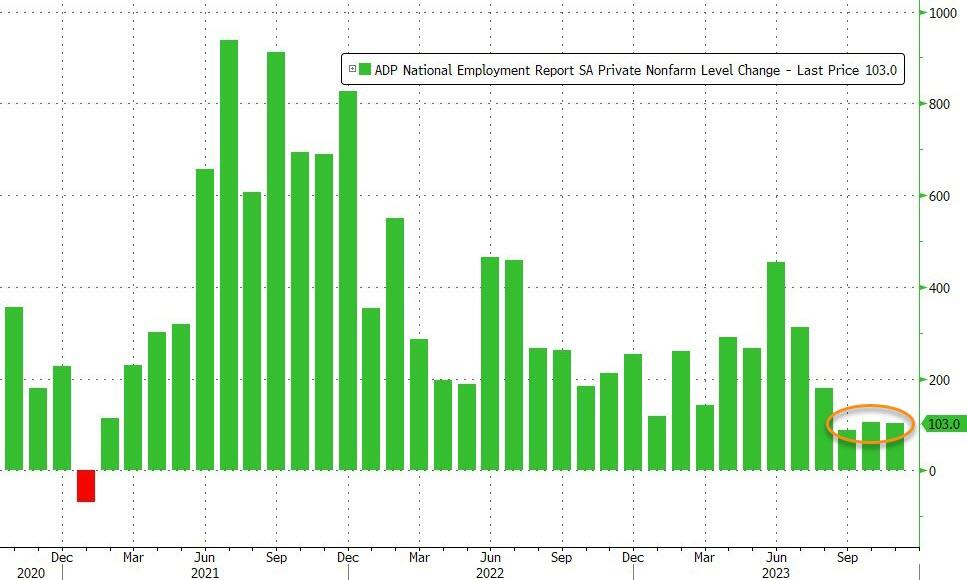
After ADP has printed lower than BLS for the last two months…
Source: Bloomberg
…expectations were for a small tick higher in November (from 113k to +130k), despite the ugly JOLTS print. However, ADP reported just 103k jobs added (and October revised down to 106k)…
Source: Bloomberg
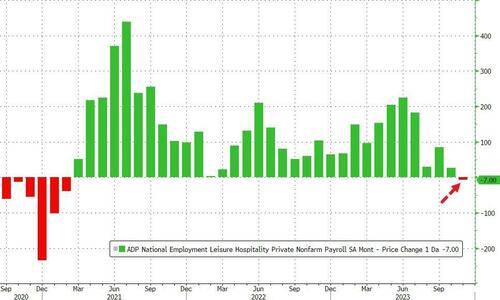
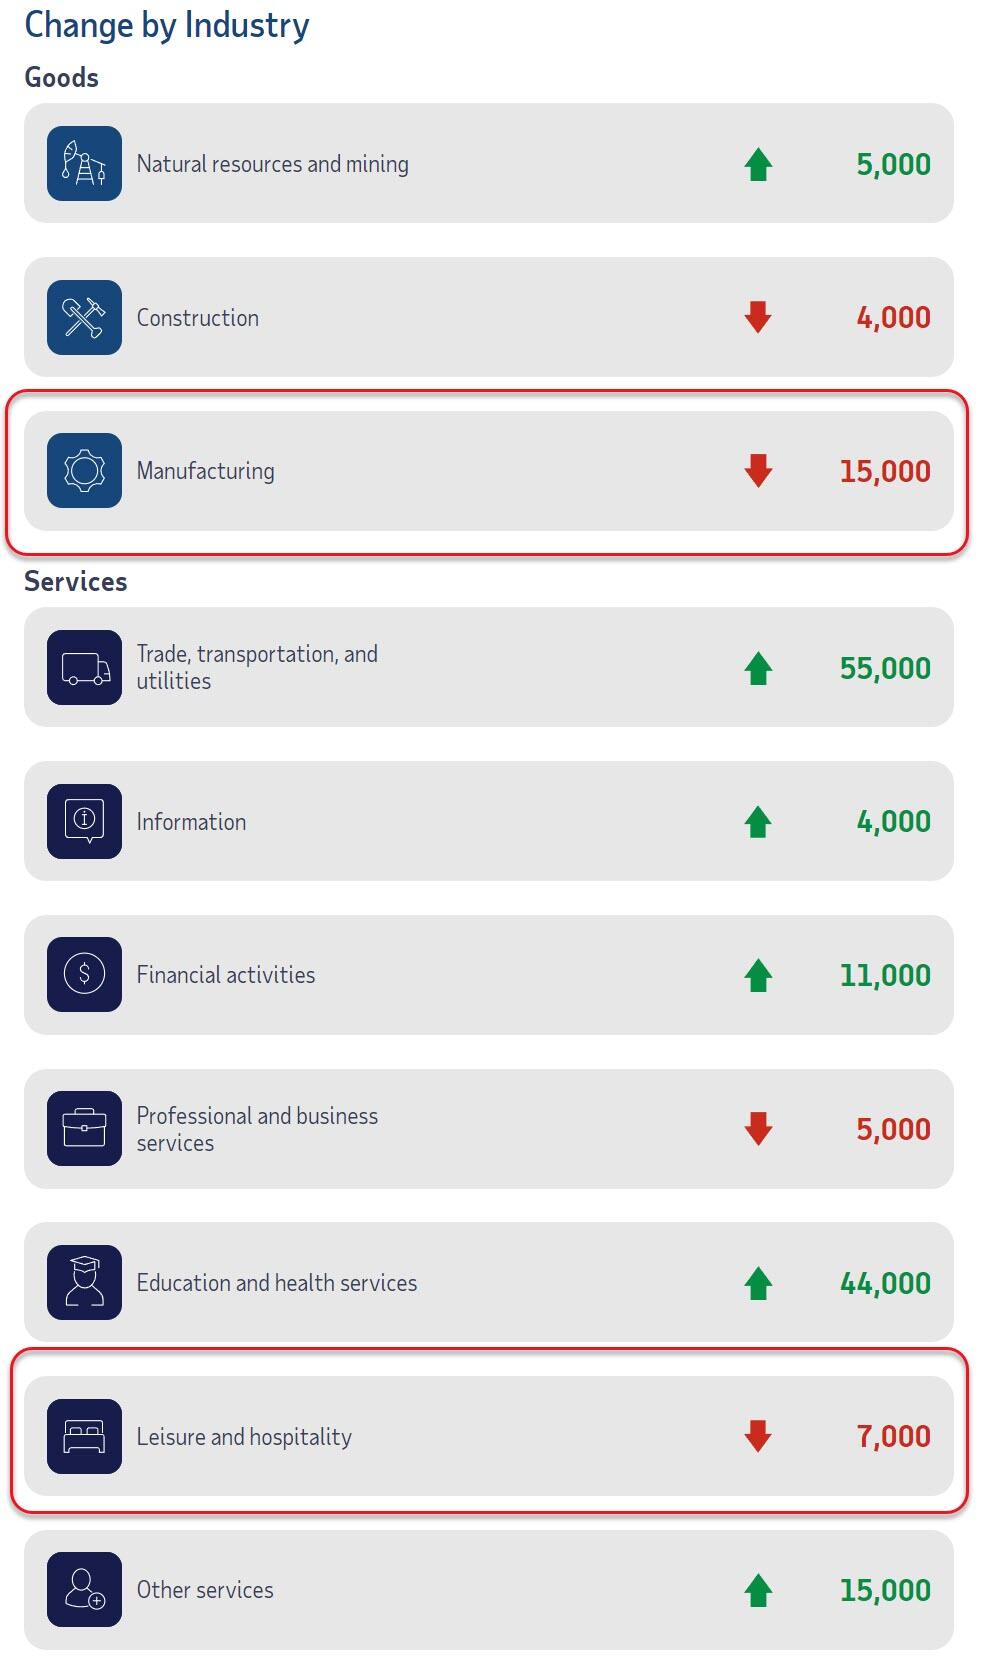
Manufacturing saw the biggest job losses but Leisure and Hospitality lost jobs for the first time since Feb 2021…
ADP’s Chief Economist Nela Richardson notes that:
“Restaurants and hotels were the biggest job creators during the post-pandemic recovery. But that boost is behind us, and the return to trend in leisure and hospitality suggests the economy as a whole will see more moderate hiring and wage growth in 2024.”
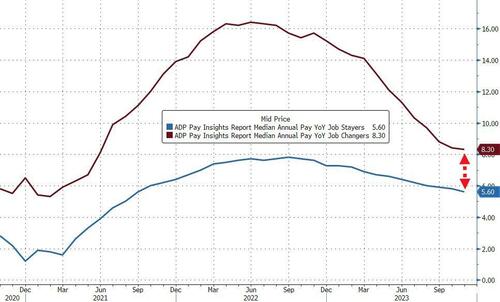
Bidenomics…
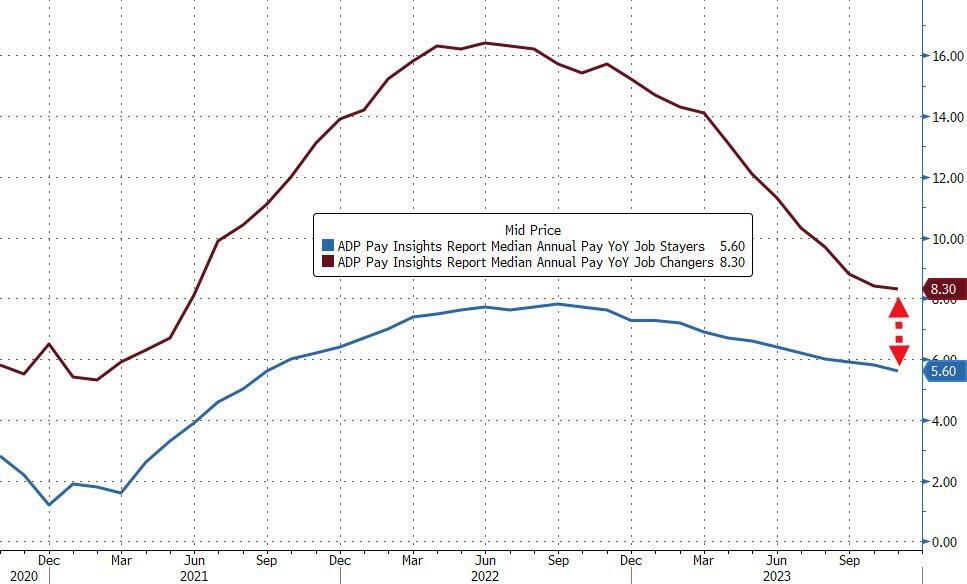
Job-stayers saw a 5.6 percent pay increase in November, the slowest pace of gains since September 2021. Job-changers, too, saw slowing pay growth, posting pay gains of 8.3 percent, the smallest year-over-year increase since June 2021. The premium for switching jobs is at its smallest in three years of data.
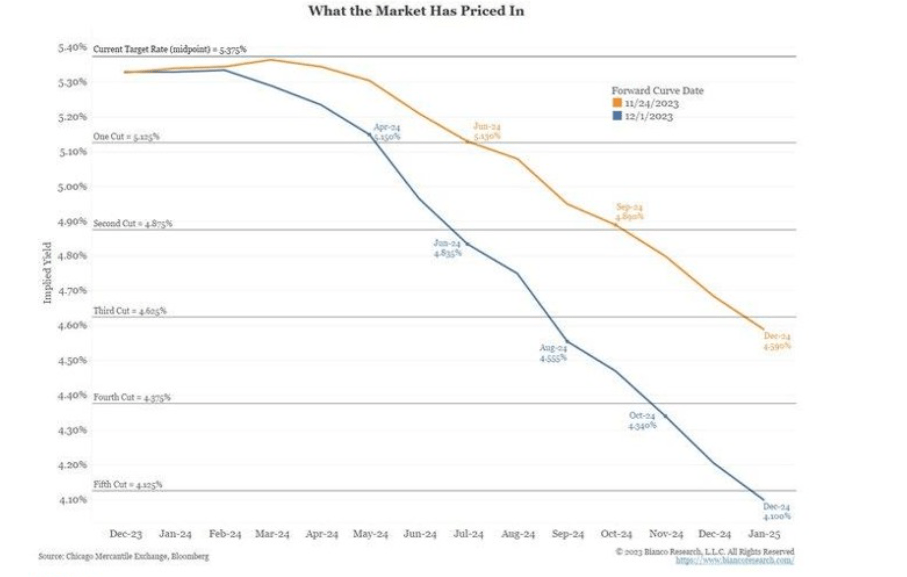
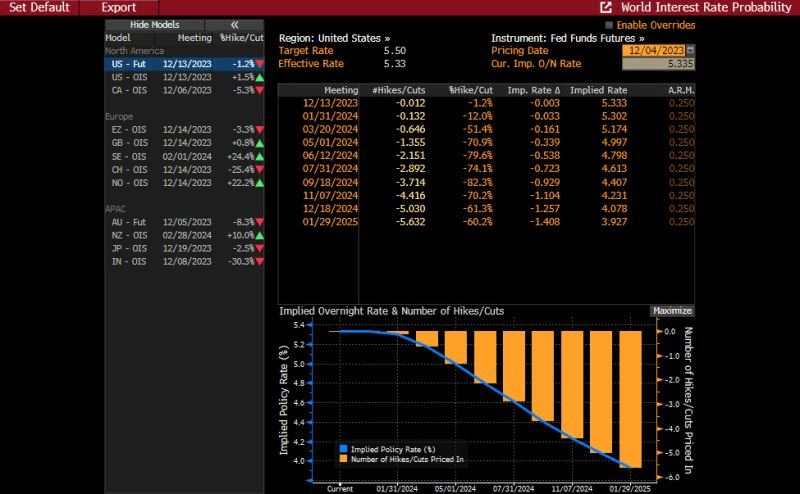
Is this the recessionary signals the STIRs market is banking on for 125bps of rate-cuts next year? Because stocks sure aren’t thinking recession.
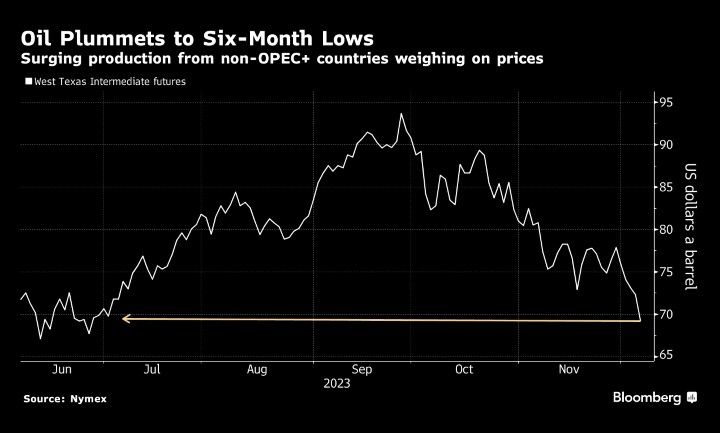
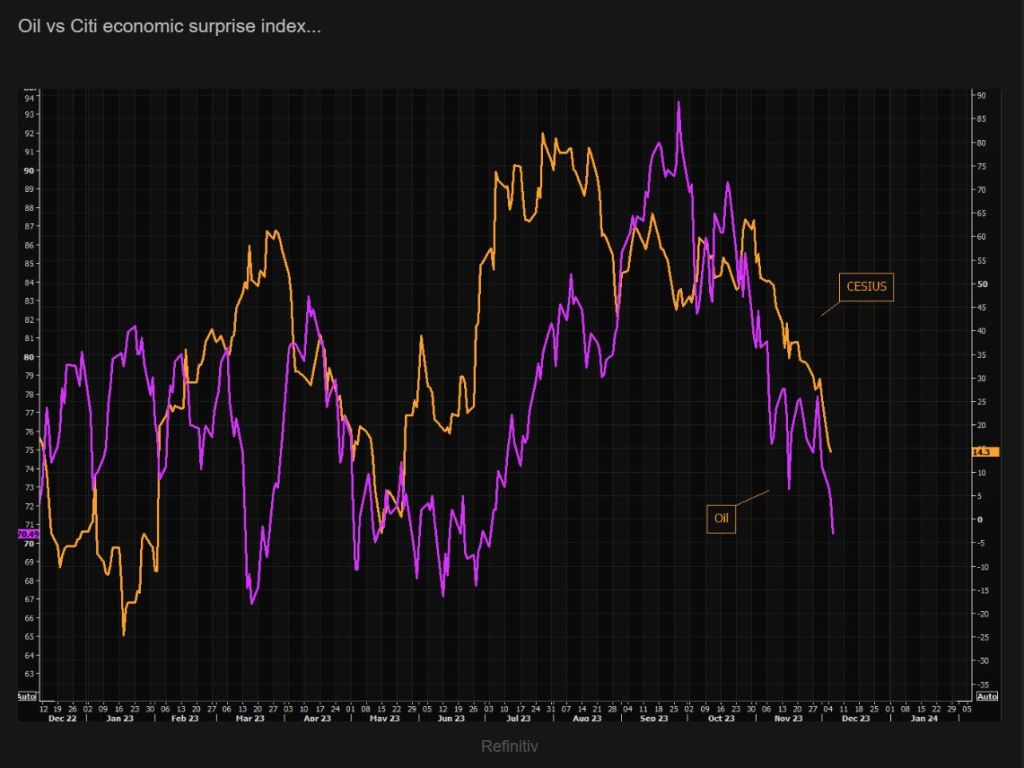
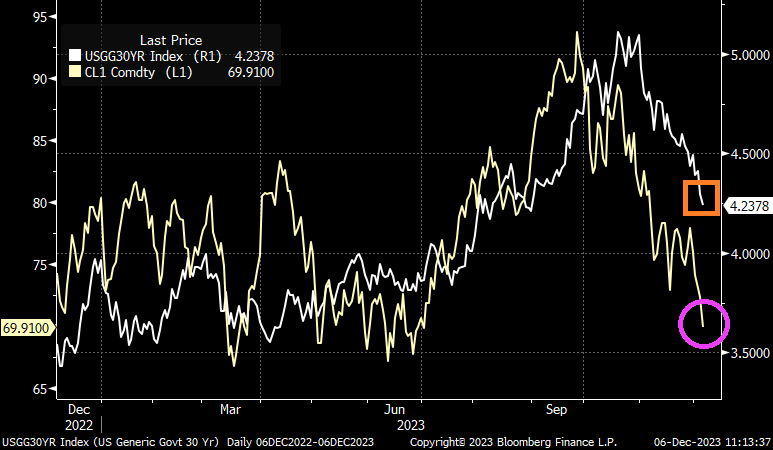
And as US Treasury 30Y yield drop, so do crude oil prices.
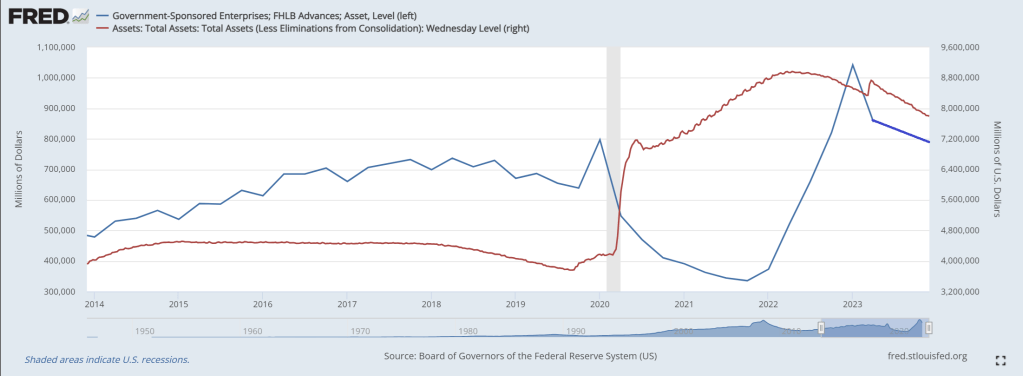
The Federal Home Loan Bank System (comprised of Federal Home Loan Banks or FLUBs) are a major source of American home loans and liquidity … at least until now.
According to a recently released report, the Federal Housing Finance Agency (FHFA) plans to propose rules that would curtail US banks’ borrowings from the Federal Home Loan Banks (FHLBs) to ensure they are not used as a “lender of last resort.” The announcement comes after the liquidity crunch in March spurred several banks to tap into the FHLB system, sending FHLB advances to a three-year high in the first quarter. During that quarter, when two large regional banks failed, FHLB advances totaled $804.39 billion, comprising 3.7% of banks’ total liabilities.
While totals have fallen since then, sitting at $602.62 billion, or 2.8% of total liabilities, in the third quarter, the FHFA is still seeking to impose limitations. Should the agency enact the new rules, banks’ liquidity options would be hindered. The FHFA wants Federal Reserve facilities to be used instead, but banks are reluctant to tap those because of the stigma attached to those sources, industry experts said.
“It is fair to argue that some banks have come to rely on FHLB funding as a crutch, and the ramp in lending to struggling banks during the mini-crisis in March is an area of continued debate,” Isaac Boltansky and Isabel Bandoroff of BTIG LLC wrote in a Nov. 11 note. “With that being said, there is still a clear stigma associated with tapping the Fed’s Discount Window and other facilities, which should be part of the conversation if the FHLB support will eventually be curtailed.”
Among the various rules the FHFA plans to propose is requiring that certain members have at least 10% of their assets in residential mortgage loans or equivalent mission assets, including assets that qualify as Community Financial Institution collateral, on an ongoing basis in order to stay eligible for FHLB financing.
The leading FLUB borrower? Columbus Ohio’s own JP Morgan Chase!
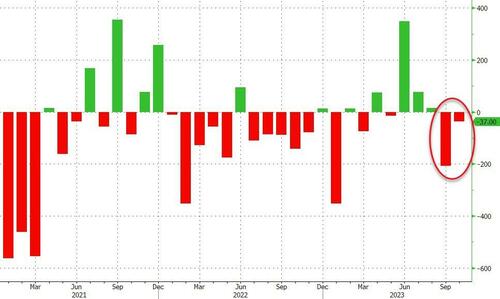
The problem is that bank credit growth has been contracting for several weeks now. 18th straight week of negative credit growth.
As FLUB advances decline with Fed balance sheet shrinkage.
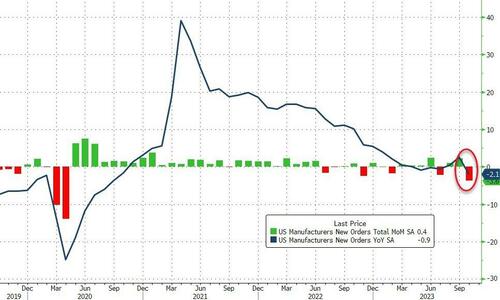
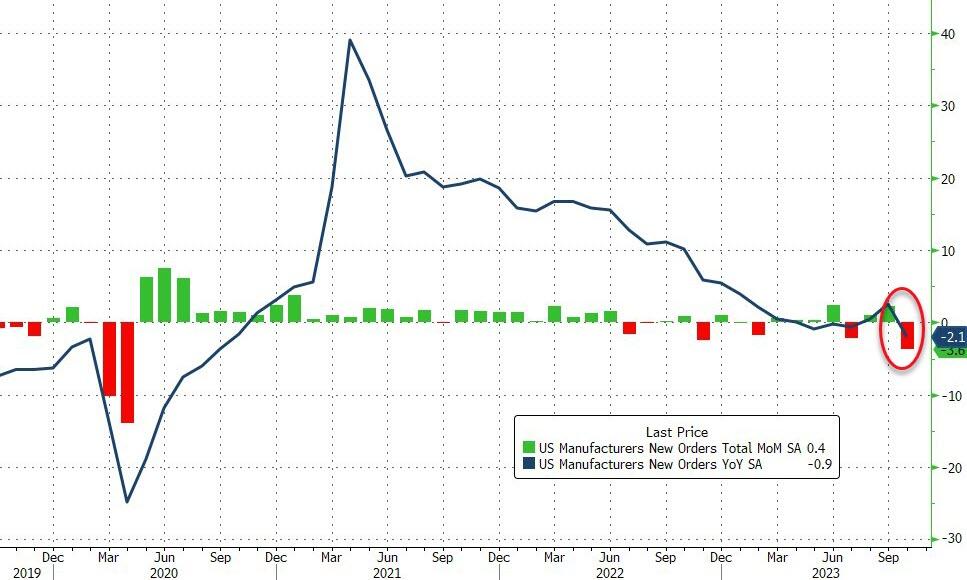
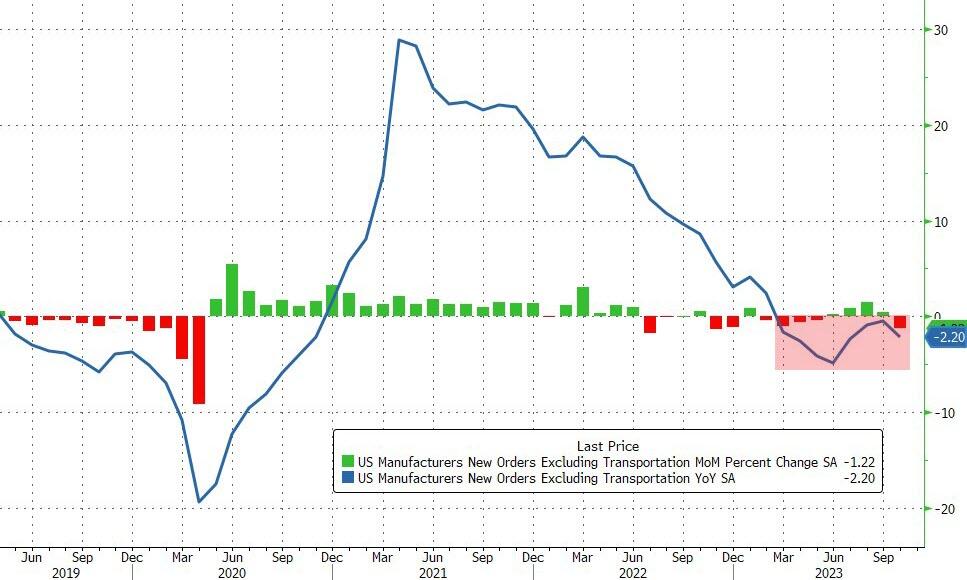
Factory orders tumbled even more than expected, down 3.6% MoM – the biggest drop since the COVID lockdowns (April 2020). September was also revised lower (making October’s decline even worse) from +2.8% MoM to +2.3% MoM…
Source: Bloomberg
The big monthly decline and revisions dragged orders down 2.1% YoY (the biggest drop since Sept 2020).
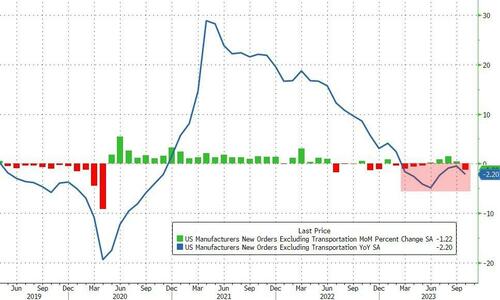
Core factory orders also dropped (-1.2% Mom), leaving them down 2.2% YoY – the eight month in a row of annual declines…
Source: Bloomberg
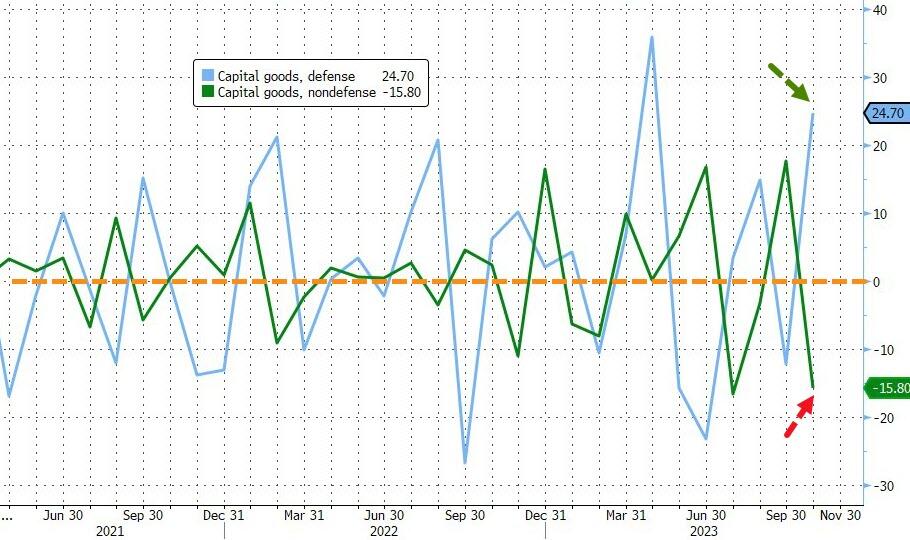
The final Durable Goods Orders data for October confirmed the preliminary print plunge down 5.4% MoM.
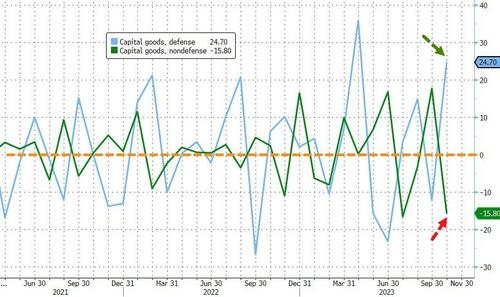
Finally, we note that it could have been a lot worse as Defense spending shot up 24.7% MoM (as non-defense dropped 15.8% MoM0…
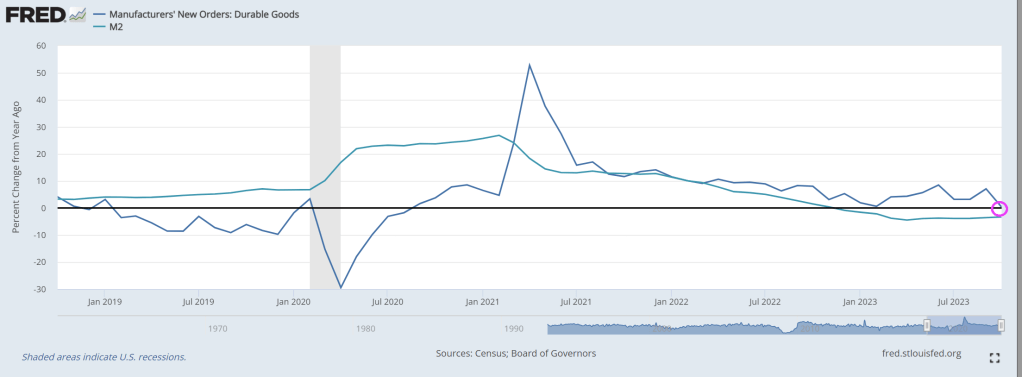
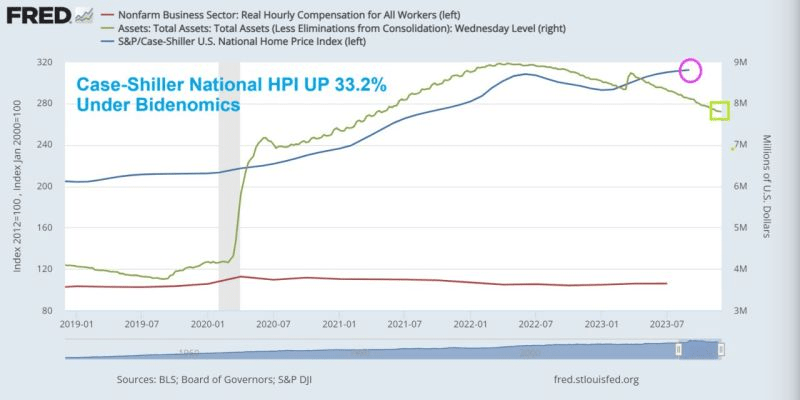
While the Case-Shiller National home price index is rising again, it has been slowing since March 2022. This is happening as “the honey pot” (aka, M2 Money printing) growth is now negative. While real hourly compensation growth is slightly, the average rate of growth since April 1, 2021, is -2.1%. (Not exactly what Biden wants to broadcast as a feature of Bidenomics).
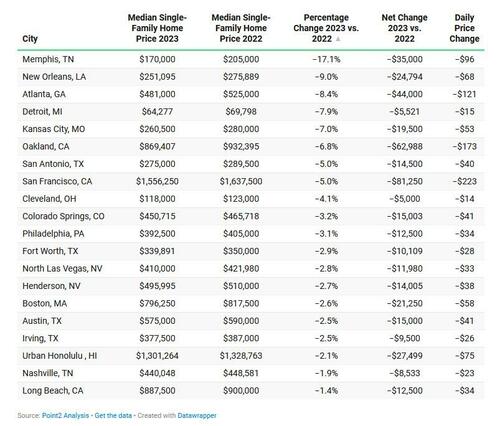
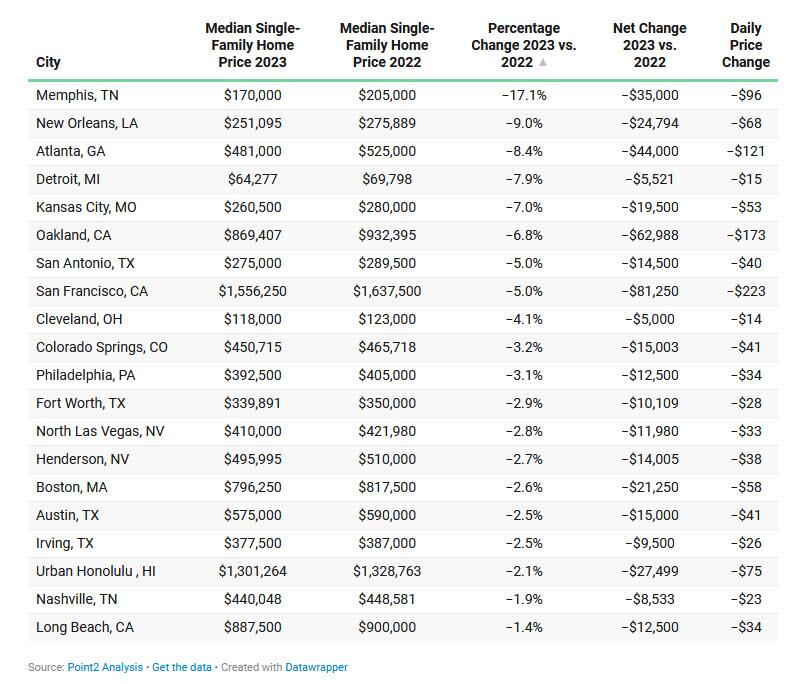
According to a recent report from Point2 Homes, many recently bought homes, particularly in the hottest regions, are deep in the red. On average, single-family homeowners have been shedding $223 in property value every day since they bought their homes last year.
Condo owners are faring even worse, losing up to $336 a day in San Francisco, or a stunning $122,500 a year.
“This double-blow market means that the most newly minted owners were first hit by the highest home prices in history, only to be cut off from building wealth by the current falling prices,” analysts wrote.
Some major markets are seeing massive net losses
Single-family homes in 16 cities examined in the analysis have faced price declines of over $10,000 over the past year.
Memphis saw the most significant single-family price plunge, as well as the second-largest decline in condo prices, which analysts say could be due to rising inventory in the city.
Condo prices in 37 cities are also weakening, including in New York and Oakland.
So, what does this mean for homeowners? Folks who shelled out plenty of cash last year to secure their deals are now grappling with depreciating property values, which means it’s harder to build equity.
And if they want to sell in today’s market, they risk reaping less for their homes than what they paid for them. Zillow reports new buyers won’t sell at a profit until they’ve spent over a decade in their homes.
In another report from Redfin, analysts estimated that more than 3% of homes sold at a loss between August to October this year. The median amount was recorded at around $40,000, although some properties lost up to six figures on the sale.
Again, San Francisco sellers reported the biggest losses, with 1 in 7 homeowners losing money on their sales. And Memphis TN leads in percentage loss at -17.1%!
There are a couple of factors that could be contributing to the Golden City’s housing woes, including the rise of remote work coupled with tech layoffs pushing residents to relocate to other areas.
“There are buyers out there, but they’re a lot more cautious and picky than they were when mortgage rates were low,” Redfin Premier real estate agent Andrea Chopp said in September.
“The Bay Area housing market was unsustainable before, so this correction is probably healthy, but the unfortunate thing is prices remain unaffordable for a lot of people—especially with rates now above 7%,” she said.
97% of sellers are in the money, though
It’s not all doom and gloom for sellers—at least not for those who’ve been residing in their homes for a long time and bought when prices were much lower than they are today.
In many markets, sellers have been reluctant to let go of their low mortgage rates and apply for a home loan at a much higher rate, and that’s keeping inventory tight and prices high.
In the three months ending July 31, 97% of sellers across the country sold for a profit, with the typical home selling 78.4%, or $203,232, more than the seller bought it for, says Redfin.
And while San Francisco has been reporting more losses than usual, the median homeowner is still reaping $625,500 more on their home sale compared to the original purchase price.
The Godfather of San Francisco property losses, California Governor Gavin Newsom.
While members of the Biden Administration party at DC nightclubs, the rest of America are drinking Carlo Rossi wine (a favorite of mine in high school!) and eating Spam.
While hourly pay has increased, inflation has outpaced it.
Spending on basic survival needs like food, transportation, housing, and energy has increased, with households in the Mountain West facing the highest rates of inflation.
“We choose January 2021 as the base month because it was the last time inflation was within recent historical norms,” the report reads.
“Due to a combination of higher inflation rates and higher average household spending, inflation is imposing the highest monthly costs on families in the states of Colorado, Utah, and Arizona,” the report adds.
Families in Colorado and Washington, DC, are experiencing inflation costs higher than the national average.
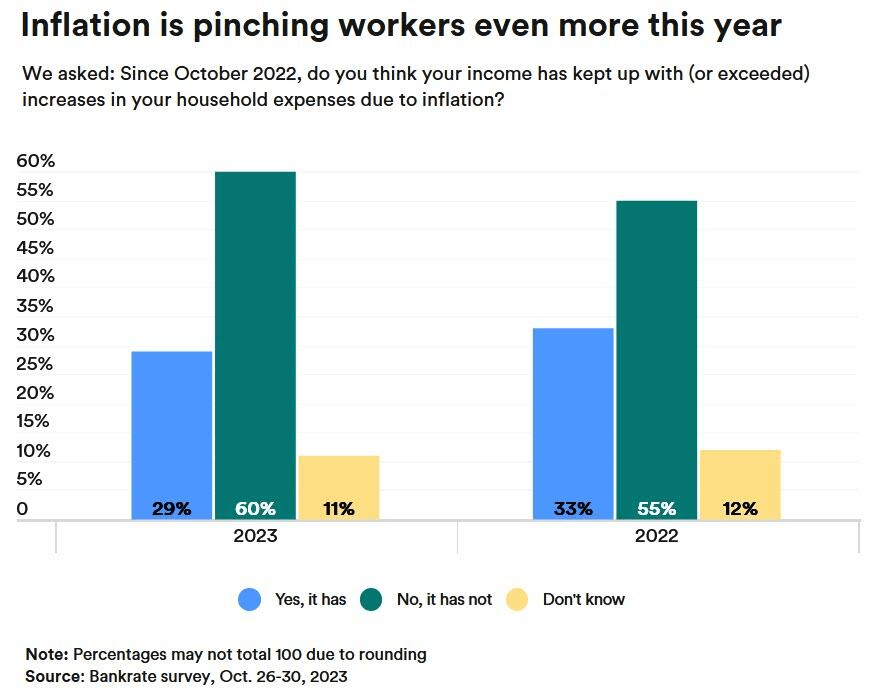
Things are even worse in 2023 regarding inflation ravaging worker’s income. Over 60% of Americans reported that their wages were lagging well behind inflation.
Since January 2021, US purchasing power of the US Dollar is down a whopping -15.4% under Biden.
And home prices are up 33.2% under Biden, much of it due to The Feral Reserve money printing to fund Biden’s folicy initiatives. (I saw Biden claim he wrote the Inflation Reduction Act … the one thing we know is House legislation is written by an army of Congressional staffers, not El Presidente).
Home prices up 33.2% and purchasing power of US Dollar down -15.4% under Biden.
And like magic, Biden made $11,400 disappear from household income to pay for Bidenomics.
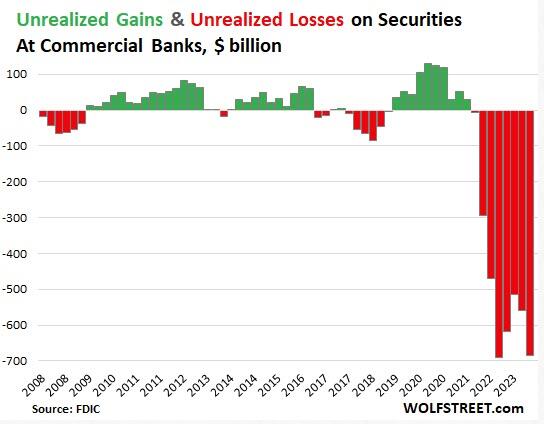
Unrealized losses on securities held by US banks exploded by 22% in the third quarter.
Of course, unrealized losses don’t really matter — until they do.
This is yet more evidence that the financial crisis that kicked off last March continues to bubble under the surface.
Unrealized losses, primarily on US Treasuries and mortgage-backed securities rose by $126 billion in Q3 and now total $684 billion, according to the FDIC’s quarterly bank data release.
Current unrealized losses are only slightly below the record set in the third quarter of 2022. This reflects the fact that the FDIC took over three failed banks earlier his year and ate their unrealized losses when it sold the banks’ assets, thus wiping them from the books.
Unrealized looses on securities are divided between two accounting methods.
Unrealized losses on held-to-maturity (HTM) securities jumped by $81 billion to $391 billion.
Unrealized losses on available-for-sale (AFS) securities jumped by $45 billion to $293 billion.
It’s important to understand these are only paper losses. Ostensibly, the banks will hold these bonds until maturity and then will be paid their face value. If it plays out this way, there won’t be any real losses.
The problem is that these unrealized losses drastically decrease a bank’s liquidity. If it has to sell bonds in order to raise capital, the bank will experience significant losses. This is exactly what took down Silicon Valley Bank last March.
Here’s what happened.
SVB sold a large portion of its bond portfolio at a $1.8 billion loss. At the time, SVB CEO Greg Becke said the bank made the sale “because we expect continued higher interest rates, pressured public and private markets, and elevated cash burn levels from our clients.”
The bank bought the bonds when interest rates were low. As a result, the $21 billion available for sale (AVS) bond portfolio was not yielding above cash burn. Meanwhile, rising interest rates caused the value of the portfolio to fall significantly. The plan was to sell the longer-term, lower-interest-rate bonds and reinvest the money into shorter-duration bonds with a higher yield. Instead, the sale dented the bank’s balance sheet and caused worried depositors to pull funds out of the bank.
WolfStreet explained more generally how these “irrelevant” unrealized losses can suddenly become relevant.
Banks, via a quirk in bank regulations, don’t have to mark these securities to market value, but can carry them at purchase price. The difference between market value and purchase price is the ‘unrealized gain or loss’ that the bank must disclose in its quarterly financial filings, so that we the depositors can see them and get spooked by them and yank our money out, us billionaires and centimillionaires first, on the two fundamental principles of investing: 1, he who panics first, panics best; and 2, after us the deluge.”
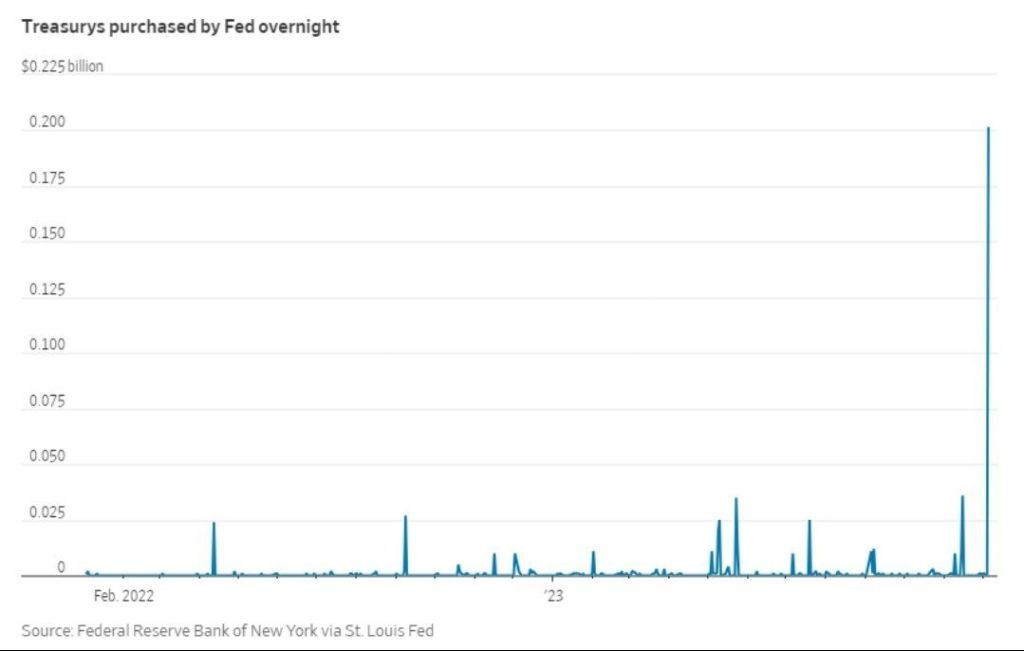
The Federal Reserve set up a bailout program to allow banks to deal with this problem. Instead of selling bonds at a loss, cash-strapped banks can go to the Fed’s Bank Term Funding Program (BTFP) and borrow against them “at par” (face value). This allows banks to use these undervalued assets to raise cash (at least temporarily) without realizing big losses on their balance sheets.
As unrealized losses rise, banks continue to tap into this bailout program more than nine months after the crisis kicked off.
In effect, the Fed managed to paper over the financial crisis with this bailout program.
It basically slapped a bandaid on it. But it has not addressed the underlying issue – the impact of rising interest rates on an economy and financial system addicted to easy money.
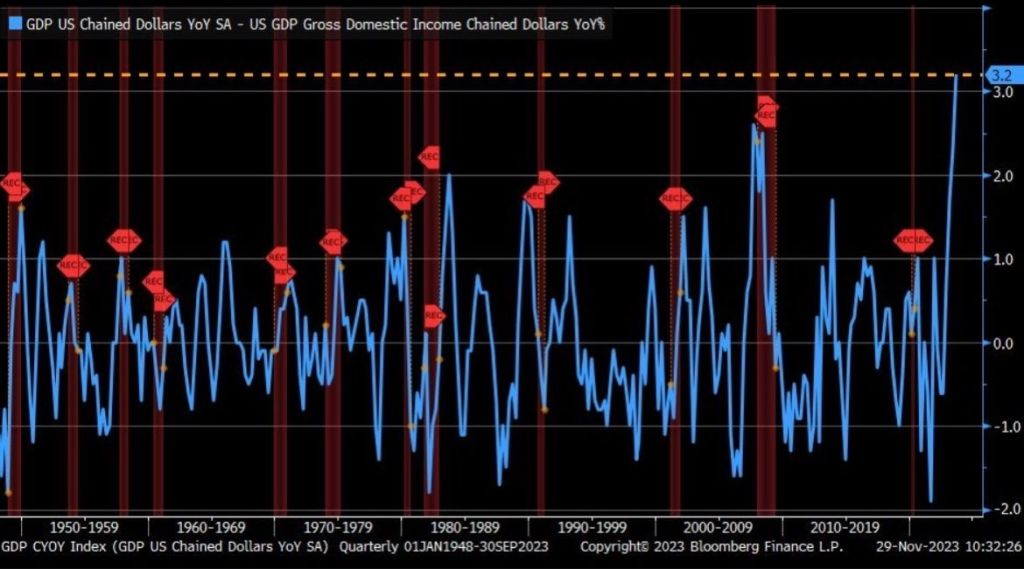
Remember, the US is on the cusp of a REAL recession, thank to Bidenomics.
The spread between real GDP and real Gross Domestic Income (GDI) just hit an all-time high. Even higher than The Great Recession of 2009.
Might as well have AC/DC’s Angus Young as US Treasury Secretary instead of tone-deaf Janet Yellen.


You must be logged in to post a comment.