$32 TRILLION of global stock value has been wiped out since December 2021.
Today’s core PCE deflator reading of 4.9% YoY shows that the inflation surge is not over. With a core PCE deflator of 4.9%, the Taylor Rule suggests that The Fed Funds Target Rate should be at 9.65%, far below its current level of 3.25%. So, IFF The Fed is following any sort of rule, rates should continue to soar.
And if we use headline inflation of 8.30% YoY, the Taylor Rule suggests hiking the target rate to 14.75%.
Inflation is stubborn because “goin’ green!” by 1) restricting US fossil fuel production and exploration and 2) Biden/Congress endless spending splurge since Covid. So, The Federal Reserve has a tough problem: cooling inflation while US energy prices are up 54% under Biden. And those higher energy prices have percolated through the entire economy in terms of food prices and heating prices.
Where do we sit? The US Treasury 10yr-2yr yield curve remains inverted (a sign of impending recession). Mortgage rates are the highest in 14 years as The Fed tightens.
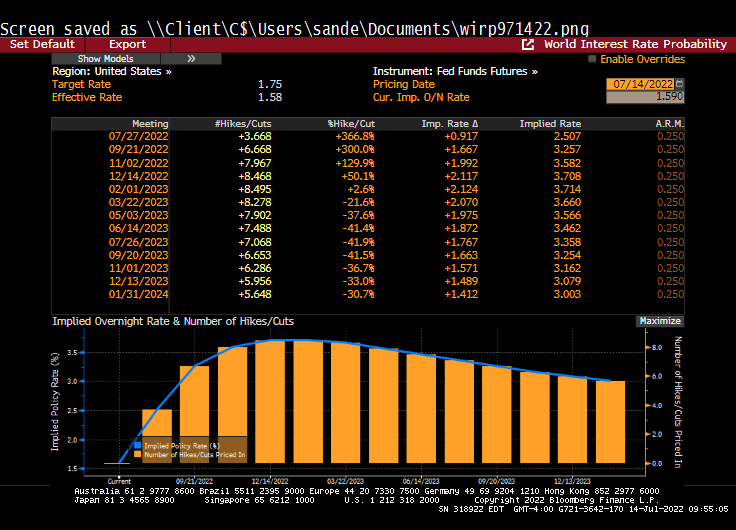
If we look at Fed Funds Futures data, we can see that traders expect The Fed’s target rate to rise to 4.395% by March 2023’s FOMC meeting. Then traders expect The Fed to take their enormous foot off the tightening pedal.
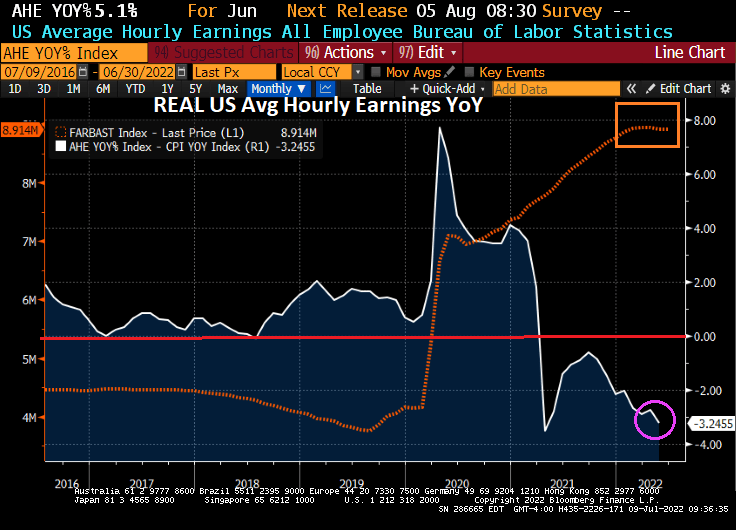
Yes, inflation is crushing the middle class and low-wage workers. Average hourly earnings YoY after we subtract inflation are negative.
Taylor Rule? Currently, the Taylor Rule based on Core inflation of 4.56% YoY suggests a Fed target rate of 9.14%. Since traders anticipate the target rate to peak at 4.395%, The Fed will almost be halfway towards cooling inflation.
The problem is … Fed Chair Powell and Treasury Secretary Yellen don’t like rules limiting their “power.” Powell and Yellen think the Taylor Rule is a New Jersey ham product.
(Bloomberg)Investors who might be looking for the world’s biggest bond market to rally back soon from its worst losses in decades appear doomed to disappointment.
The US employment report on Friday illustrated the momentum of the economy in face of the Federal Reserve’s escalating effort to cool it down, with businesses rapidly adding jobs, pay rising and more Americans entering the workforce. While Treasury yields slipped as the figures showed a slight easing of wage pressures and an uptick in the jobless rate, the overall picture reinforced speculation the Fed is poised to keep raising interest rates — and hold them there — until the inflation surge recedes.
Swaps traders are pricing in a slightly better-than-even chance that the central bank will continue lifting its benchmark rate by three-quarters of a percentage point on Sept. 21 and tighten policy until it hits about 3.8%. That suggests more downside potential for bond prices because the 10-year Treasury yield has topped out at or above the Fed’s peak rate during previous monetary-policy tightening cycles. That yield is at about 3.19% now.
Then we have Bankrate’s 30-year mortgage rate soaring on Fed intervention expectations.
Inflation? US inflation is near its highest in 40 years and the USDollar Plain Vanilla Swap was at 0.50 when Biden first took office as President and is now 3.371 (quite an increase!).
Here is an interesting chart of FNCL 2% Agency MBS.
The ADP National Employment Report SA Private Nonfarm Level Change printed this morning confirming what most of us already knew … the US economy is slowing if not already in recession.
The ADP jobs added grew by only 132k in August as The Fed’s M2 Money growth slowed.
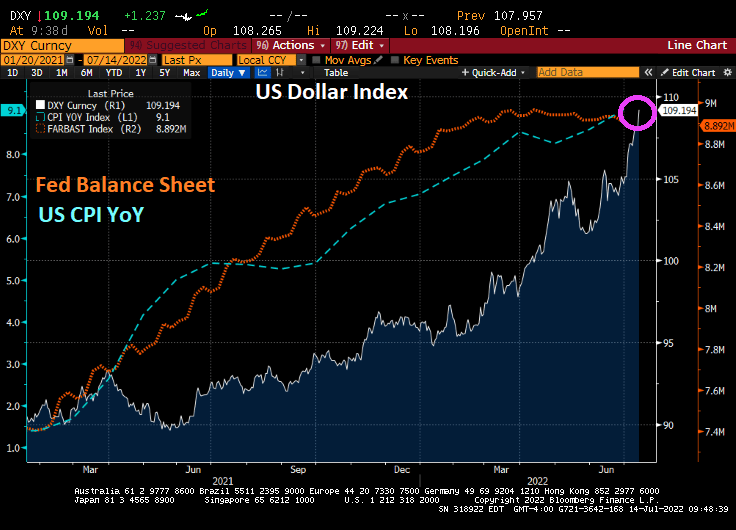
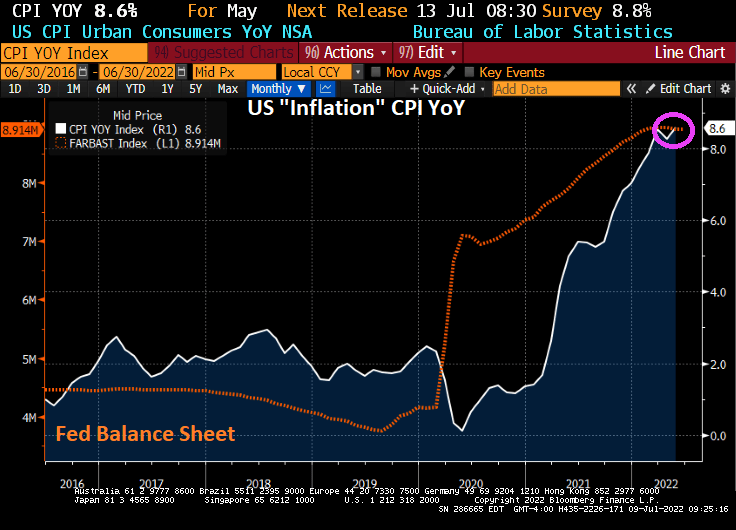
Since The Federal Reserve and Federal government overstimulated the economy when Covid surfaced in early 2020, The Fed’s balance sheet expanded to near $9 TRILLION which helped existing home sales median price YoY hit 25.2% in May 2021 but falling to 10.8% YoY in July 2022 as The Fed tightened rates.
It will be a monetary inferno if The Fed decides to actually unwind its $9 trillion balance sheet.
The US housing market is sensitive to Fed “catch-up” monetary tightening. For example, the NAHB’s traffic of prospective homebuyers declined rather dramatically in August as The Fed tightened rates and the 30yr mortgage rate rose. That is what I call a “Nestea Plunge.”
How are mortgage rates impacted by Fed monetary policy? While The Fed began really “sloshing” markets with excess stimulus (QE in late 2008), the latest round of QE (or asset purchases) came with the US Covid shutdowns (what genius thought of that??) and that stimulus has NOT been withdrawn yet. Only the Fed Funds Target rate has tightened.
The 30yr mortgage rate rose with Fed rate tightening, but the Fed’s System Open Market Holdings (SOMH) of Treasury Notes and Treasury Bonds has come down a bit. But not the pare-down The Fed has hinted at. The 30yr mortgage rate is cooling as the prospect of future Fed rate hikes declines.
As of this morning, The Fed Funds Futures market points to rates rising until March 2023 … then easing again.
One reason The Fed has been slow to sell assets off its balance sheet is that a large chunk of T-Notes and T-Bonds are maturing shortly. It will be a matter of whether The Fed reinvests the proceeds or lets the balance sheet wind-down.
Agency mortgage-backed securities (MBS) prices started to degrade as The Federal Reserve started to try to combat inflation caused by Biden’s energy policies and rampant Federal spending. That is, under June when the implied Fed O/N rate (red line) cooled and the 30-year mortgage rate (blue line) has come down a little.
In terms of duration risk, the FNCL 3% MBS duration has risen with anticipated Fed tightening.
So, further Fed tightening will result in greater MBS losses AND rising duration risk.
Bear in mind that a strong dollar is a two-edged sword. The US Dollar Index has risen 16% year-over-year, presenting a big hurdle for US firms with business overseas.
That strength of the greenback will rise until the Fed makes a dovish policy pivot.
And that pivot is forecast to occur at the Feb ’23 FOMC meeting.
US inflation is the highest in 40 years, yet inflation may be slowing as 1) The Fed cranks up interest rates and 2) the global economy is slowing.
US inflation data in the coming week may stiffen the resolve of Federal Reserve policy makers to proceed with another big boost in interest rates later this month.
The closely watched consumer price index probably rose nearly 9% in June from a year earlier, a fresh four-decade high. Compared with May, the CPI is seen rising 1.1%, marking the third month in four with an increase of at least 1%.
While persistently high and broad-based inflation is seen persuading Fed officials to raise their benchmark rate 75 basis points for a second consecutive meeting on July 27, recession concerns are mounting. There are signs, though, that price pressures at the producer level are stabilizing as commodities costs — including energy — retreat.
But the expectations of inflation, as measured by The Fed’s 5-year forward breakeven inflation rate, just crashed to 1.8437%.
The breakeven inflation rate is a market-based measure of expected inflation. It is the difference between the yield of a nominal bond and an inflation-linked bond of the same maturity.
The USD Inflation Swap Forward 5Y5Y is also falling like a rock as The Fed hikes their target rate (green line).
Could it be that inflation is cooling with Fed rate hikes (but not the shrinking of their $8 trillion balance sheet)?
Currently, Fed Funds Futures are pointing to a Fed target rate of 3.552% by February 2023. And with that, Bankrate’s 30-year mortgage rate rose to 5.75%. Once again, like velociraptors from Jurassic Park, The Fed’s balance sheet is still out in force.
Fed Chair Jerome Powell and Atlanta Fed President Raphael Bostic are keeping The Fed’s balance sheet at near $9 trillion as they hunt assets to inflate.
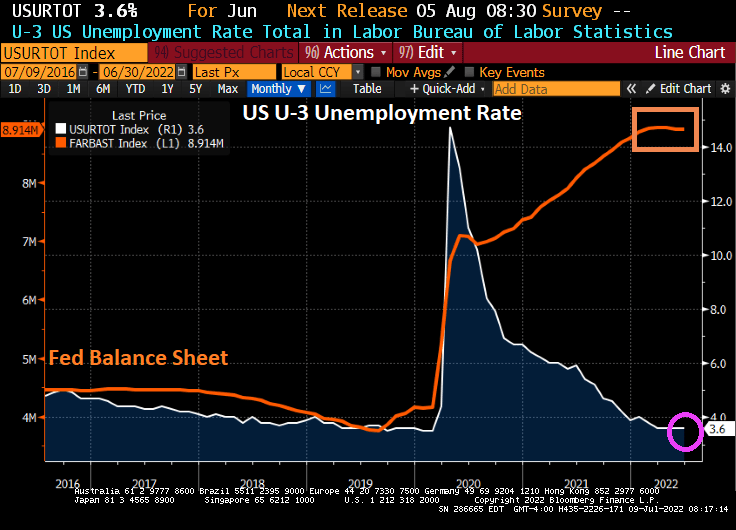
Take the US U-3 unemployment rate. The Biden Administration is proud of the unemployment rate of 3.6%. But if you look at the chart of unemployment relative to The Fed’s balance sheet expansion due to Covid lockdowns, there is still almost $9 trillion of Fed stimulus outstanding.
Of course, the lockdowns were pure economy killers, so opening the economies again led to the unemployment rate falling to 3.6% which is still higher than before the Covid outbreak. But The Federal Reserve has been painfully slow at shrinking its balance sheet, leaving almost $9 trillion in monetary stimulus outstanding.
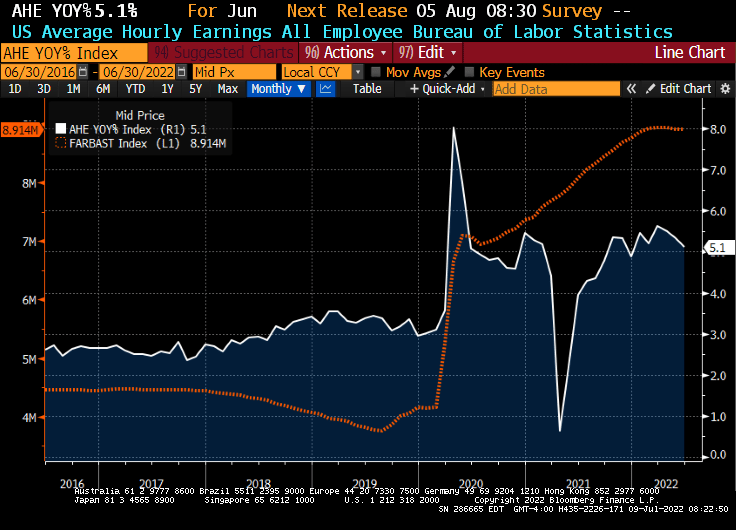
Take average hourly earnings growth. The media is all smiles as US wage growth declined to 5.1%, much higher than pre-Covid.
Then we have inflation, at 40-years highs thanks to massive Fed stimulus (and Federal spending).
And if we deduct inflation from average hourly wage growth, we see REAL wage growth declining at a -3.25% YoY clip.
Lastly, we have the US Dollar. Nothing has been the same since the financial crisis of 2008 and the entrance of The Federal Reserve distorting the economy and prices. Not to mention the US Dollar.
The Fed leaving its monetary stimulus out in force for so long is a major policy error. So what happens when The Fed actually gets serious about withdrawing the monetary stimulus (likely after the midterm elections)?
TED refers to the difference between the three-month Treasury bill and the three-month LIBOR based in U.S. dollars, a measure of fear in the market.
The 3-month TED spread is rising awfully fast. A sign of impending recession.
US bank credit default swaps (CDS) are rising fast as inflation gets ugly.
The US Treasury 10Y-3M curve is bumping against the zero barrier.
I am still shaking my head at President Biden chastising gasoline stations for not lowering prices at the pump when refiners are near full capacity and the Biden Administration is doing nothing to increase the supply of US-source non-green energy.


You must be logged in to post a comment.