US existing home sales in November collapsed by -38.6% YoY as M2 Money growth runs out of gas.
The above chart is similar to yesterday’s “Ski Slope” chart of US home prices YoY.
Unfortunately, pending home sales YoY are the worst in recorded history.
What will President Biden do about this dire situation? Our “Vacationer in Chief” is off on yet another vacation to St. Croix in the US Virgin Islands, so probably nothing. Now that Biden is sunbathing, what will his Treasury Secretary Janet Yellen do?
The market began downshifting earlier this year as the Federal Reserve started hiking its benchmark interest rate, with the goal of easing high inflation that’s been driven in part by skyrocketing housing costs.
Rates for 30-year, fixed mortgages reached 7.08% in October — and again in November — though they have since retreated, Freddie Mac data show. With borrowing costs roughly double where they were at the start of the year, and inflation leaving less savings to put toward a down payment, homebuyers have pulled back. Sellers are also reluctant to list their properties, yet houses that are on the market are lingering and getting discounted as demand slumps.
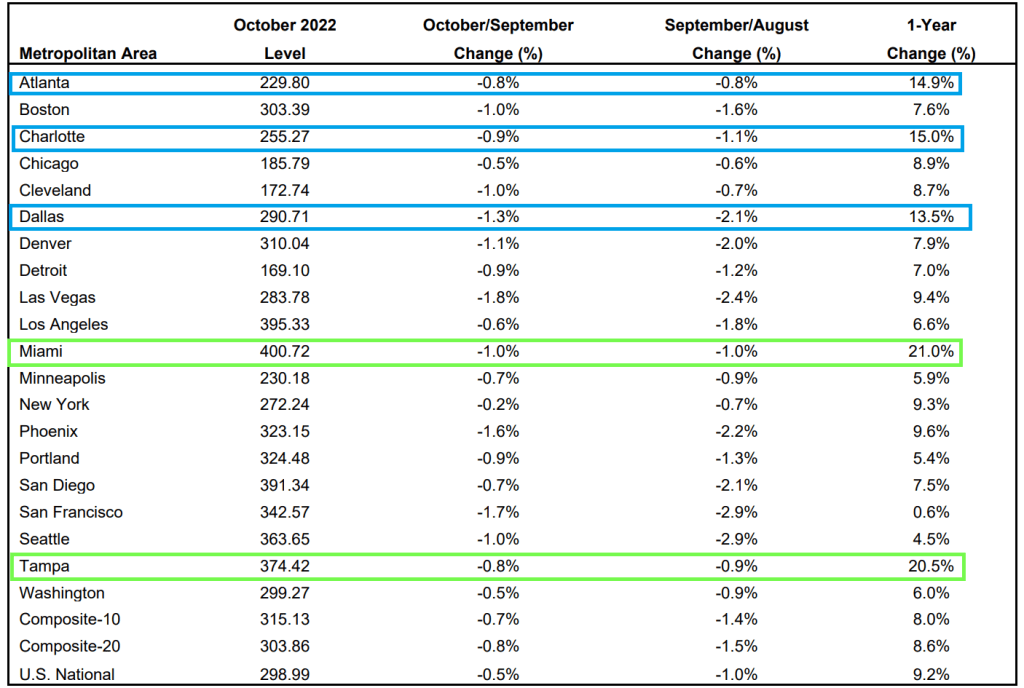
The Case-Shiller National Home Price Index “cooled” to 9.24% YoY growth as The Federal Reserve tightens its monetary noose.
Of the top twenty metro areas, both Miami and Tampa Florida were up over 20% YoY. Hot ‘Lanta, Charlotte and Dallas were over 10% YoY. Mordor on the Potomac was up “only” 6% and all other metro areas were under 10%.
But if we look at October/September changes, all metro areas are down (MoM) with San Francisco the worst.
Finally, The Federal Reserve’s massive balance sheet is still out in force.
Look at this chart of the Case-Shiller National home price index again The Fed’s balance sheet. Uh-oh.
Let’s look at San Francisco (my hometown) since The Federal Reserve began interest rate tightening.
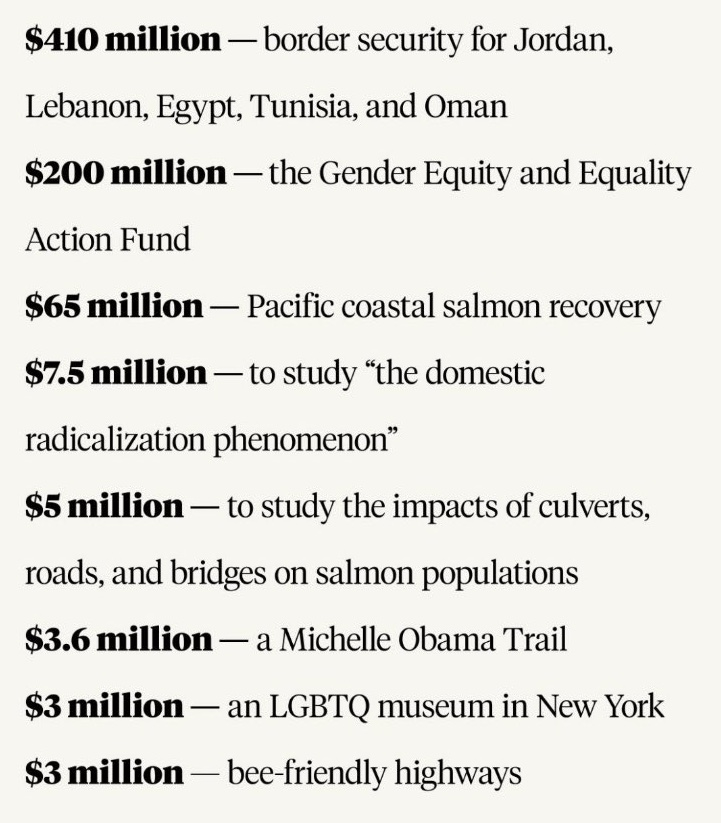
Here are the Lords of Darkness (Schumer and Pelosi) who concocted this witch’s brew of crony payoffs that will be ulitmately signed by El Stupido (Biden).
Do I detect a trend in the US Leading Economic Indicator data?
The Conference Board’s US Leading Economic Indicator was released this morning and it wasn’t pleasant. The US Leading Index was down -1% MoM in November.
On a year-over-year basis, it is down -4.5% YoY as The Fed withdraws its massive monetary stimulus.
The good news … for military contractors … is that Biden and Congress have given Ukraine’s Zelenskyy ANOTHER $47 BILLION.
On a year-over-year (YoY) basis, US real GDP rose to a measly 1.9%. US core PCE YoY fell slightly to 4.93%. M2 Money growth is at 2.6% YoY.
The Misery Index (U-3 inflation rate + inflation) remains elevated and above 10% (it currently clocks-in at 12%), far above the pre-Covid reading of around 5%.
Here is the rest of the story. On a quarter-over-quarter basis, real GDP rose to 3.2% QoQ. Personal consumption rose 2.3% QoQ. Core PCE (Personal Consumption Expenditures) rose to 4.7% QoQ. If we use core PCE as a measure of inflation, inflation is rising.
Here is a video of Fed Chair Jerome Powell (doubling as President Joe Biden) saying creating inflation and then raising interest rates to fight it “It’s for the best.”
The Federal Reserve forecast for the US economy is a dismal 0.50% YoY. Do I detect a trend?
The FOMC forecast for 2023 and 2024. Core PCE YoY (inflation) is forecast to drop to 3.50%, still considerably higher than The Fed’s target rate of inflation of 2%. And unemployment is forecast to be 4.60%.
To cope with Bidenflation, US personal savings rate as of October is -67.9% YoY. The “good” news is that rents YoY are crashing. But food prices under Inflation Joe remain very high. But most everything is slowing down, not due to Biden’s policies, but a global and US economic slowdown.
With a big slowdown coming our way, you can understand why The Fed’s December Dot Plot is showing declining Fed Funds Target rate starts declining in 2024.
Even US mortgage rates are headed down.
Speaking of going down, cryptos are down across the board with Cardano leading the decline at -6.91%.
Here is a chart (courtesy of Zero Hedge) showing reported payrolls and REVISED payrolls. Somehow, I don’t think Jean Pierre (Biden’s spokesperson, not the French chef) will be touting “Unlike Trump, our administration barely added any jobs in March, April, May and June 2022.
How will this revelation influence the Fed’s open market committee (FOMC) going forward knowing that the Biden Administrations job creation claims are wildly overstated?
Perhaps it doesn’t matter since Bernanke, Yellen and Powell don’t follow any rules (like the Taylor Rule), but generally with job creation almost nonexistant in March through June of 2022, The Fed should be cutting rates like mad. But wait! Can they with significant inflation?
The good news is that inflation is coming off its peak, but will take a while to get to The Fed’s 2% target. Hence The Fed may raise their target rate since they cannot achieve it will energy price up substantially since Biden became President.
In August 2020, the Federal Reserve unveiled its new strategic framework. One major objective of the Fed was to address its concerns over the potential consequences for the conduct of monetary policy when the policy rate was constrained by its effective lower bound. This article concludes that there are significant flaws in the new strategy and that it encourages a more discretionary approach to monetary policy and increases the risks of policy errors. The new framework is an overly complex and asymmetric flexible average inflation targeting scheme that introduces a significant inflationary bias into policy and expands the scope for discretion by broadening the Fed’s employment mandate to “maximum inclusive employment.” In a postscript, the article describes how quickly the flaws have been revealed and urges a reset toward a more systematic and coherent strategy that is transparent and broadly understood by the public.
I attended a speech by macoeconomist Gershon Mandelker at the National Association of Realtors where he called on the Federal Reserve to follow some observable rule rather than the complex (or seat of the pants) approach to monetary policy.
With today’s inflation report (core inflation YoY of 6%) results in a Taylor Rule estimate of The Fed Funds Target Rate of 12.07%. We are struggling to reach 5% as a “terminal” Fed target rate (currently at 4% and likely to rise 50 basis points at tomorrow’s Fed meeting).
The matrix of CPI and unemployment under the Taylor Rule shows that The Fed’s target rate isn’t at even 5% for any relevant combination of core CPI (inflation) and unemployment rate.
Note that since the financial crisis the Fed’s target rate (white line) has been consistely below the Taylor Rule implied rate (blue dashed line).
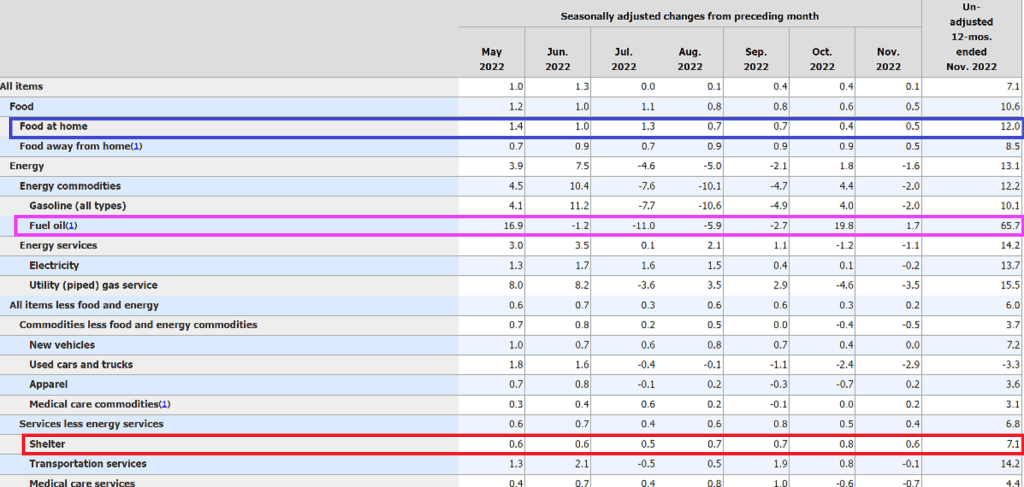
Is inflation “gone in November”? Nope. Slowing, yes, but at 7.1% YoY and core inflation at 6.0% YoY, it is still considerably higher than The Fed’s target of 2%.
And the American middle class and low wage workers are still suffering with REAL average hourly earnings growth at -1.9% YoY.
The good news for Americans? The global slowdown is helping to lower US Treasury yields which, in turn, helps to help to lower US mortgages rates. Kind of a perverse “good news” story when you think about it.
The bigger picture is the slowdown caused by 1) a global economic slowdown and 2) the tightening of Fed monetary policy to fight inflation.
Look at the Case-Shiller national home price growth YoY (blue line) against M2 Money growth YoY (green line). Just move the green line to the right and it covers home price growth. Both are slowing down with anticipated Fed rate hikes (red line) now at 50 basis points for the December 14th FOMC meeting. And note that The Fed’s balance sheet (orange line) has barely budged.


You must be logged in to post a comment.