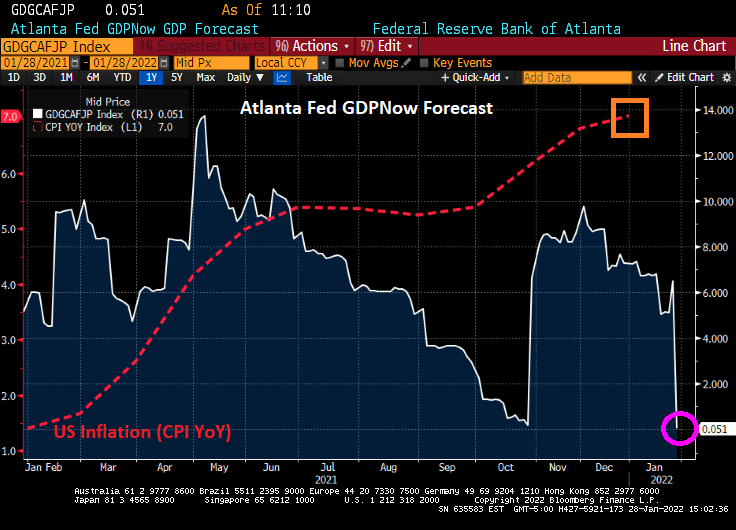
I thought the last inflation report of 7.5% inflation was bad. But then the Atlanta Fed updated their inflation measure for flexible prices. Flexible inflation, less food and energy, is roaring at 19% YoY!
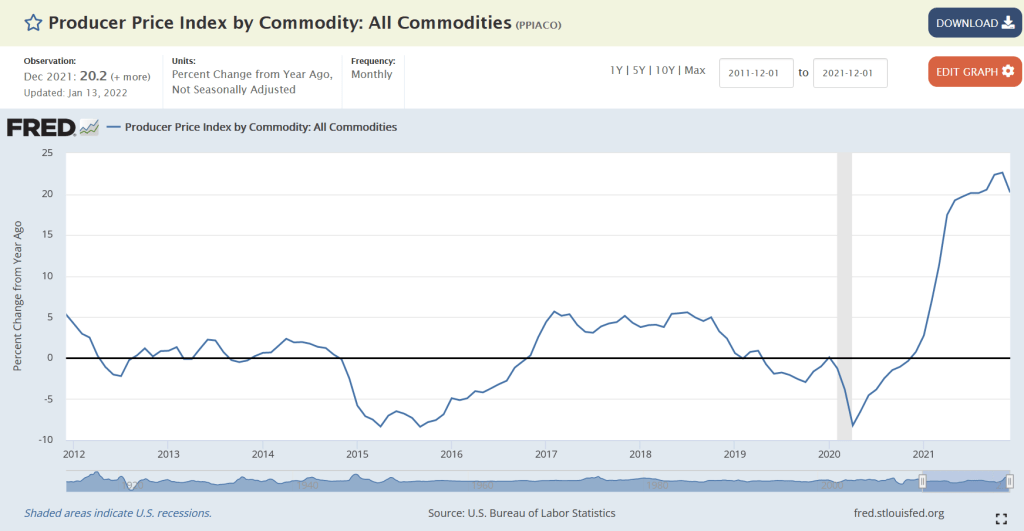
Flexible prices are those prices that adjust rapidly. Along with commodity prices.
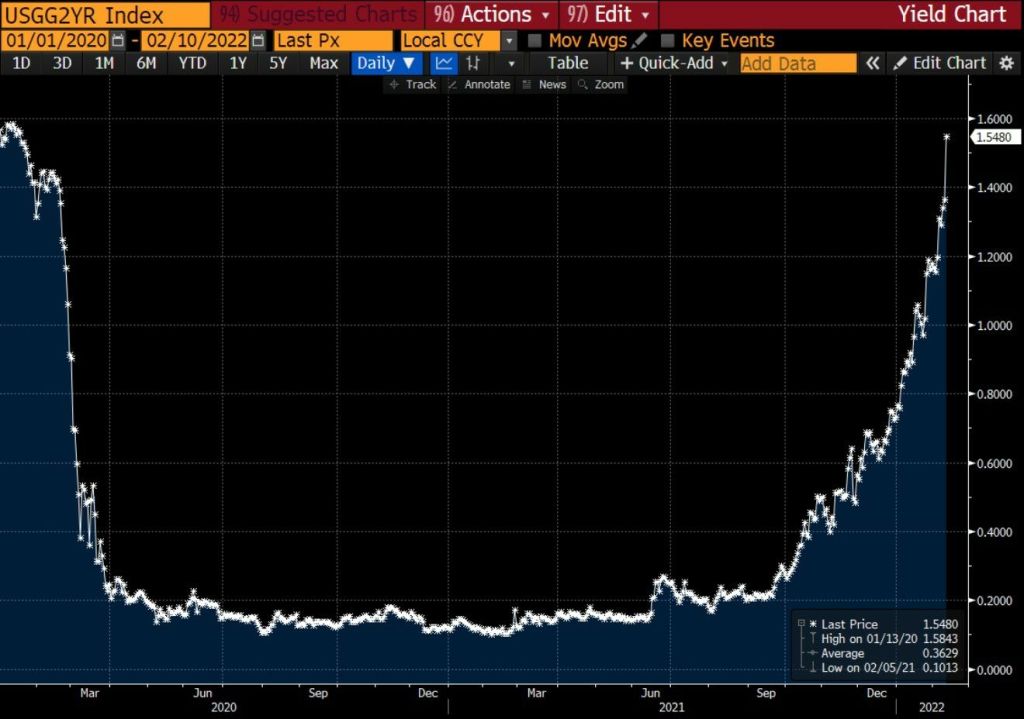
Speaking of rapid rises, take a look at the 2-year US Treasury yield since COVID struck in early 2020.
We did see 2-year Treasury yields generally correlated with The Fed Funds Target Rate … at least until COVID struck. Since mid-2020, The Fed Funds Target Rate remains at 0.25% while the 2-year Treasury yield is roaring back with fuzzy expectations from The Fed’s leadership.
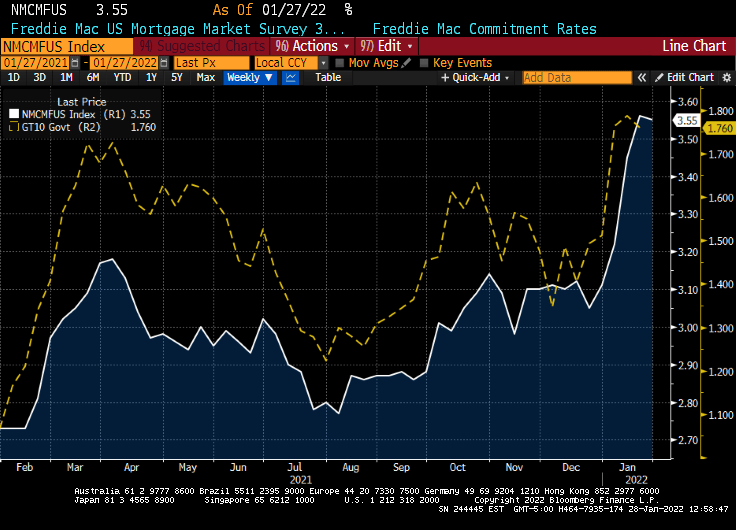
The 10-year Treasury yield is not rising as rapidly as the 2-year Treasury yield, but it is hovering around 2%.
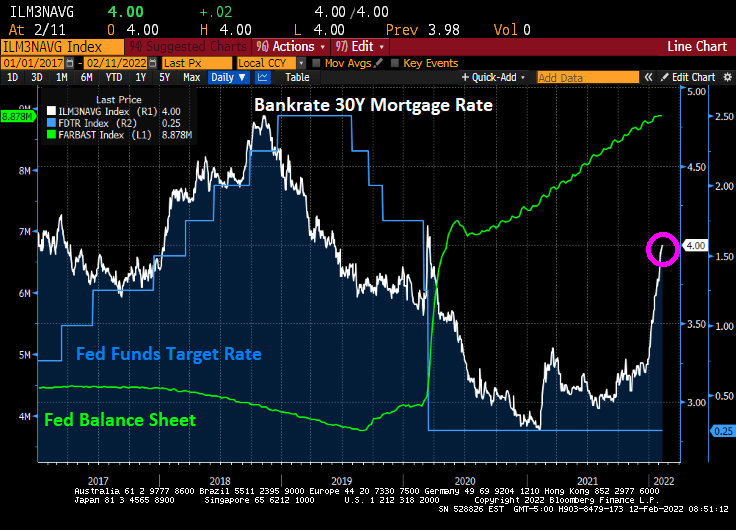
But Bankrate’s 30-year mortgage rate is rising like a comet, similar to the 2-year Treasury yield.
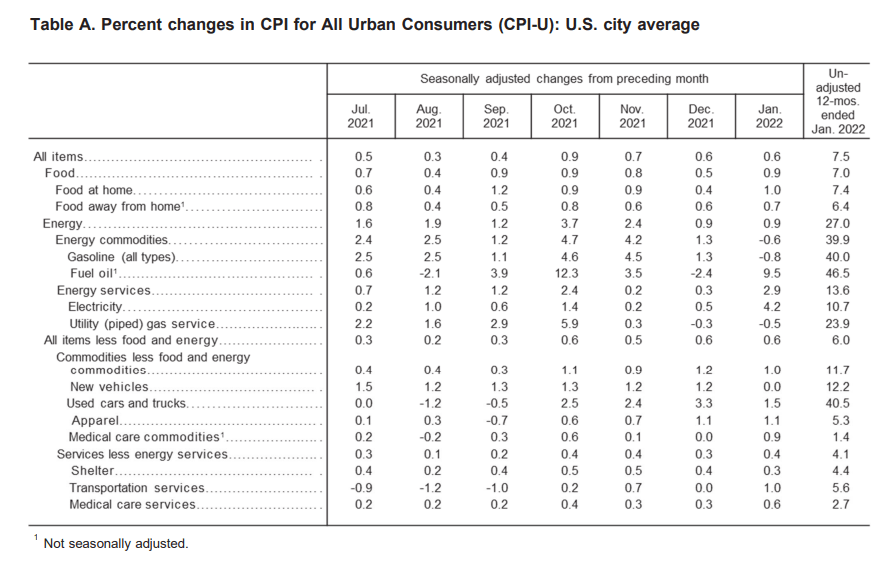
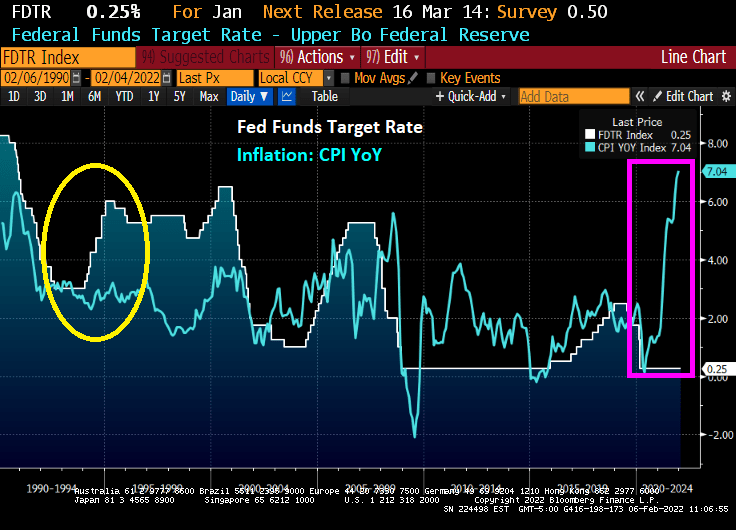
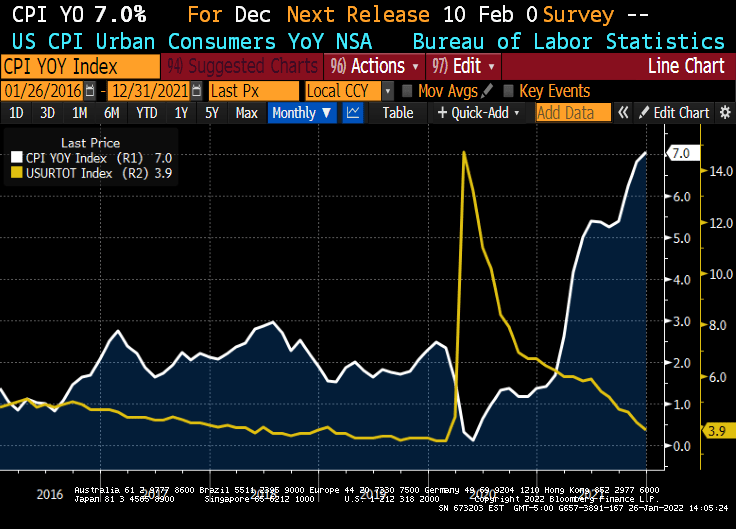
As expected, US inflation surged from 7.0% in December to 7.5% in January.
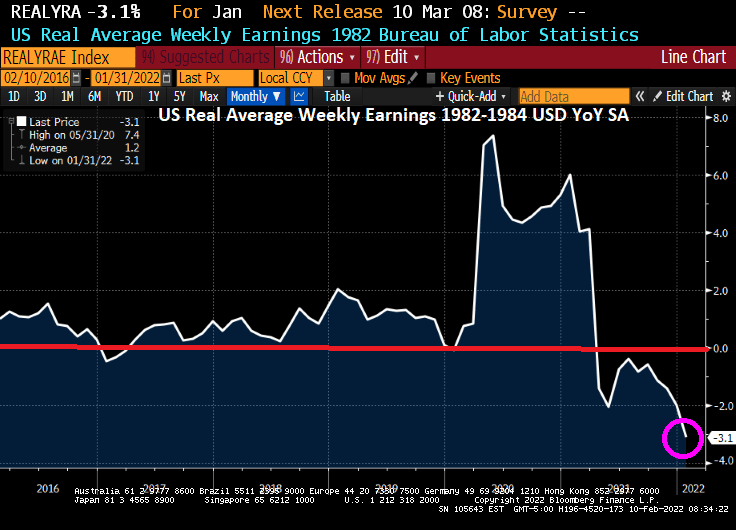
REAL average weekly earnings growth YoY fell to -3.1%.
Energy prices YoY lead the wage (fuel oil UP 46.5% YoY). Used cars and trucks UP 40.5%. At least food is up “only” 7%.
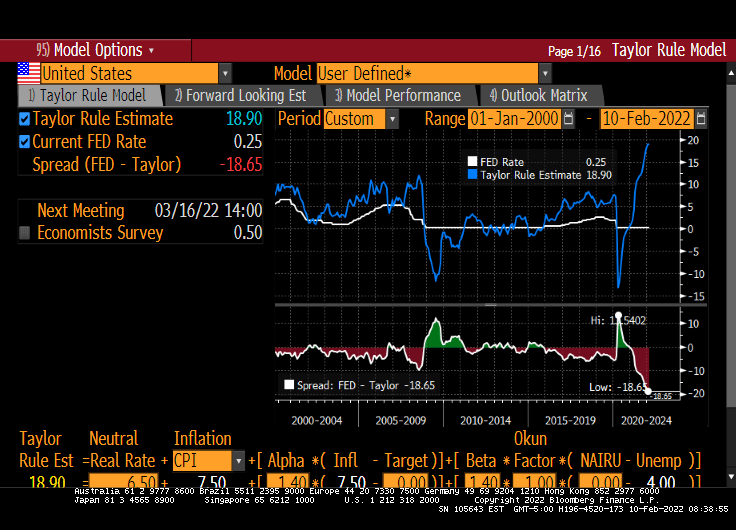
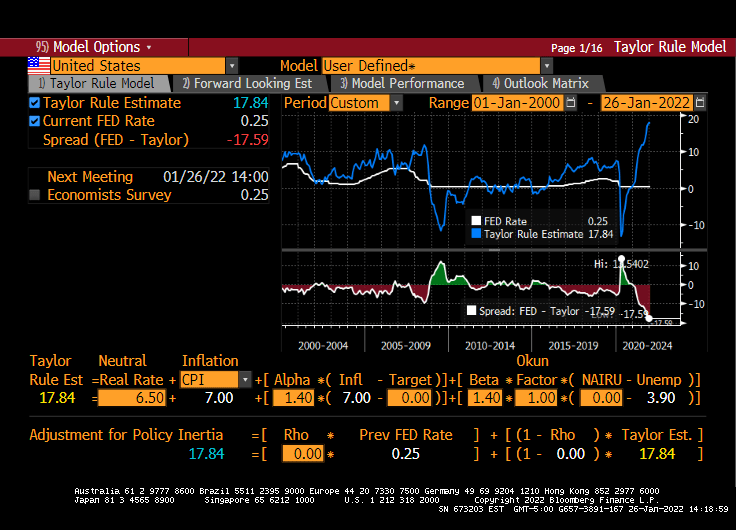
At 7.5% CPI, the Taylor Rule suggests that The Federal Reserve should have their target rate be 18.90%.
At least CORE inflation is “only” 6% YoY.
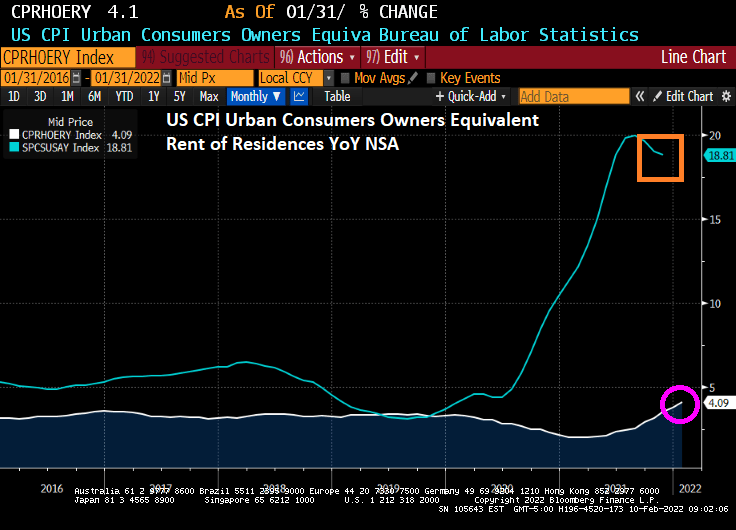
How about rent CPI? The owner’s equivalent rent of residences rose to 4.09% YoY. Seems a little misleading since home prices nationally are growing at 18.81% YoY.
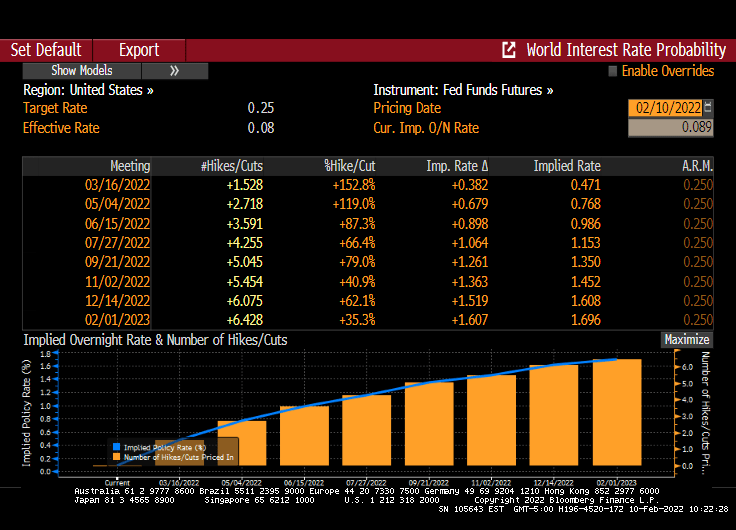
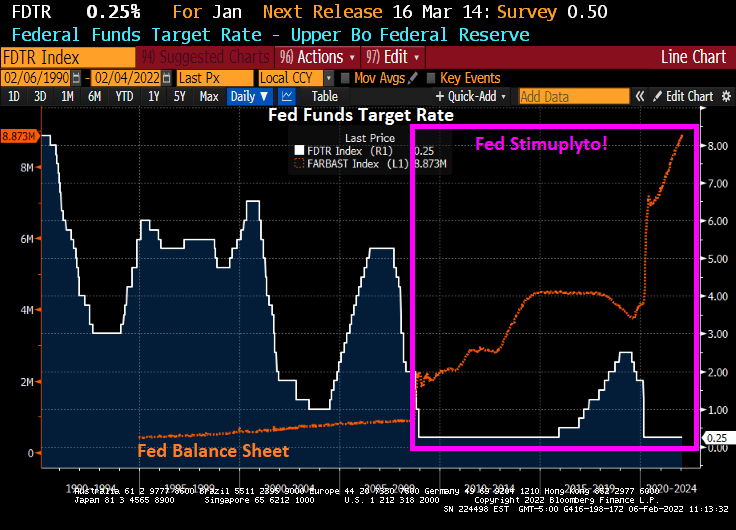
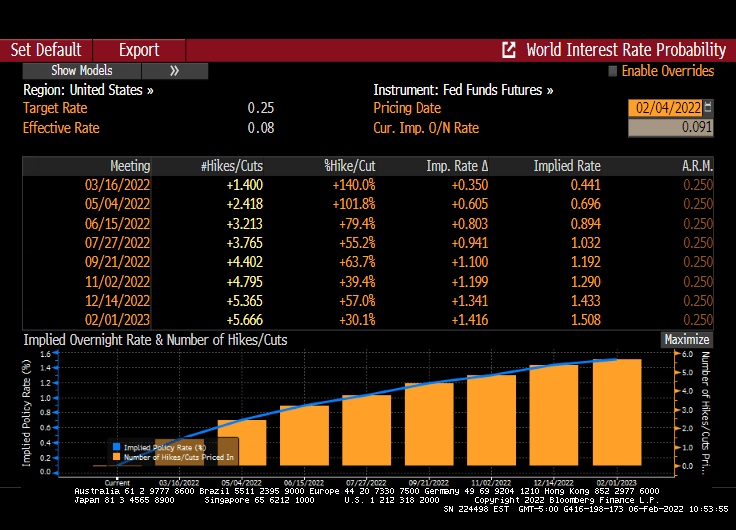
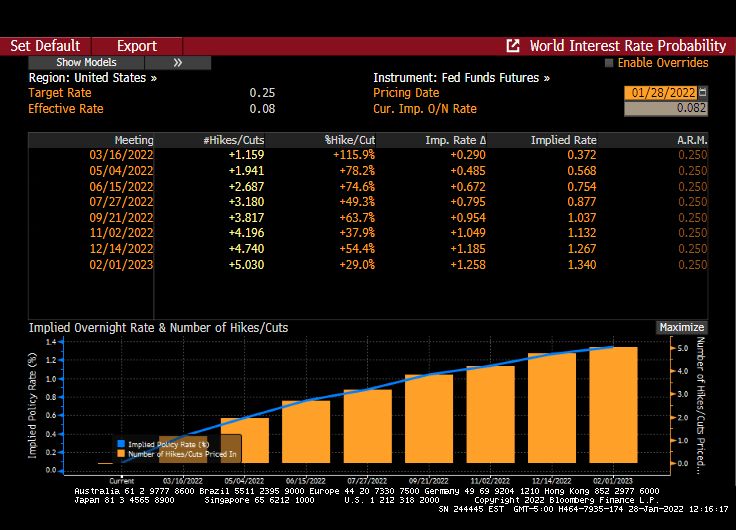
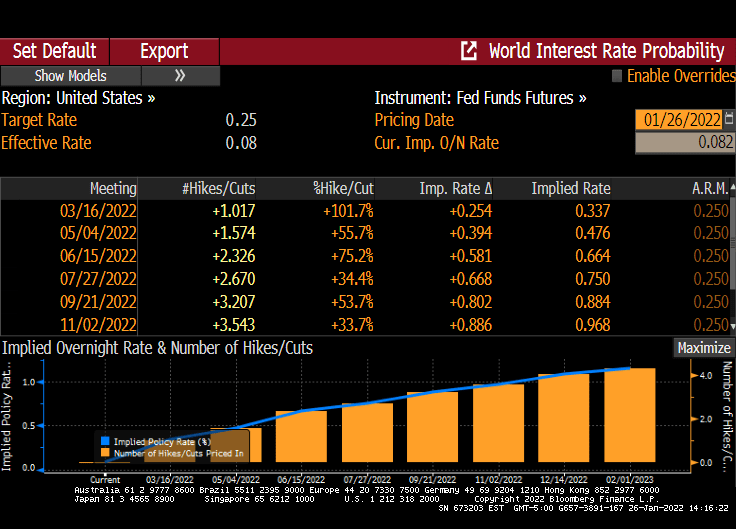
Fed Funds Futures data points to 6-7 rate HIKES over the coming year. BRACE FOR IMPACT!!
Yes, this is Powell’s famous chili recipe if The Fed actually starts to raise rates and pare back the balance sheet stimulus.
(Bloomberg) What a difference 25 years makes. Worried that inflation was about to turn higher, the Federal Reserve in February 1994 began raising interest rates, taking the federal funds rate from 3% to 6% a year later. As it turned out, those worries were unfounded: The U.S. consumer price index barely budged, finishing the year at 2.7%, right where it had started.
Although inflation in many developed-world countries is now well above those levels — 7% in the U.S. alone — of the major central banks only the Bank of England has started to raise short-term rates. They are now, um, 0.25%. Across the developed world, short rates are still either barely above zero or negative. What’s more astonishing is that even though they have cut their purchases, the Federal Reserve and European Central Bank continue to buy about $140 billion of longer-maturity bonds every month, suppressing long-term yields even as inflation rages.
Some central banks say that rate hikes are coming, but their extraordinary reluctance to deal with actual inflation means it will become entrenched. Not only will policy makers have to raise rates more than they envision, but they will have to cut the size of their massive balance-sheet assets, too. Don’t expect that the process will be anything other than awful for risky assets of all stripes.
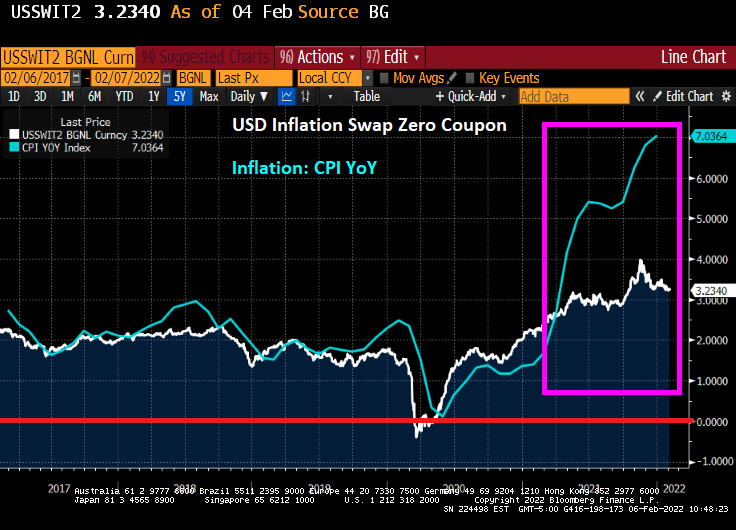
Over the last year and a half, inflation has not only accelerated but also broadened. It started with goods prices and has now expanded to services, even in the moribund euro zone. Central bankers and markets still believe inflation rates will come down a lot. The part of the swaps market that in essence predicts inflation in the future is pricing in a drop in the U.S. CPI to 3.6% by the spring of 2023 and to 3.25% the year after. Alas, like central bankers, the inflation swap market’s record is dreadful. In late spring of 2020, markets predicted a CPI of minus 1.35% a year later and staying below zero by the spring of 2022.
The US DollarInflation Swap is a poor predictor of inflation, at least under President Biden.
I’m not suggesting inflation will remain at current nosebleed levels. More likely is that having had a couple of decades of headline inflation that was on the low side — for central bankers, but not for anyone else — we are in for a few years when it remains above their targets.
Short rates will of course need to rise. That is problem enough for markets, but the bigger problem comes from the trillions of dollars of assets that central banks have accumulated on their balance sheets. Taken together, the Fed, ECB, Bank of Japan, Bank of England and Swiss National Bank have some $27 trillion of assets. In 2007, before the global financial crisis, the combined total was a little more than $4 trillion. Central bank assets will stop growing this year, undermining a major source of support for all types of bonds. But if inflation remains persistently high, central banks won’t simply be able to let their assets roll off as they mature, as most assume. They will have to start selling them. That is the big problem.
Central banks resorted to buying bonds and other financial assets (so-called quantitative easing) for a few reasons. The main one was to drive up inflation and inflation expectations from uncomfortably low levels by injecting more liquidity into the financial system and driving down longer-dated yields. Now that central banks have got much more inflation than they wanted, they will, by the equal and opposite token, need to sell the assets they bought. The longer inflation remains at current levels, the greater the pressure to sell. And they will probably need to do so sooner and faster than most expect and at prices a lot lower than they fetch today. The Fed alone owns about 30% of all the notes and bonds issued by the U.S. Treasury Department.
To say that central bank purchases have had a large effect on yields would be an understatement. One way of seeing this is to split the yield of a longer-dated bond into the part that reflects the expected path of interest rates over the life of the security from everything else. That “everything else” is the term premium. This should compensate investors for, say, sudden surges in inflation. Clearly, this is no longer true. Depending on what model you use, the term premium on 10-year Treasury reached a high of 450 basis points to 500 basis points in the early 1980s. At the nadir of the pandemic, it was minus 100 points and is now about minus 10 points. To be clear, this means that you get less buying a 10-year Treasury than would be suggested by the expected path of rates over the life of the bond — expectations that are almost certainly too low.
Term premiums below zero suggest bond investors are no longer compensated for things like inflation.
The driving down of government bond yields also compressed yields and spreads on investment-grade and junk bonds. That was the intent. Junk spreads reached their narrowest level ever in June of last year. With so little yield available in fixed income and central banks seemingly always on hand to bail them out, investors flooded into equities. As a result, many developed-world equity indexes are either very expensive or, in the case of the U.S., not far off their most expensive levels ever based on valuation measures that are a decent guide to future returns. That is what a decade and a half of market manipulation by central banks has done.
The policies of zero or negative rates and seemingly infinite QE looked idiotic (and were) when they were adopted, and time has not been kind. Paradoxically, they could only be sustained if central banks were wrong, and their policies failed to spark inflation. Now that inflation has taken hold, rates will go up substantially and balances sheets will need to shrink.
What would you pay for fixed-income assets now if you knew that central banks will become, in effect, forced sellers later? I can’t see how any financial asset will escape the damage from the likely lurch higher yields. The way out of these policies will be as nasty as the way in was nice.
Particularly since Fed Funds Futures are pointing toward 6 rate increases over the next year.
At least Treasury Secretary Janet Yellen is wearing her Mao jacket.
Raphael Bostic and Goldman Sachs are both calling for dramatic rate increases to fight inflation … that they helped cause with their monetary stimulypto. I call this The Fed’s March of the Toreadors as The Fed now attempts to kill the bull market.
(Bloomberg) — The Treasury yield curve flattened to the lowest level in over a year on Monday as the prospect of a super-sized Federal Reserve rate increase in March gained traction, weighing disproportionately on shorter-dated tenors.
Two-year U.S. yields climbed as much as 4 basis points after Raphael Bostic, the president of the Fed’s Atlanta branch, said the U.S. central bank could raise its benchmark rate by 50 basis points if a more aggressive approach to taming inflation is needed.
That narrowed the gap with ten-year counterparts — which rose about half as much — to the least since October 2020. The last time the Fed delivered a half-point increase to borrowing costs was at the height of the dot-com bubble in 2000.
The repricing extended a move spurred last week, after Fed Chair Jerome Powell underscored the policy maker’s determination to put a lid on inflation. The market positioning may have been exacerbated by hedge funds that had been leaning the wrong way before Powell’s address.
Traders are currently betting the Fed will deliver 32 basis points of tightening in March, more than fully pricing an increase of a quarter-point. That puts the implied probability of a 50-basis-point increase at almost 30%. The odds of such a move in December were zero.
Consumer prices rose an annual 7% in December, the fastest pace in almost four decades. Powell left the door open to increasing rates at every meeting, and didn’t rule out the possibility of a 50-basis-point hike.
In an interview with the Financial Times, Bostic stuck to his call for three quarter-point interest rate increases in 2022, while saying that a more aggressive approach was possible if warranted by the economic data. Bostic is a non-voting member of the FOMC this year.
Since the rapid growth in inflation was caused by a combination of too much Fed stimulus, too much fiscal stimulus and “green” energy policies, it is unclear whether an increase of 50 basis points will do much, particularly if Bostic’s own Atlanta Fed GDPNow forecast of 0.051% is accurate. Raising ratesif the economy is slowing??
To be clear, Bostic and others are trying to signal The Fed’s intent well in advance to avoid a surprise knock-down of the stock market. Or a killing of the bull market.
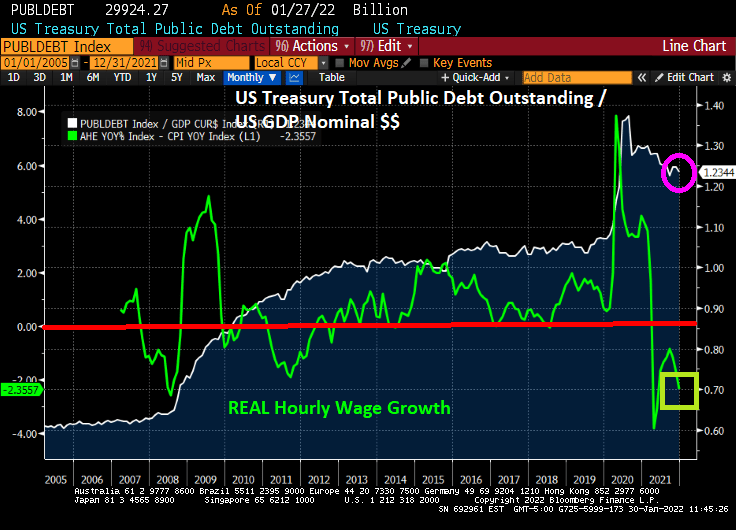
Nothing has been the same since the financial crisis of 2008 (except we still have insider-trading superstar Nancy Pelosi as US House Speaker). What has changed is that US Public Debt to GDP (nominal dollars) has doubled.
Has doubling Federal debt helped the hourly worker? Initially we saw a surge in REAL hourly wage growth in 2009 as the US began to recover from the housing bubble burst and ensuing financial crisis. Another surge in REAL wage growth occurred when Federal debt exploded as the COVID crisis took hold. BUT more recently we see that REAL wage growth is negative.
The other aspect of pain for hourly workers is inflation which has reached 7%, the highest rate in 40 years.
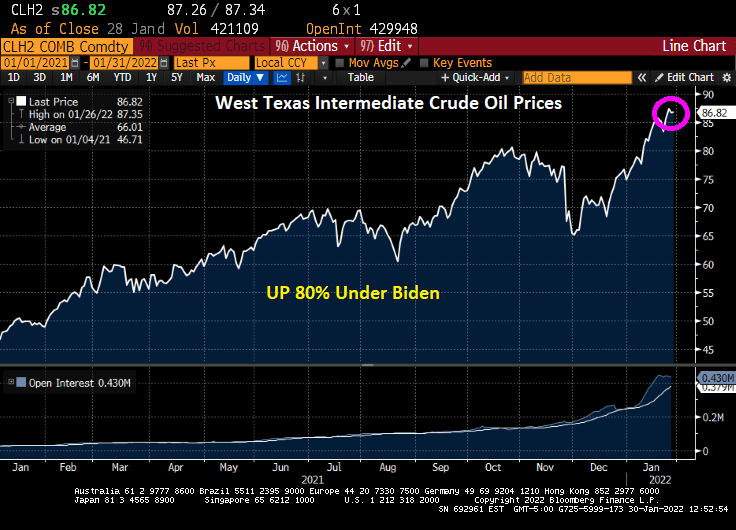
Adding to the frustration of hourly workers is energy prices rising 80% under President Biden’s reign of error.
Most hourly wage earners can’t buy a Tesla or a $100,000 electric Chevy Silverado to take advantage of Biden’s green energy policies.
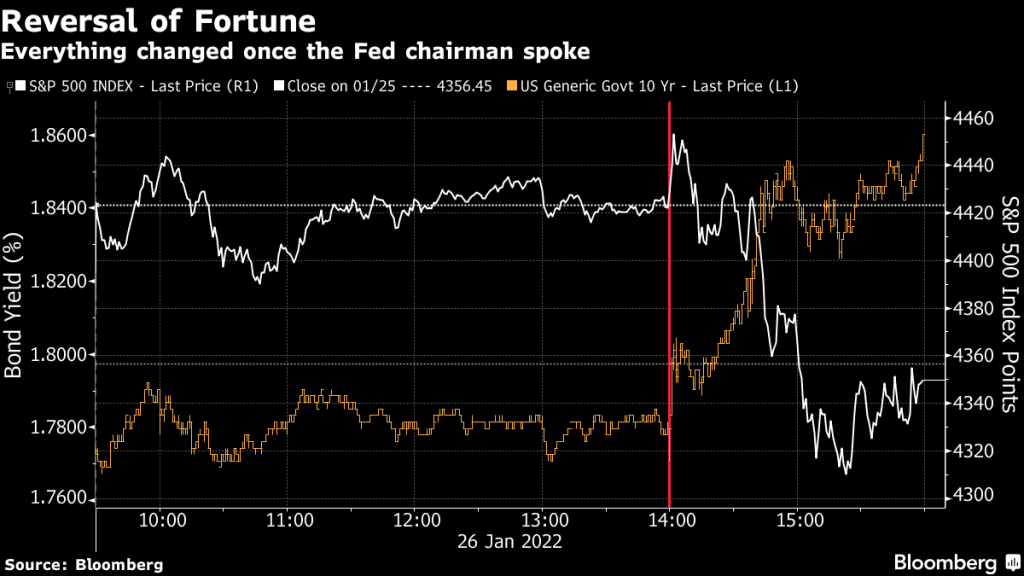
No, not the Klaus von Bulow type of “reversal of fortune” (when he killed his wife). I am talking about a reversal in fortune for America.
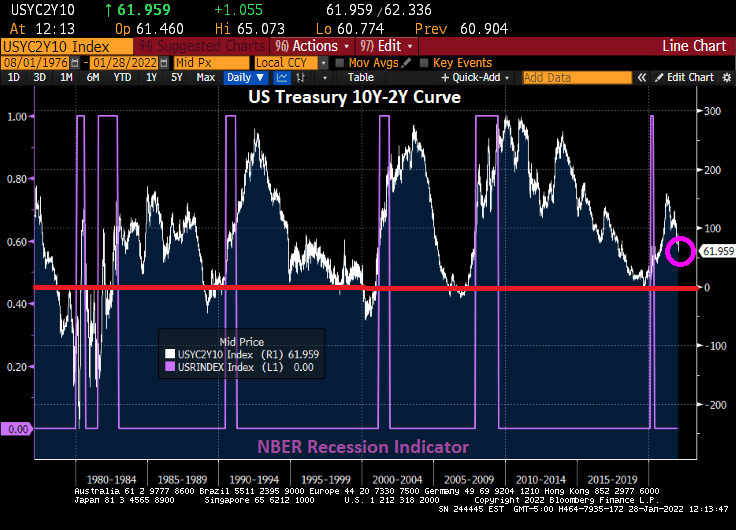
Let’s look at the 10Y-2Y Treasury curve. It typically falls below 0 basis points before every recession. Except the mini-COVID recession of 2020. But notice that the Treasury curve did not recover from the COVID recession as it typically did. More along the lines of 1984-1985.
Speaking of Reversal of Fortune, everything changed once Fed Chair Powell started to speak after Tuesday’s FOMC meeting.
Hmm. Midterm elections, possible Russian invasion of The Ukraine, further problems in China, etc. While The Fed Funds Future data implies that The Fed may raise their target rate 5 times over the coming year, we’ll see.
If 2021 was a great year for the US housing market, 2022 faces “a new normal” marked by a slowing down of home price rises, job layoffs in the mortgage industry, and concerns over rising inflation and interest rate hikes, according to Douglas Duncan (pictured), Fannie Mae’s senior vice president and chief economist.
Duncan said “a shift” was underway in the market and the wider economy, which would result in far more moderate home price appreciation, expected to be between 7% and 7.5% this year due to the ending of fiscal and monetary stimulus.
“One of the elements of the shift is that you’re going to see house prices up, but not nearly as far as they were in the last two years because that was driven hugely by the fiscal and monetary stimulus (now) being removed,” he told MPA.
Ominously, he added that low interest rates “may never be seen again”. Or at least until Biden appoints more doves to The Federal Reserve Board of Governors.
This is a case of “Too much money” in the economy, courtesy of The Federal Reserve.
(Bloomberg) — U.S. inflation-adjusted consumer spending fell last month by the most since February, suggesting that Americans tempered their outlays amid the latest Covid-19 wave and the fastest inflation in nearly 40 years.
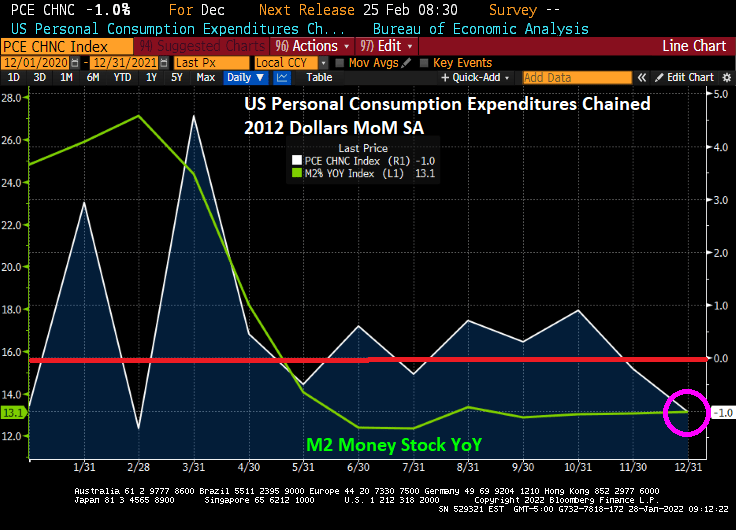
Purchases of goods and services, adjusted for changes in prices, decreased 1% from November, the Commerce Department said Friday.
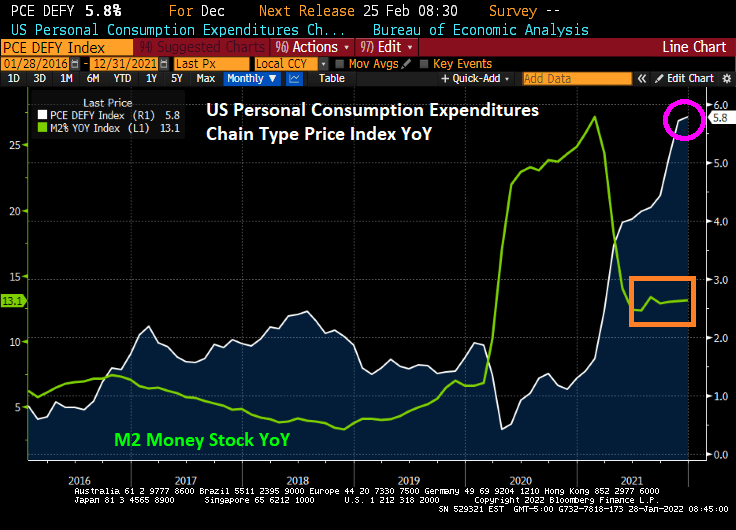
The personal consumption expenditures price gauge, which the Federal Reserve uses for its inflation target, rose 0.4% from a month earlier and 5.8% from December 2020, the most since 1982. Unadjusted for inflation, spending fell 0.6%, while incomes rose 0.3%.
Yes, the PCE Deflator YoY rose to 5.8% as M2 Money Stock is growing at a 13.1% YoY clip.
REAL personal spending declined 1% in December as prices rose in part thanks to the 13.1% growth in M2 Money stock YoY.
Too much money! Time to slow down, Jay Powell! Stop sucking the life out people with inflation.
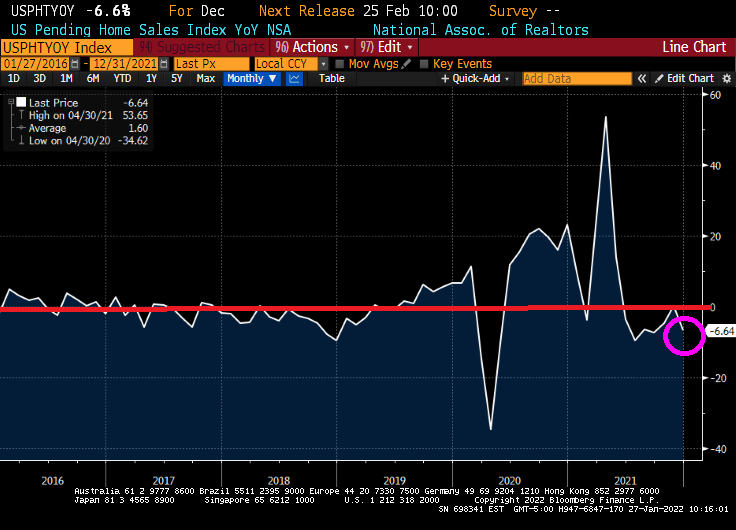
Pending home sales in the USA tanked 6.64% YoY. Yes, it was for December, but down 6.64% YoY means that pending home sales are lower than last December.
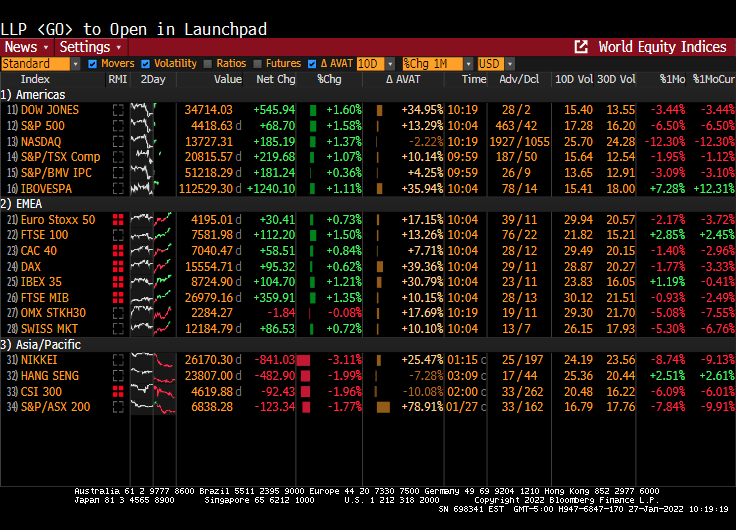
And the stock market was up across the board as Powell refused to take his foot off the monetary gas pedal.
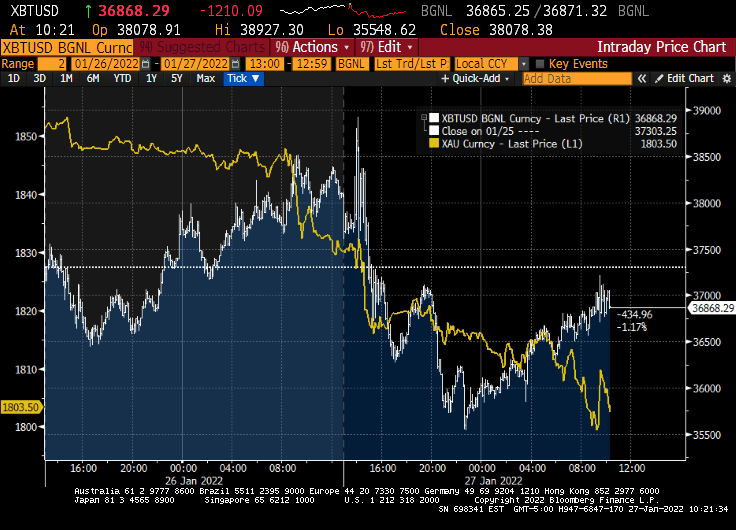
Gold is down along with Bitcoin for you ALT investment types.
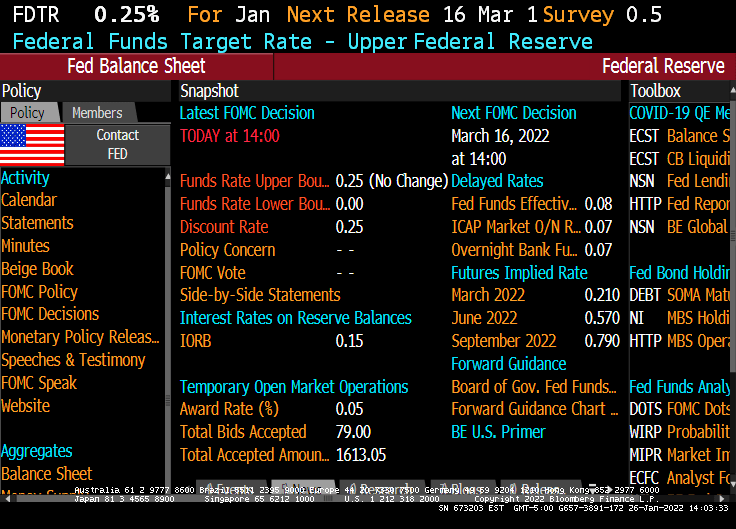
Despite inflation growing at 7% (versus The Fed’s target rate of 2%) and U-3 unemployment being only 3.9%, one would have thought that Jay and The Gang would have started increasing rates at the January meeting.
But nooooo. The Fed actually sat on their hands and did nothing.
What did The Fed say?
“The Committee seeks to achieve maximum employment and inflation at the rate of 2 percent over the longer run. In support of these goals, the Committee decided to keep the target range for the federal funds rate at 0 to 1/4 percent. With inflation well above 2 percent and a strong labor market, the Committee expects it will soon be appropriate to raise the target range for the federal funds rate. The Committee decided to continue to reduce the monthly pace of its net asset purchases, bringing them to an end in early March. Beginning in February, the Committee will increase its holdings of Treasury securities by at least $20 billion per month and of agency mortgage‑backed securities by at least $10 billion per month.“
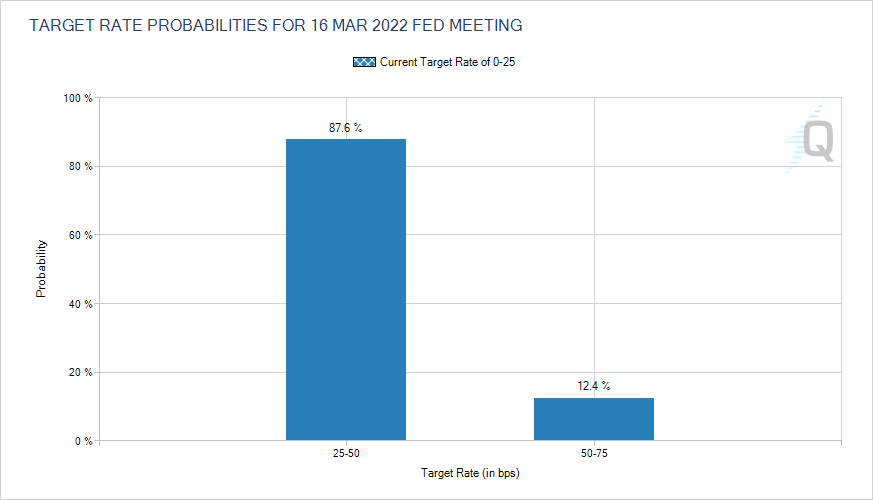
According to The Fed Funds Futures data, the market is anticipating 1 rate increase at the March FOMC meeting. And another at the June FOMC meeting.
The Taylor Rule (not used by Jay and The Gang), suggests that The Fed should have their target rate at almost 18%! NOT 0.25%.
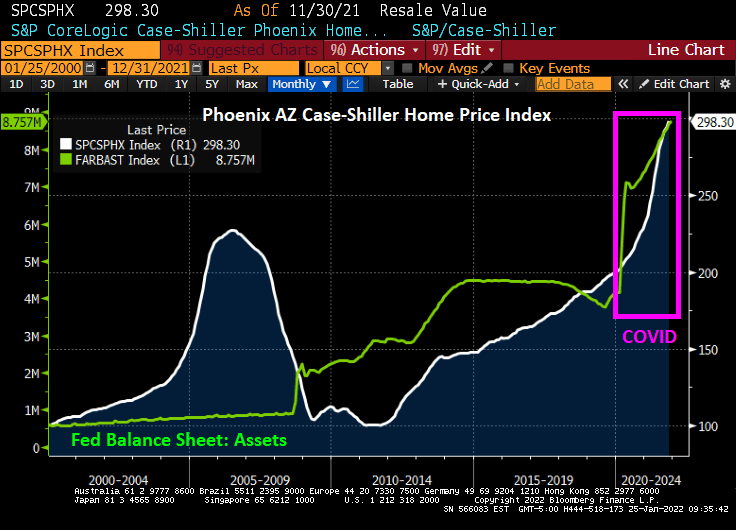
The Case-Shiller National home price index “slowed” to 18.81% YoY in November as The Fed continues its monetary stimulypto. Notice that The Fed is easing even when there is limited inventory available. Result? Hideous home price inflation.
Which metro area is growing the fastest, making housing even more unaffordable for renters? Phoenix AZ is growing at a 32.2% YoY clip while Washington DC is the slowest growing metro area at 11.1% YoY. The second faster growing metro area in Tampa FLA.
Phoenix AZ is growing at the fastest rate in the nation as The Fed still has its monetary stimulus at FULL SPEED AHEAD.


You must be logged in to post a comment.