Stimulypto! How The Federal Reserve Helped Drive Property Taxes Above $10,000 In New York City (NYC Home Prices UP 26.3% Since February 2020, Chicago UP 21.7%, LA UP 32.5%)

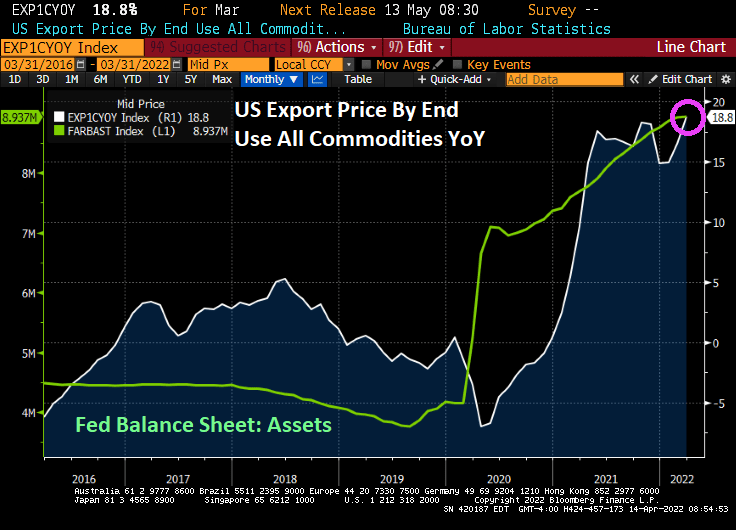
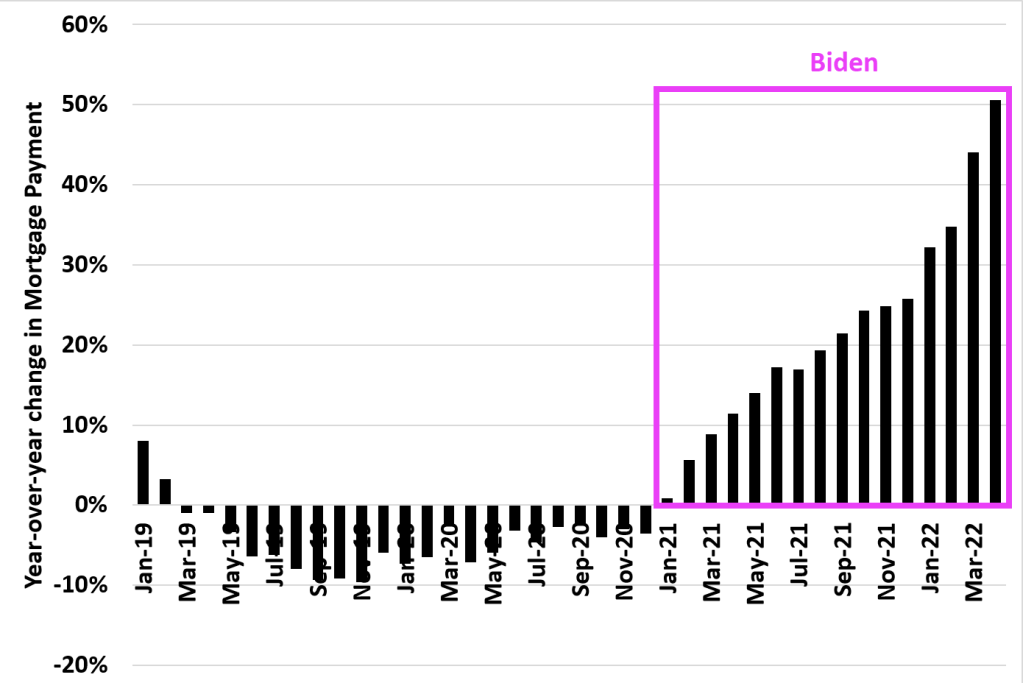
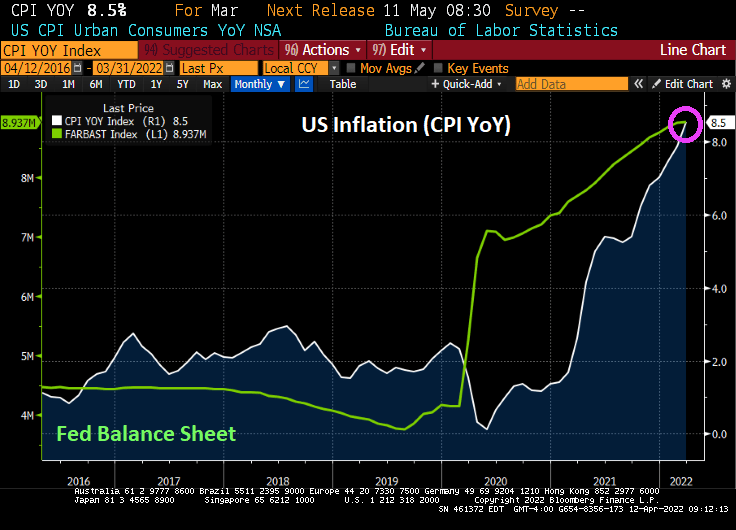
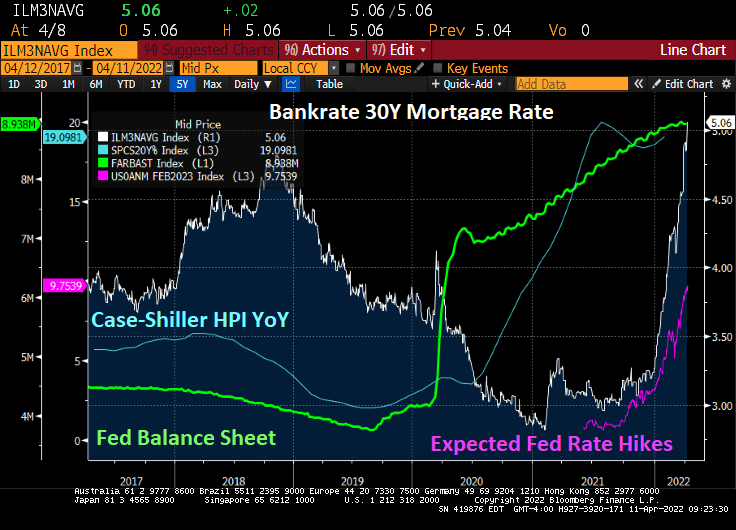
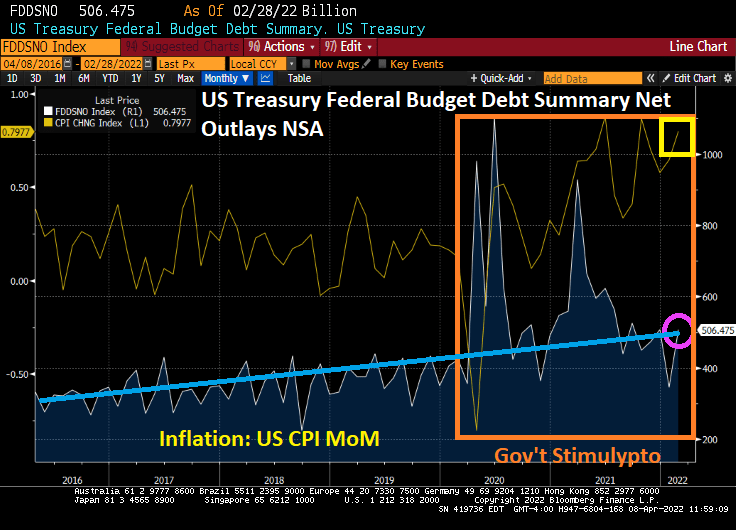
As we are all aware, The Federal Reserve launched its monetary “stimulypto” in March 2020 to combat the Covid virus. Coupled with the surge in Federal stimulus, we have seen home prices rise over 20% since February 2020.

Specifically, New York City home prices are up 26.3% since February 2020, Chicago home prices are up 21.7%, and Los Angeles home prices are up 32.5%. Fed monetary stimulypto is up 113% since February 2020.

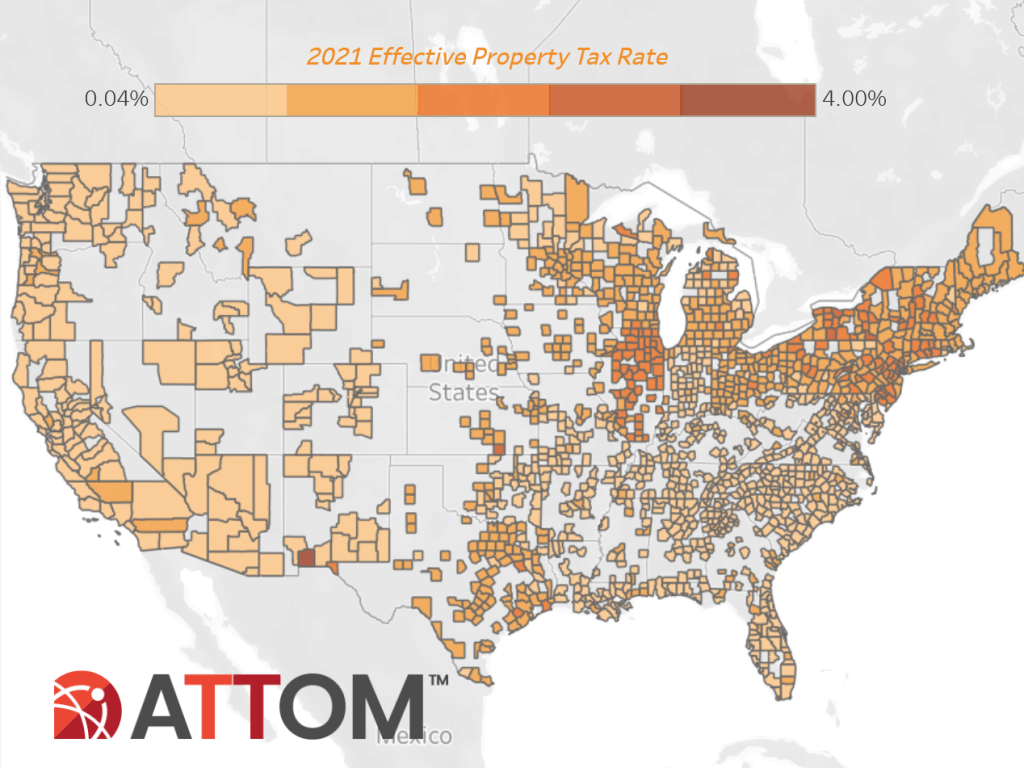
Of course, this has resulted in soaring PROPERTY TAXES as well. According to Attom Data Services,Among 1,481 U.S. counties with at least 10,000 single-family homes in 2021, 16 had an average single-family-home tax of more than $10,000, including 12 in the New York City metro area. The top five were Kings County (Brooklyn), NY ($13,734); Marin County, CA (outside San Francisco) ($13,719); Westchester County, NY ($13,674); Essex County, NJ ($13,116) and Nassau County, NY ($13,095).”

Of course, not all metro areas raised their property taxes. Major markets with the largest decreases in average property taxes included Pittsburgh, PA (down 35.1 percent); New Orleans, LA (down 20.2 percent); Houston, TX (down 18.7 percent); Dallas, TX (down 12.2 percent) and Austin, TX (down 7.7 percent).

States with the highest effective property tax rates in 2021 were Illinois (1.86 percent), New Jersey (1.73 percent), Connecticut (1.67 percent), Vermont (1.55 percent) and Pennsylvania (1.37 percent).

Even if The Federal Reserve removes its massive monetary stimulypto (MMS), property taxes will remain elevated unless cities reduces their property tax rates. But Democrat-controlled cities tend to be addicted to spending much like The Federal government.

You might as well face it, they’re addicted to gov.

Panic In (Fed) Needle Park! Mortgage Purchase Applications INCREASE Despite Rapid Rise In Mortgage Rates (FEAR Of Further Fed Taking Away Punchbowl)

Today, the US Treasury 10-year yield exploded upwards by over 12 basis points. With it, the 30-year mortgage yield is above 5%. And MBA Mortgage Purchase Applications are actually increasing.

Today’s bond market summary shows the 10-year Treasury yield up 12.7 basis points. Its the same all over the western world. Asia? Not so much.

Fear of further Fed fireballs coming from removal of the monetary punchbowl.

UMich Buying Conditions For Housing Remain Depressed As Mortgage Rates Continue To Rise (Thanks A Boatload, Powell!)

Mortgage interest rates continue their meteoric rise (along with home prices), the result of which is a tanking of consumer confidence in home buying.

The University of Michigan survey of consumers about buying conditions for housing remains depressed due to rising mortgage rates and surging home prices.

Bankrate’s 30Y mortgage rate is down slightly today to 5.06% as the 2-year Treasury yield declines and the anticipated rate hikes have fallen to 9.19.

As I mentioned earlier, mortgage credit availability hasn’t recovered from the “Covid Correction.”

Going Down! Export Prices Rise To 18.8% YoY (Highest In History) While Import Prices Rise To 12.5% YoY (Mortgage Credit Availability Plunge With Covid)

Like what Freddie King sang (Going down), we are going down the drain.

Export prices by end us YoY is up to 18.8%, the highest in recorded history (or since 1983 when they started recording export prices).

Import prices by end use rose to 12.5% YoY.

Unrelated to US export and import prices, the MBA’s mortgage credit availability index slumped with the Covid outbreak and the explosion of The Fed’s Balance Sheet. As I have said before, nothing has been the same since Covid.

Like Freddie King, “I’m Feeling Torn Down” by rising prices.

PPI Final Demand Prices Highest In History As 2Y Treasury Yield Declines, Mortgage Rates Steady At 5.14% (All Roads Lead To … Joe And Jay)

Harry Truman once uttered the phrase “The buck stops here.” Joe Biden’s catchphrase should be “It’s Russia’s fault!”

Well, all roads led to Joe and Jay. Here is a chart of Producer Price Index (Final Goods) prices YoY, now the highest in history. At least, gasoline prices are declining to $4.083 (they were $2.40 when Biden was installed as President). But inflation is out of control and the 30-year mortgage rate is now 5.14% (mortgage rates were 2.82% in February 2021 just after Biden took control).

Just in case you wonder why I follow Fed Funds Futures data so closely.

Equity markets are up strongly today as markets sense a weakening in resolve by The Federal Reserve (number of expected rate hikes dropped at 10AM EST).

It appears that we have a “Powell in the headlights” problem.

Inflation Nation! Real Average Weekly Earnings Growth Lowest Since 2007 (-3.6%) While Mortgage Payments UP 50% (US Treasury 2Y Yield Dumps 12 Basis Points)

Feeling hot, hot, hot! Inflation, that is.

US real average weekly earnings growth YoY is down to -3.60%. That is the lowest since 2007 and is worse than The Great Recession and financial crisis of 2008.

And look at this chart of mortgage payments under Biden. The US was actually experiencing DECLINING mortgage payments YoY in 2019 and 2020. But under Biden’s leadership, mortgage payments have increased by 50% making housing even MORE unaffordable for the middle class and lower-income households.

And now for something kind of scary. The US today suffered a 12 basis point decline in the 2-year Treasury yield, generally a bad sign for the economy. As if we needed more bad news for today.

Highest inflation in 40 years, worst wage growth since 2007 and rising mortgage payments. We will need all the luck we can get.

Bidenflation SOARS To 8.5%, Real Average Hourly Earnings Growth Falls To -3% YoY, Mortgage Rates Rise To 5.14% (The Four Horsemen Of The Inflation Apocalypse?)

The US inflation numbers were released this morning and they are grim. Inflation YoY grew to 8.5%.

With 8.5% YoY inflation, REAL average hourly earnings growth fell to -3% YoY.

And with The Fed intent on extinguishing their part of the inflation, Bankrate’s 30Y mortgage rate rose to 5.14%.

Energy is the biggest culprit (fuel oil up 70.1% YoY) thanks to the double whammy of 1) Russia’s invasion of Ukraine and 2) Biden’s restrictions on oil and natural gas production. Food at home is up 10% YoY.

Here is a colorful chart of MoM growth in prices.

The Taylor Rule model now says that The Fed Funds Target Rate should be 11.90%. Hence, Fed Stimulypto is still in place with the signal that rates will increase.

How about WTI Crude and Brent Crude soaring over 4% today?

Once again, the Four Horsemen of the Inflation Apocalypse (Biden, Powell, Pelosi, Schumer) overstimulated the economy and financial markets with excessive monetary stimulus (Powell) and excessive Federal spending (Biden, Pelosi, Schumer) where demand soared for products and supply naturally hasn’t caught up.

Addicted To Gov! 40-year Mortgage Proposal And How Government Makes Housing Unaffordable (Declining Real Wage Growth And Rising Mortgage Rates = Bad News)

The housing and mortgage markets are addicted to gov.

MarketWatch had an interesting piece on mortgages entitled “Here’s how much a 40-year mortgage would save you each month vs. a 30-year loan. And the ultimate cost.”

To make a long story short, a 40-year mortgage, by stretching the payment out from 30 to 40 years, means that the mortgage mortgage payment declines from $1,687 to $1,504.

Given that the US Treasury yield curve only goes out to 30 years, lenders (and Fannie Mae and Freddie Mac) will have to use the US Dollar Swaps curve to price mortgages. And since the swaps curve is downward sloping, we could see 50-year mortgages at a lower rate than 30-year mortgages, ceteris paribus.

But with The Fed planning on taking away the monetary punchbowl, mortgage rates are rising making housing even more unaffordable.

But most things are not equal. The 40-year mortgage results in a slower paydown of the mortgage, increasing the lender’s exposure to property value declines. A 50-year mortgage would even be worse.

But the real problem with the 40-year mortgage is that it can lead to even MORE unaffordable housing. Yes, going from 30-year to 40-year mortgages lowers the mortgage payment, but a 40-year mortgage could increase the demand for housing. And since we already have soaring home prices since Covid (thanks to Fed monetary policy AND Federal government stimulus), we could actually see a worsening of the housing bubble). Particularly since REAL average earnings are declining.

What a mess that has been created by the government’s pursuit of “affordable housing.” Ideally, the Federal government could help raise household earnings through lowering of Federal tax rates, but the Biden Administration wants to raise taxes. Alternatively, lenders (and Fannie Mae and Freddie Mac) could lower lending standards (e.g., lowering required credit scores), or reduce downpayments to 0%. Lowering credit standards and reducing required downpayments are also inflationary and pose serious potential problems with default risk.

Not to mention that a 40-year mortgage increases the duration risk for owner’s of the 40-year mortgage.

And don’t forget that local governments frown on multifamily (apartment) construction (the Not In My Backyard [NIMBY] problem contributing to rising housing prices.

Yes, the US has a bad case of unaffordable housing. And the 40-year mortgage will make it worse.

T-Dazzle! Inflation Crushing Households Under $60k, Russian CDS Indicating 99% Probability Of Russia Debt Default Over Next Year (WTI Crude UP 2%+, Wheat UP 3%+)

As we are painfully aware, The Fed’s exaggerated monetary flood combined with Federal stimulus spending has led to horrible inflation.

Yes, despite what government talking heads say, Federal stimulus increases demand for goods, the supply is generally slow to respond resulting in rising prices. Then government policies driving up energy prices also leads to highers prices. Throw in Federal Reserve monetary stimulypto and we have this chart from hell from Penn-Wharton. The chart shows that households earning less that $60,000 experience higher expenses due to rising prices than their gain in earnings.

Speaking of the government push to “go green” I saw an ad for a Mercedes Benz EQ sedan that I admit looked really cool, but no price given. I went to Car and Driver’s website and it said “Starting at $103,360.” I’ll take a hard pass, but you can see why households making over $150,000 per year have rising additional expenses due to price increases. To paraphrase April Ludgate, “Thanks for nothing President Biden and Fed Chair Powell.”

Another chart from hell is the Russian USD Credit Default Swap (CDS) curve. It is spiking at over 20,000.

The one-year Russian CDS is currently at a whopping 20,336 indicating that there is about a 99% of a Russian default over the coming year. As someone who lived through the 1998 Russian credit default scare on Wall Street, this will send a shock wave through credit and Treasury markets.

On the US Treasury front, this chart shows how steeply sloped the US Treasury actives curve has become. Steep until 3 years, then flat. I call this chart “T-Dazzle!” T-Dazzle because I can’t believe how badly the Biden Administration and The Federal Reserve are screwing up the country.

Crude oil? WTI Crude is back to almost $100 per barrel while Brent Crude is at $102.78 per barrel. Wheat is up 3.22% thanks largely to problems related to Russia invading Ukraine (Europe’s bread basket) and a dismal Chinese wheat harvest.

Cryptocurrencies, the alternatives to the US fiat dollar, are rising (in particular, Bitcoin and Ethereum).

Of course, I have to finish up with the soaring 30-year mortgage rate.

Here are Treasury Secretary Janet Yellen and Transportation Secretary Pete Buttigieg trying to convince people that Treasuries are fantastic and to avoid alternatives to fiat currency like Bitcoin, Ethereum, Stablecoin or anything else.

Can The Fed ACTUALLY Tighten Monetary Policy? Or Is This ANOTHER Fed Policy Error? We’ve Got A BAD Case Of Unaffordable Housing

Can The Federal Reserve ACTUALLY tighten monetary policy? Let’s look at the facts.

Under Biden, we have seen inflation rise from 1.4% to 7.9% (the latest inflation numbers will be out Monday). And we have seen Treasury public debt rise from $27.8 trillion to $30.346 trillion (actually, $30.371 trillion in real-time). Meanwhile, REAL average hourly earnings are declining. Well done, Washington DC! You deserve the Washington Redskins Commanders.

With real GDP growth less than 1%, a war raging in Ukraine, and 20% flexible price growth, the US economy is in a shambles, relying on The Federal government and The Federal Reserve to continues its insane level of spending and stimulus.

I am going against the box on this one and think The Fed will back off by summer when they realize that they have made another in a long line of policy errors.

Doctor, doctor (Yellen, US Treasury Secretary), we’ve got a bad case of UNAFFORDABLE HOUSING thanks to BAD government policies.