Its Saturday and I am dreading markets opening on Monday. But here is where we sit today.
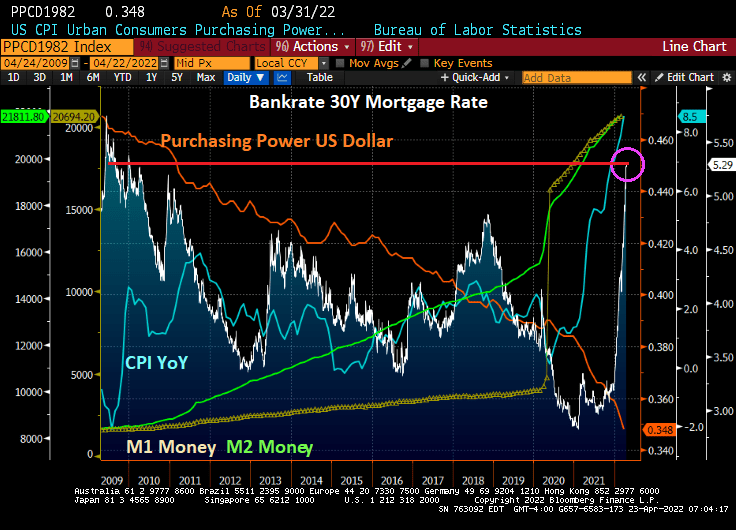
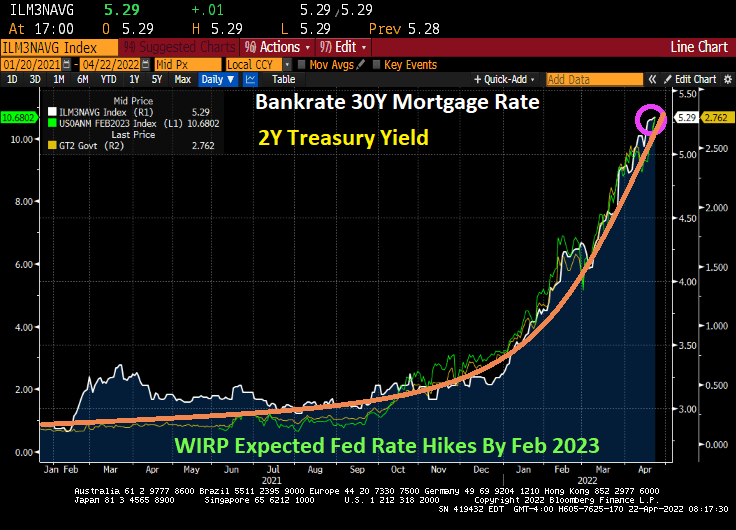
The 30-year mortgage rate has soared to 5.29%, the highest level since 2009 at the beginning of Obama’s Presidency. Since 2009, we have seen the purchasing power of the US Dollar decline further (orange line) while inflation (blue line) has soared. M1 (yellow) and M2 (green) has been growing since the financial crisis, but really took-off with the Covid outbreak in 2020 and The Fed’s massive overreaction coupled with Federal government stimulus.
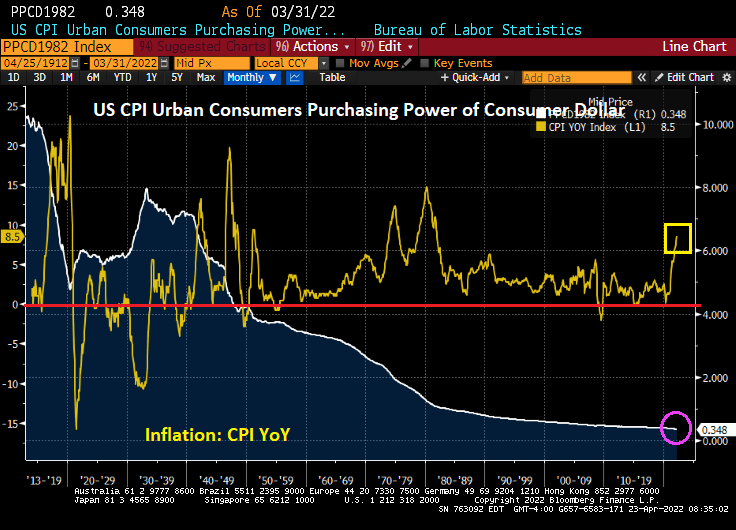
Since the creation of The Federal Reserve System under President Woodrow Wilson, the purchasing power of the US Dollar has collapsed so much that $10 in 1913 in worth 34.8 cents today. But notice that since 1949, the CPI YoY has rarely been negative meaning that prices are pretty much only going up.
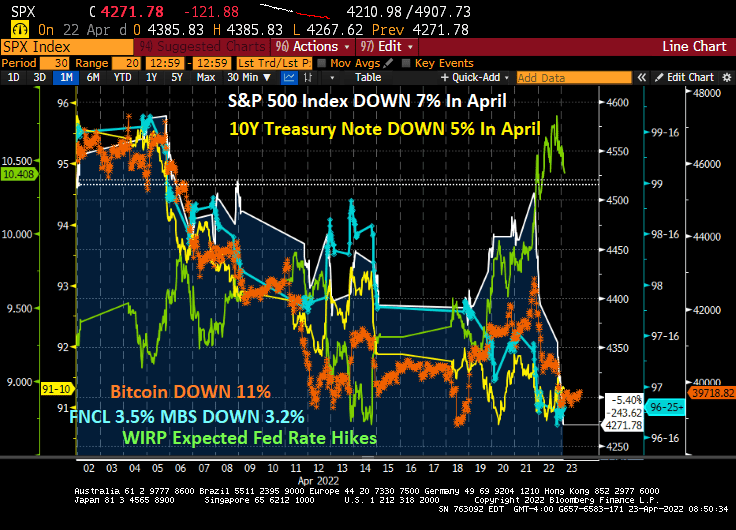
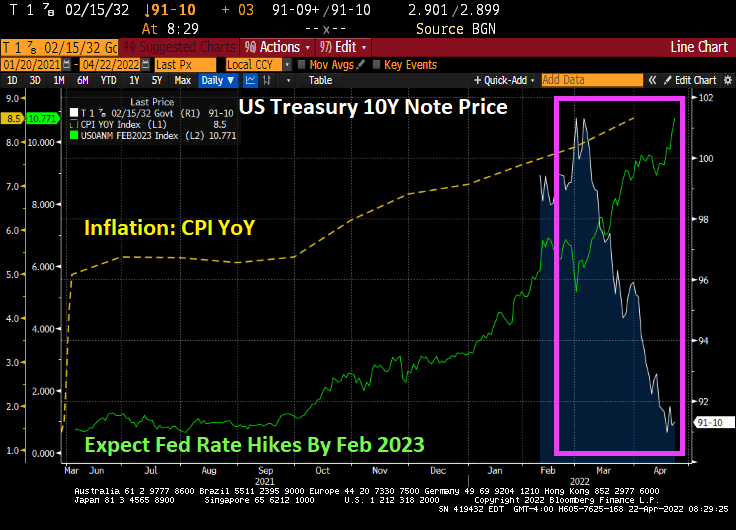
Instead of April showers bring May flowers, it is April expected Fed rate hikes (now 10.408 rate hikes by February 2023) bringing declining assets prices. In April so far, the S&P 500 index is DOWN 7%, the 10-year Treasury Note price is DOWN 5%, Bitcoin is DOWN 11%, the 3.5 coupon agency MBS price is down 3.2%.
We are seeing increased volatility in both the equity and bond markets.
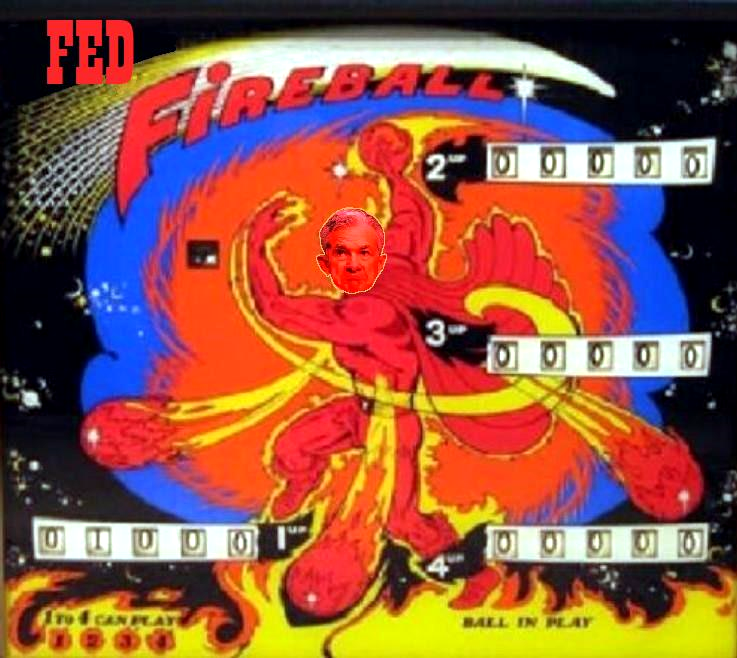
Well, Powell and The Fed are hurling fireballs at mortgage rates and asset prices in April.
US President Biden went green and signed executive orders on his first day to limit oil and natural gas exploration of Federal lands and offshore (also, killed the Keystone Pipeline), helping to drive up energy prices and food prices. These orders begat inflation (also caused by the massive Covid relief by the Federal government). The highest inflation in 40 years begat The Federal Reserve signalling a tightening of Fed monetary policy … to fight the problem caused by The Fed in the first place … too much monetary stimulus for too long. Fiscal and monetary fanaticism and ignorance is forever busy and needs feeding
There was an interesting article on MarketWatch entitled “Bond rout exposes Social Security’s insanity.” The headline was “Every dollar of yours that’s invested in the Social Security trust fund is invested in low-yielding government bonds.”
Yes, another disastrous consequence of The Fed’s lax monetary policy since 2008, helping to push Treasury yields extremely low. And REAL Treasury yields into negative territory.
But here we sit today with The Fed threatening to trim their balance sheet and raise rates … to combat the inflation they helped create in the first place. Now we have the 10-year Treasury Note price falling like a paralyzed falcon with expected hate hikes going above rate hikes by February 2023 (based on Fed Funds Futures prices).
Most pension funds also invest heaving in US Treasuries, along with agency Mortgage-backed Securities (AgencyMBS).
Under President Biden’s Reign of Error, inflation is the highest in 40 years. But Powell and The Fed are still overstimulating the economy, and Congress is contributing to the inflation disaster with short-sighted political policies and spending (flooding the economy with stimulus spending helping to drive up prices). Even Democrat US Senator Elizabeth Warren gets it.
Here is Biden’s inflation scorecard in one chart. Under Inflation Joe, foodstuffs are up 58%, gasoline is up 72%, diesel fuel is up 154%, and green energy element Lithium is up 645% (no wonder electric car manufacturer Telsa is raising their prices 10%). Of course, The Federal Reserve keeps on expanding its balance sheet, UP 50.3% under Inflation Joe.
House price growth is up 69% and the 30-year mortgage rate is UP 83.3% and currently is at 5.28%. The orange line is the growth path.
Yes, prices have risen even more after Russia Invaded Ukraine on February 24, 2022. But most of the inflation was baked-in prior to the Russian invasion. Sorry Jen Psaki, but you are wrong about inflation being all Putin’s fault.
The Covid epidemic was bad enough with the government shutdowns and deaths. But was even worse is that all the Fed monetary stimulus and Federal government stimulus “relief” led to a reversal of fortune. In that, the share of net worth held by the top 1% grew and the gap between the 1% and bottom 50% hit an all-time high.
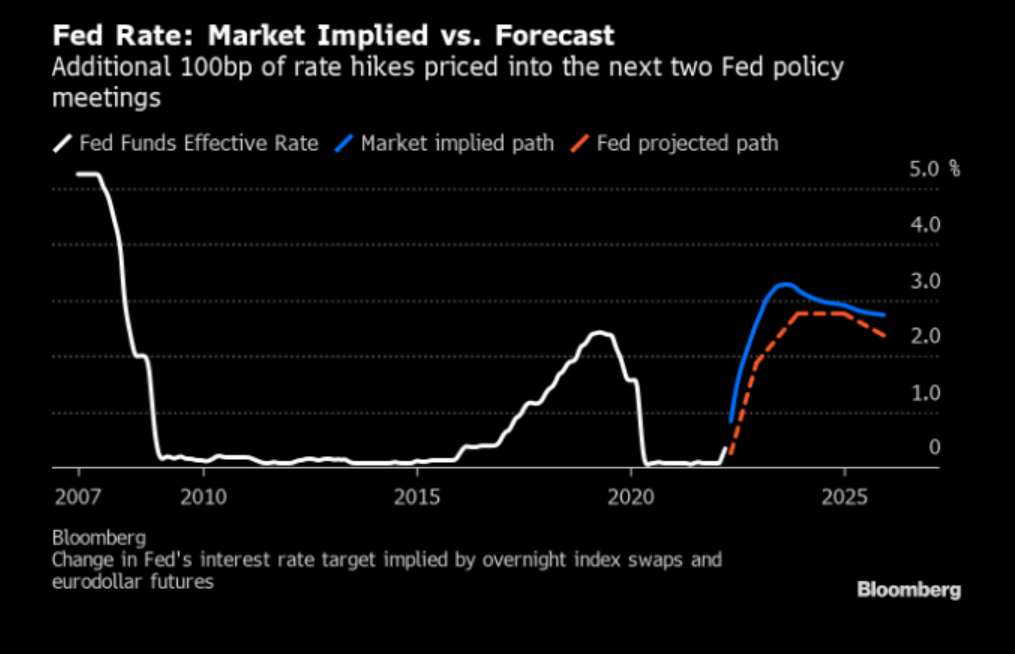
Now that the 1% have fed at the Federal trough, The Fed is anticipated to raise rates by 100 basis points at the next two meetings.
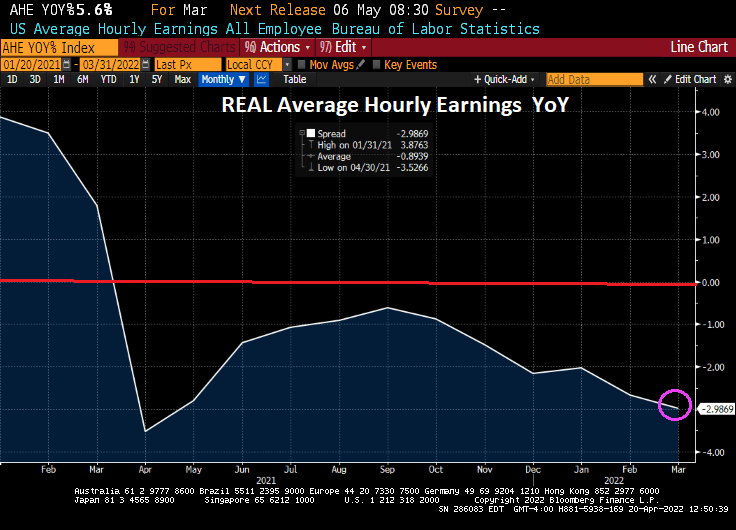
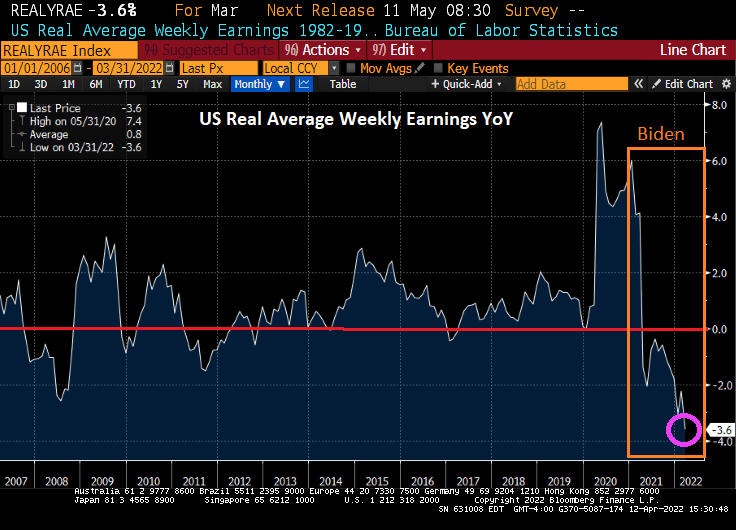
Remember, REAL average hourly earnings are getting crushed under Biden and his pro-1% policies.
This is a nightmare for the American middle-class and lower-wage households.
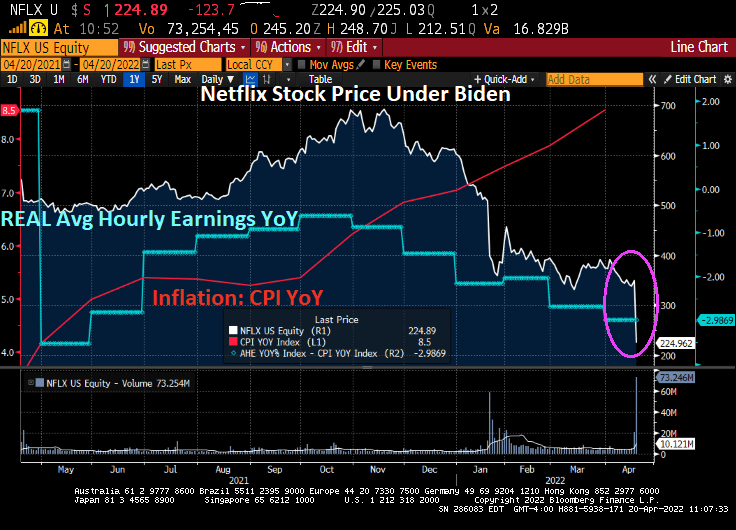
Netflix, the movie and TV show subscription service, suffered an extraordinary decline in its stock price. But like the film “Margin Call” that pretends the Lehman Brothers bankruptcy in 2008 was a surprise, it really is no surprise that Netflix is getting crushed. Why? Thanks to Bidenflation, millions of American households are suffering (REAL average hourly earnings are declining under Biden) and many of those were Netflix subscribers.
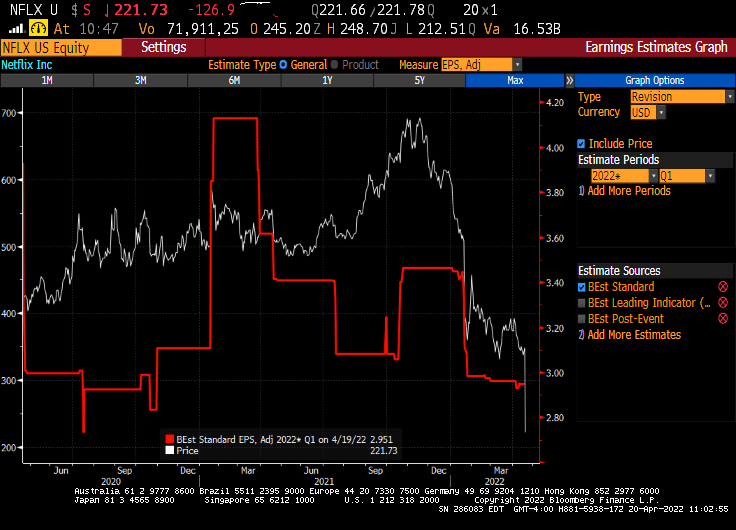
Netflix’ earnings per share soared when Biden was first installed as President, likely due to effects of Biden’s/Pelosi’s/Schumer’s Covid stimulus. But alas, fiscal stimulus is short-lived but the negative effects of inflation are long-lasting.
Inflation Joe, the bully of the middle class and low-wage workers. But at least millionaires will get more electric cars charging stations! /sarc
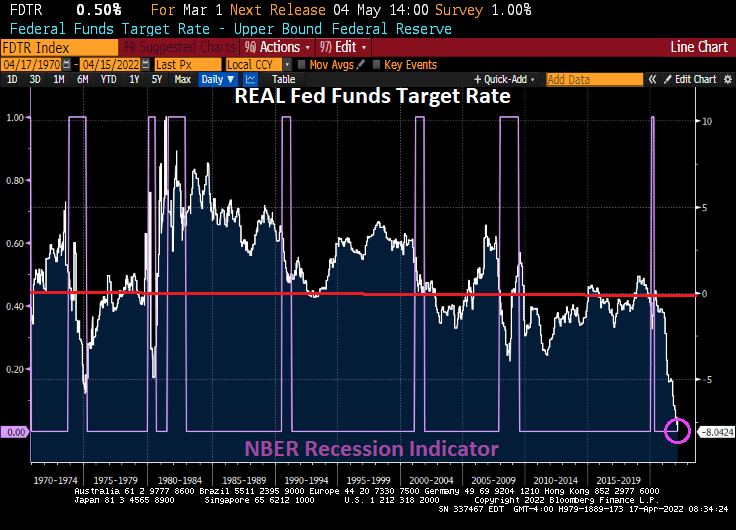
As inflation crushes the middle class and low wage workers, we see that the REAL Fed Funds Target Rate (based on headline inflation) is the lowest in history. Notice that the REAL Fed Funds Target Rate tends to hit its lowest negative reading DURING recessions, although The Fed has had a poor track record since the Dot.com bubble burst and the 2001 recession meaning that the REAL Fed Funds Target rate has been in negative territory (that is, the rate of inflation has exceeded The Fed Funds Target Rate for much of the post-2000 era).
The “good” news? Inflation caused by The Fed’s negative interest rate policy (NIRP?) has actually led to REAL home price growth to slow 11.6855% YoY, lower than the peak of the 2005-2007 house price bubble.
With The Fed’s OVERSTIMULATION of markets with historically low REAL Fed Funds Target Rate, we can see that the US unemployment rate is overheated (that is, below the Congressional Budget Office (CBO) Short-term Natural Rate of Unemployment. Yes, it appears that Slow Walking Fed Chair Jay Powell should be raising The Fed’s target rate AND removing (at least) the Covid monetary stimulus.
Inflation Joe is a career politician, so it is not surprising that he is trying to blame Russia for the horrid inflation in the US. However, inflation grew from 1.4% when Biden took office to 7.9% when Russia invaded Ukraine. The latest inflation report was 8.5%, so Russia is only partly to blame for rising prices since February 24, 2022. The rest is due to Inflation Joe, Slow Walking Jay and Congress.
Again, Congress helped drive prices through the roof by massive Federal spending (aka, Covid stimulus “relief”). Hence, the Four Horsemen of the Inflation Apocalypse is appropriate. And now Biden is once again pitching massive government spending (Build Inflation Back Better?).
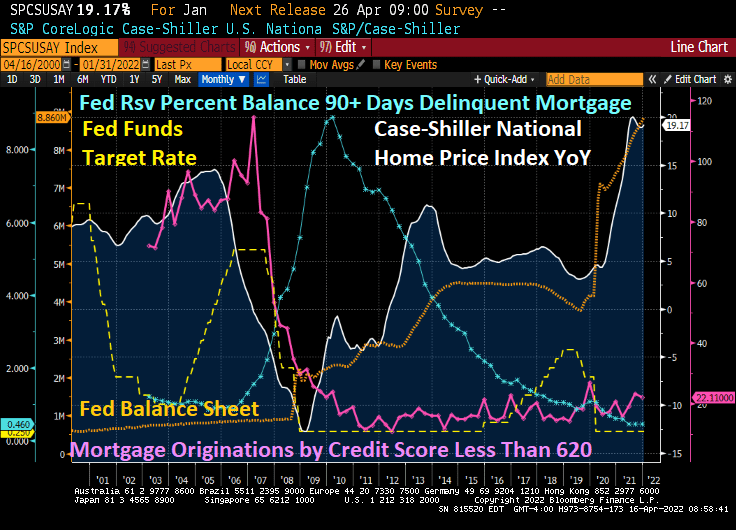
The book and movie “The Big Short” revolved around the 2005-2007 housing bubble driven by lending to borrowers with subprime credit (and little or no underwriting). As we know, Bear Stearns, Lehman Brothers and other investment banks too large positions in subprime asset-backed securities (SABS) that became highly toxic once the demand for high-yield subprime ABS dried up. The decline in US home prices coupled with soaring 90-day mortgage delinquencies led to the failure of Bear Stearns and Lehman Brothers along with Fannie Mae and Freddie Mac being put into conservatorship by their regulator.
Fast forward to today. Mortgage originations by credit scores of 620 or less have shriveled while home price growth YoY is even higher than the subprime mortgage crisis of 2005-2007. So, is the US facing another “Big Short” scenario? Yes and no.
The answer is no in that lenders have tightened their credit box sufficiently so that investment banks are no longer buying large quantities of subprime credit paper. The answer is yes if we consider that the current housing bubble is fueled by extraordinary monetary stimulus due to Covid (as well as rampant Federal government stimulus spending).
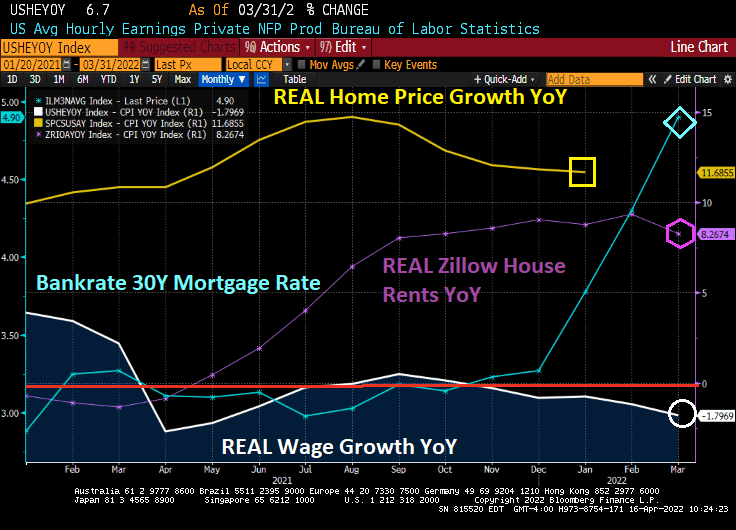
Following the Federal Reserve of Dallas’ lead, here is a chart of REAL home price growth YoY against REAL average hourly earnings YoY. I added REAL Zillow house rents YoY as well.
Look at the affordability gap during the Subprime Bubble of 2004-2006 and then the Fed Bubble of 2020 to today. Both bubbles show a disconnect between REAL home prices and REAL wages. REAL Zillow home rents are not as high as REAL home price growth, but still how a huge gap in rent affordability.
So, what can upset the apple cart? How about Jay and The Gang jacking up mortgage rates making home affordability even worse (unless it slows home price growth).
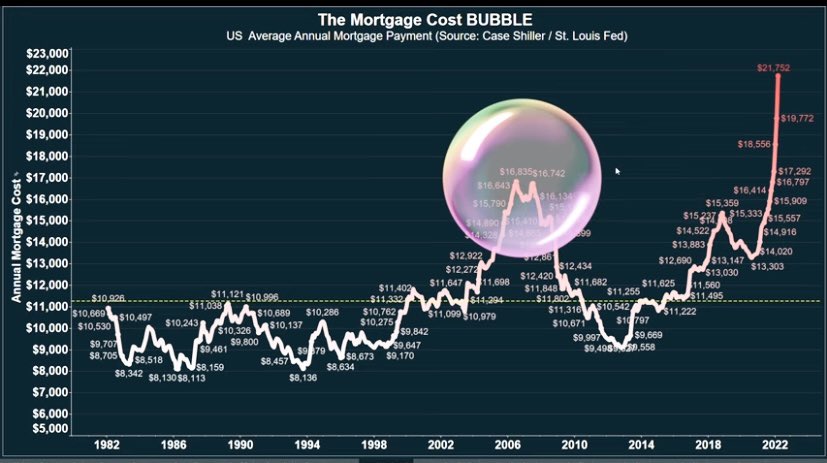
Thanks to The Fed’s propose quantitative tightening, mortgage rates are soaring and mortgage costs along with them. Mortgage costs, thanks to The Fed driving up housing prices AND mortgage rates, are substantially higher than during the subprime mortgage housing bubble.
The Fed’s whipsaw approach helped crash home prices during the subprime mortgage crisis by dropping rates too fast at first (helping to ignite a housing bubble) then raising rates too fast (helping to crash housing prices).
WASHINGTON (AP) — Long-term U.S. mortgage rates continued to climb this week as the key 30-year loan rate reached 5% for the first time in more than a decade amid persistent high inflation.
The average 5% rate on the 30-year mortgage was up from 4.72% last week, mortgage buyer Freddie Mac reported Thursday. The average rates in recent months have been showing the fastest pace of increases since 1994. By contrast, a year ago the 30-year rate stood at 3.04%.
The average rate on 15-year, fixed-rate mortgages, popular among those refinancing their homes, jumped to 4.17% from 3.91% last week.
Yet The Federal Reserve’s balance sheet keeps on growing.
The good news is that US industrial production rose 0.9% in March. The bad news? US capacity utilization rose to 78.3% indicating that the labor market is overheating.
Notice that prior to Covid, The Fed began rising raising its target rate as capacity utilization was increasing towards 80%. But once The Fed Funds Target rate (upper bound) hit 2.50%, capacity utilization started to cool off. Then Covid stuck.
Since Covid struck and The Fed massively expanded its balance sheet, capacity utilization has increased. But this time around, The Fed has been sloth-like in its removal of monetary stimulus.
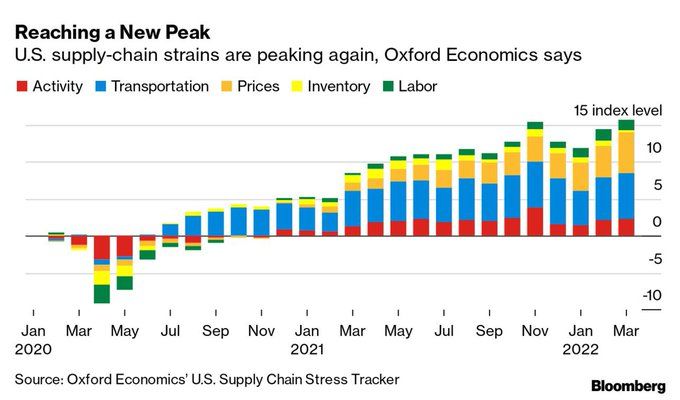
Of course, The Fed has been slow to cool inflation which is the highest in 40 years. And supply-chain strains are peaking again (isn’t Mayor Pete in charge of infrastructure?) This is helping to drive prices up.
And don’t forget that REAL average weekly earnings YoY are falling.
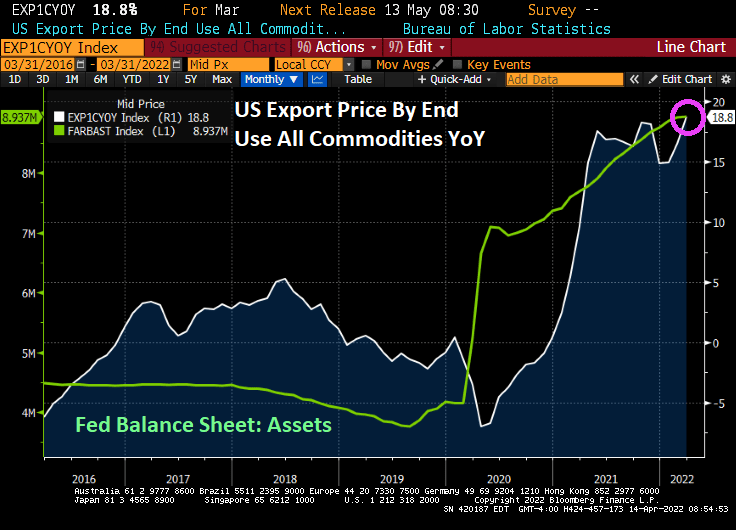
Export prices by end us YoY is up to 18.8%, the highest in recorded history (or since 1983 when they started recording export prices).
Import prices by end use rose to 12.5% YoY.
Unrelated to US export and import prices, the MBA’s mortgage credit availability index slumped with the Covid outbreak and the explosion of The Fed’s Balance Sheet. As I have said before, nothing has been the same since Covid.

















You must be logged in to post a comment.