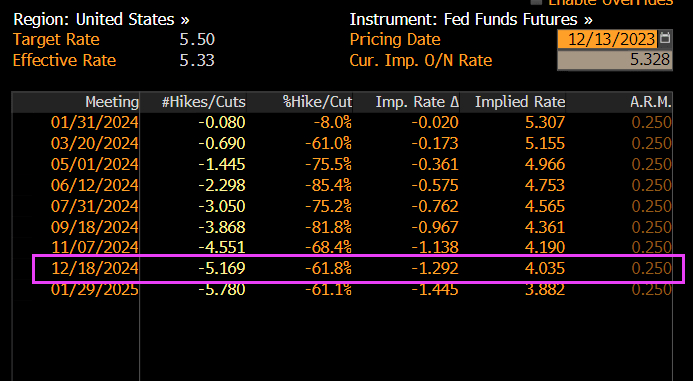
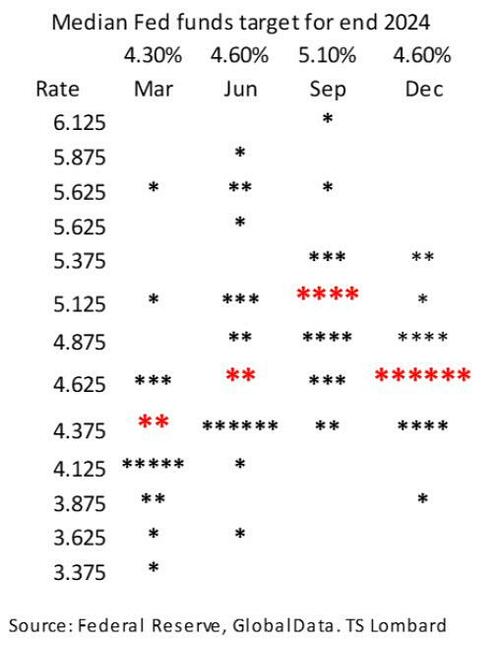
… it was the dot plot, where the median 2024 dot plot now forecasts 3 rate cuts up from 2, that shocked traders: in a very rare admission by the Fed, the central bank confirmed that the pre-meeting market pricing of multiple cuts in 2024 were correct in interpreting the Fed’s intentions. It also confirmed – yet again – that the market was right and every single FOMC member was wrong. In retrospect, none of this should have been a shock.
Commenting on the dot plot, TS Lombard’s Steven Blitz said that “for a group that prizes the pricing of its policy intentions in the forward markets as being more important to shifting market conditions than the spot rate, they h d to know that moving the median forecast for Fed funds at the end of 2024 back to June levels would be a bullish signal.“
Or maybe concerns about the market’s reaction were of secondary importance to a Fed which had gotten the tap on the shoulder by the Biden admin and its Democratic cronies on the Hill, terrified about their re-election chances now that the snake of Identity Politics is finally eating its poisonous tail. Indeed, almost as if having seen the collapse in the recent approval polls, Biden’s handlers made some very persuasive phone calls to the Fed. After all, only something as ridiculous – and serious – as steady political pressure can explain the unprecedented U-Turn by the Fed chair, one which even shocked Powell’s own mouthpiece, Nikileaks, who commented on the “Powell pivot” saying “what a difference two weeks can make.”
But markets are behaving as if The Fed will begin cutting rates. Look at the US 2-year Treasury yield on Wednesday AFTER the Fed minutes were released.
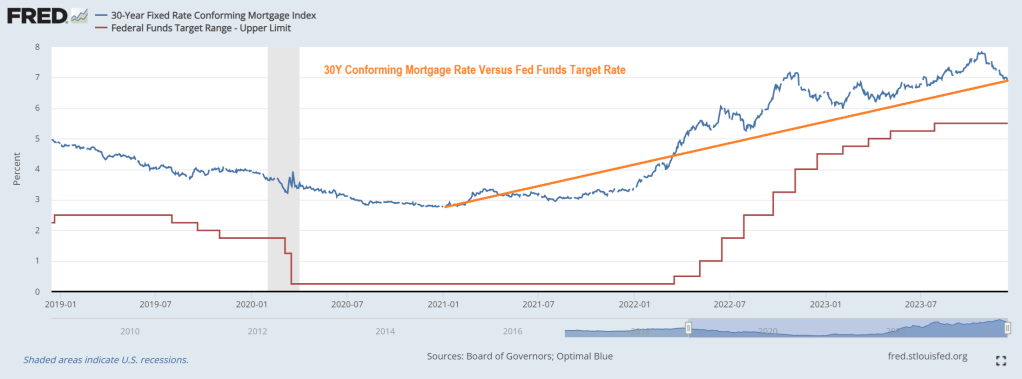
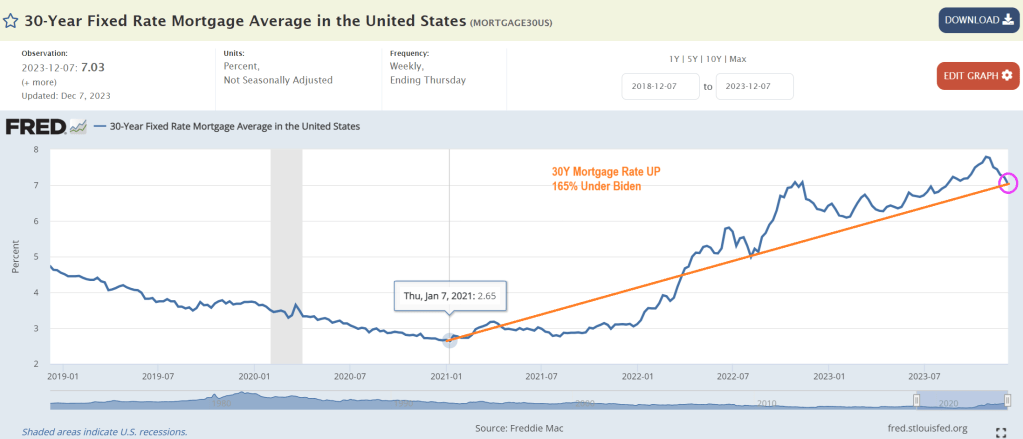
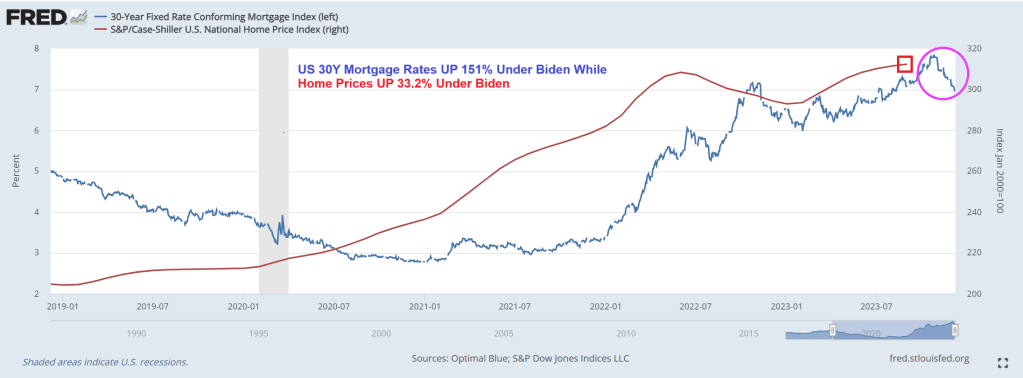
Bear in mind that mortgage rates are up 149% under Biden. And mortgage payments up 88%. Yikes!
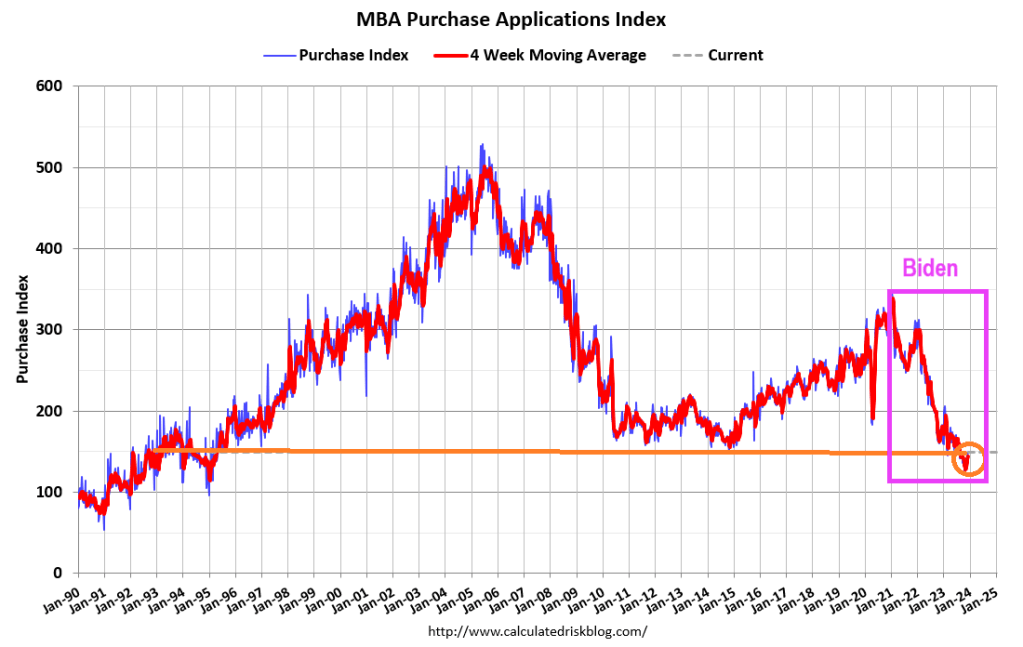
Mortgage applications increased 7.4 percent from one week earlier, according to data from the Mortgage Bankers Association’s (MBA) Weekly Mortgage Applications Survey for the week ending December 8, 2023.
The Market Composite Index, a measure of mortgage loan application volume, increased 7.4 percent on a seasonally adjusted basis from one week earlier. On an unadjusted basis, the Index increased 6 percent compared with the previous week. The seasonally adjusted Purchase Index increased 4 percent from one week earlier. The unadjusted Purchase Index decreased 1 percent compared with the previous week and was 18 percent lower than the same week one year ago.
The Refinance Index increased 19 percent from the previous week and was 27 percent higher than the same week one year ago.
The average contract interest rate for 30-year fixed-rate mortgages with conforming loan balances ($726,200 or less) decreased to 7.07 percent from 7.17 percent, with points decreasing to 0.59 from 0.60 (including the origination fee) for 80 percent loan-to-value ratio (LTV) loans.
And Freddie Mac’s 30-year mortgage rate is UP 165% under Biden.
Like WEF’s Klaus Schwab, Biden doesn’t want you to have a low rate mortgage for Christmas!
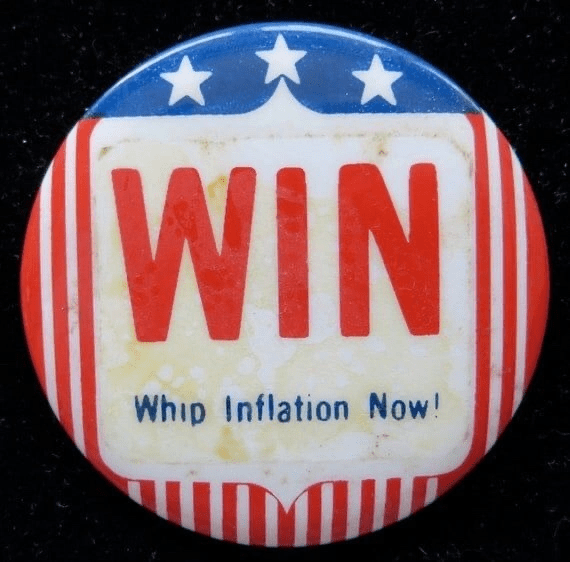
President Gerald For (R-MI) might be best known for his silly attempt at “whip inflation NOW” by having “Music Man” Meredith Wilson write a song: “Whip Inflation Now!” But the second line has been forgotten: “Eat crow instead of cow.” That second line is appropriate for Bidenomics which has left America’s middle class eating crow in the housing market.
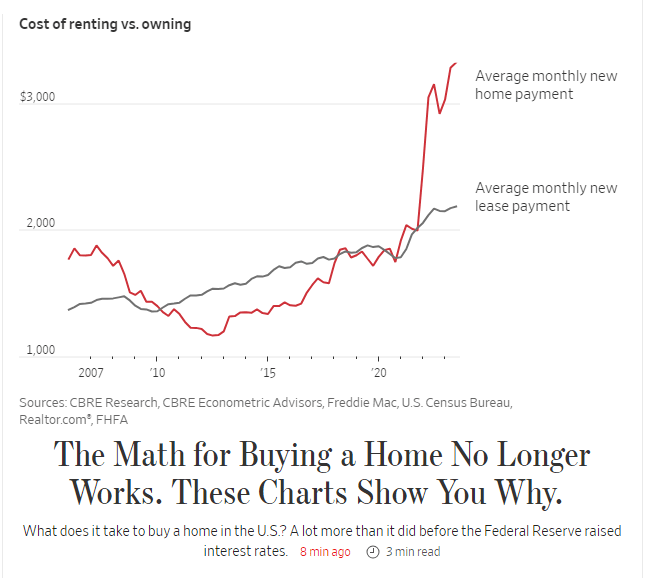
The Wall Street Journal had an interesting piece showing the rise of 30-year fixed rate mortgage payments under Biden where the average monthly new mortgage payment is now $3,222, up from $1,787, up 86%!
The 86% rise in mortgage payments is two fold. First, home prices are up 33.2% under Biden and the 30-year mortgage rate is up 181%.
Yes, Americans are eating crow under the utter failure known as Bidenomics: top down government mandates for massive green energy and other nonsense.
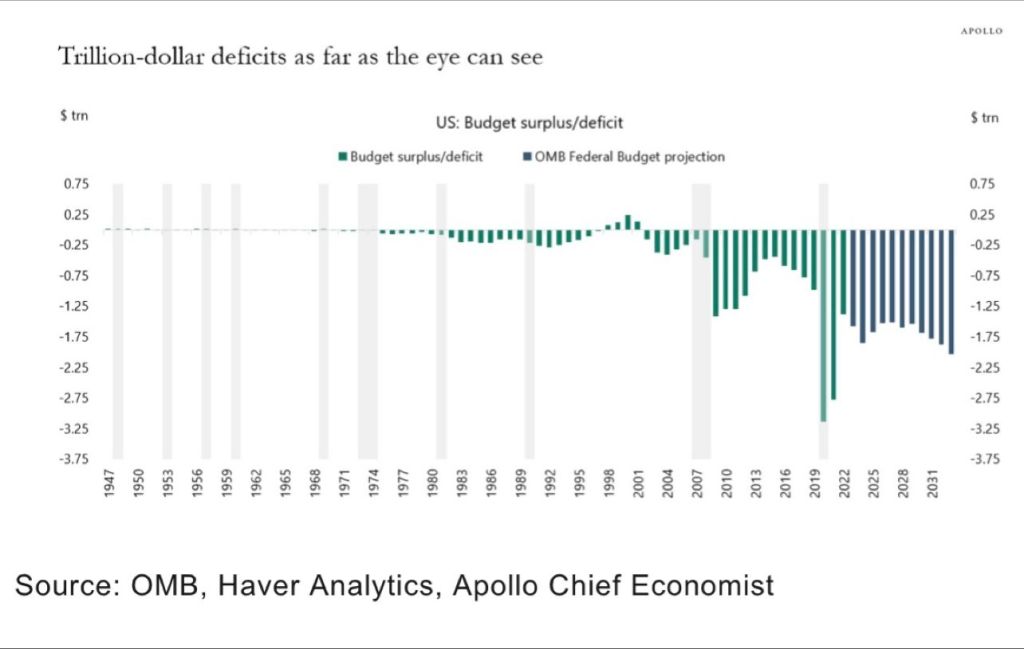
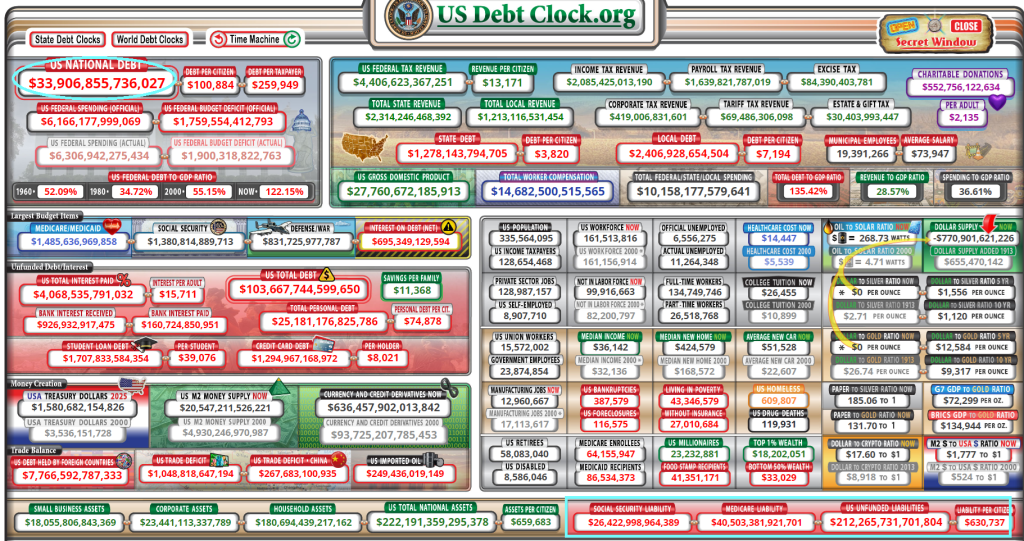
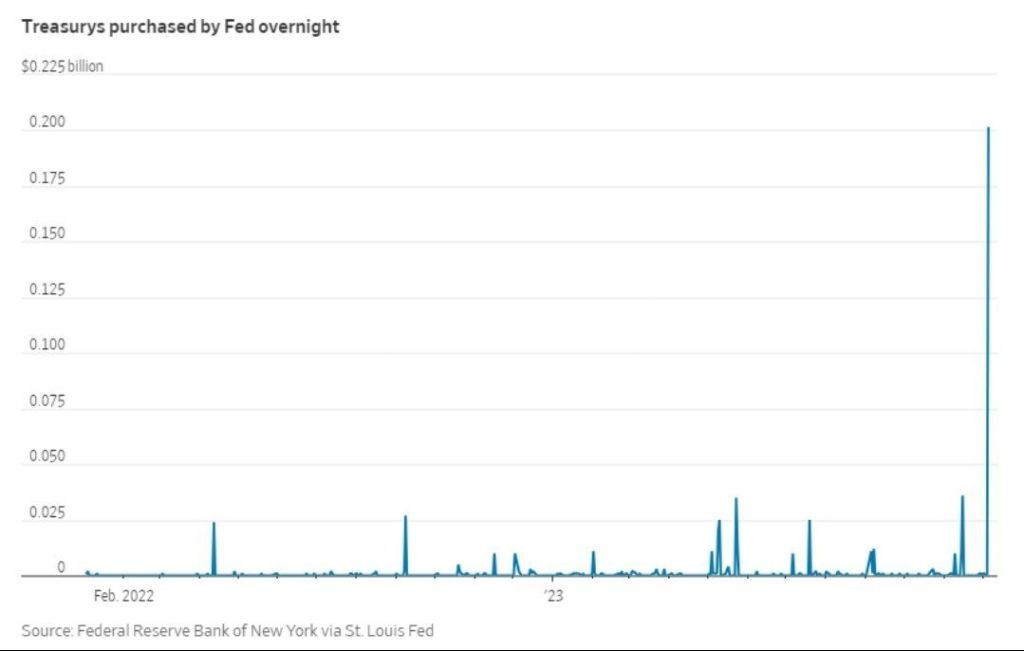
We are on a Highway To Hell! Massive Federal Budget deficits and staggering payments to Treasury from The Fed (losses on balance sheet) and $212 TRILLION in unfunded promises to the non-elites.
Under Modern Monetary Theory (or print money without consequences), we are seeing trillion dollars budget deficits with no end in sight. Nothing has been the same since the financial crisis of 2008 with The Fed’s massive intervention.
Then we have The Fed paying an ever growing amount to US Treasury for losses on their huge balance sheet.
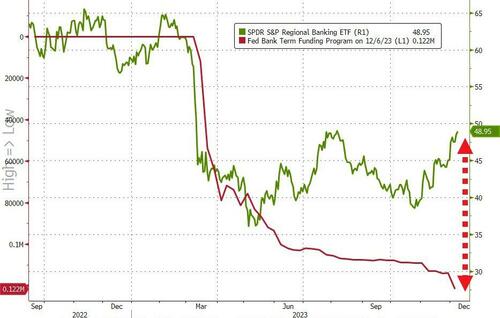
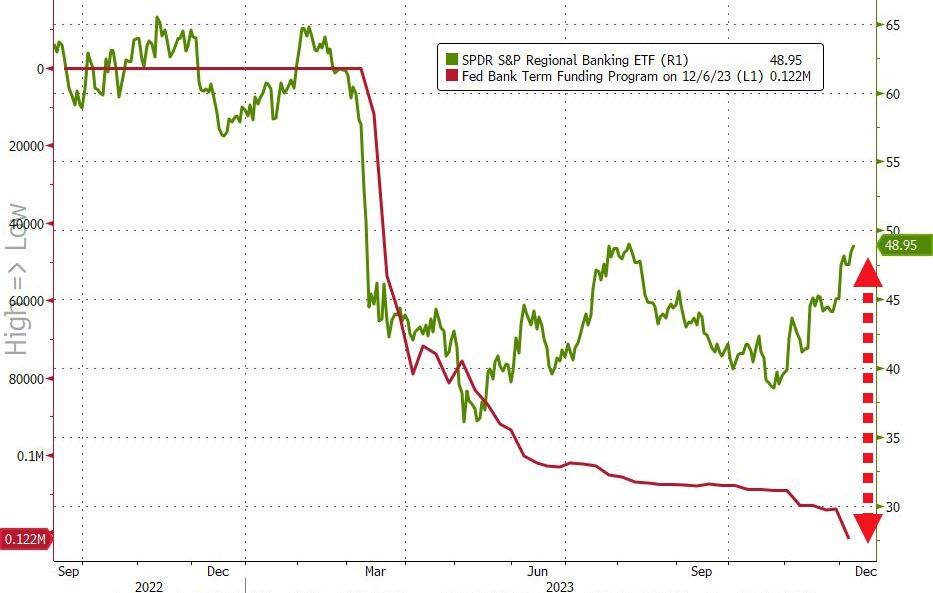
The song “Running on Empty” by Jackson Browne comes to mind when analyzing the state of American banking, especially regional banks.
Yesterday we found out that inflows to money-market funds continue to be huge ($290BN in six weeks), and more importantly, regional banks’ usage of The Fed’s BTFP bailout facility surged to a new record high (even as regional banks surged…
Source: Bloomberg
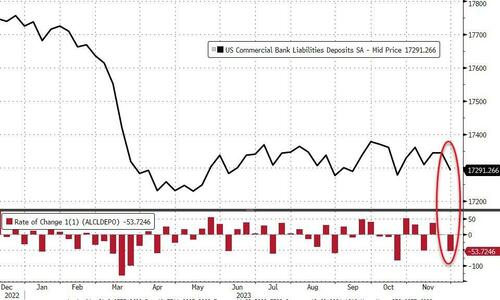
And so, with that shitshow in mind, we await the glorious manipulation of The Fed’s bank deposits data to reinforce that equity confidence.
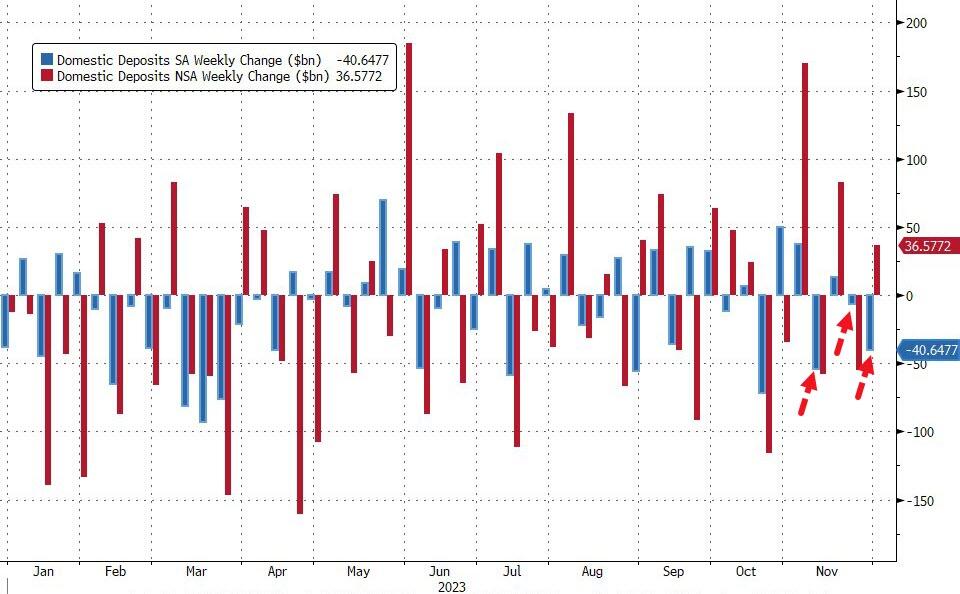
On a seasonally-adjusted basis, banks saw a $53.7BN deposit outflow…
Source: Bloomberg
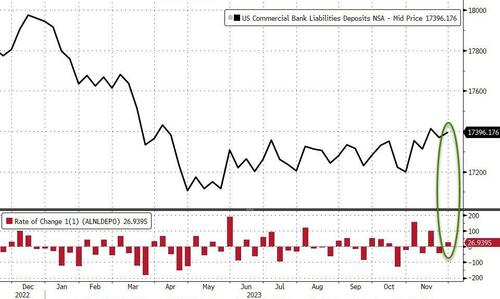
However, on a non-seasonally-adjusted basis, deposits rose by $27BN…
Source: Bloomberg
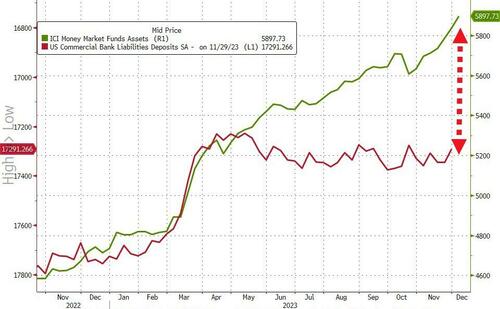
And even with the outflows (SA), the divergence between soaring money-market funds and bank deposits continues to widen…
Source: Bloomberg
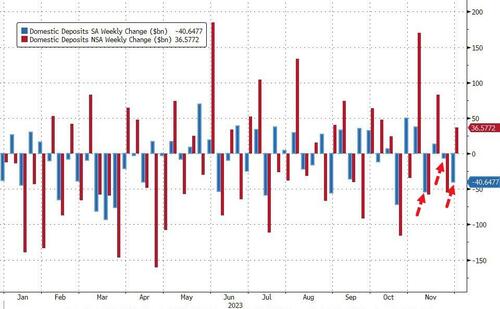
Excluding foreign bank deposits, domestic banks saw the third week of the last four of deposit outflows (-$40.6BN SA) with Large banks -$35BN (SA) and Small banks losing $5.7BN (SA). On an NSA basis, domestic banks saw inflows of $36.5BN last week with Large banks adding $32BN and Small banks adding $4BN…
Source: Bloomberg
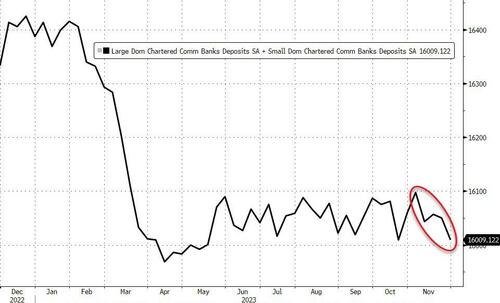
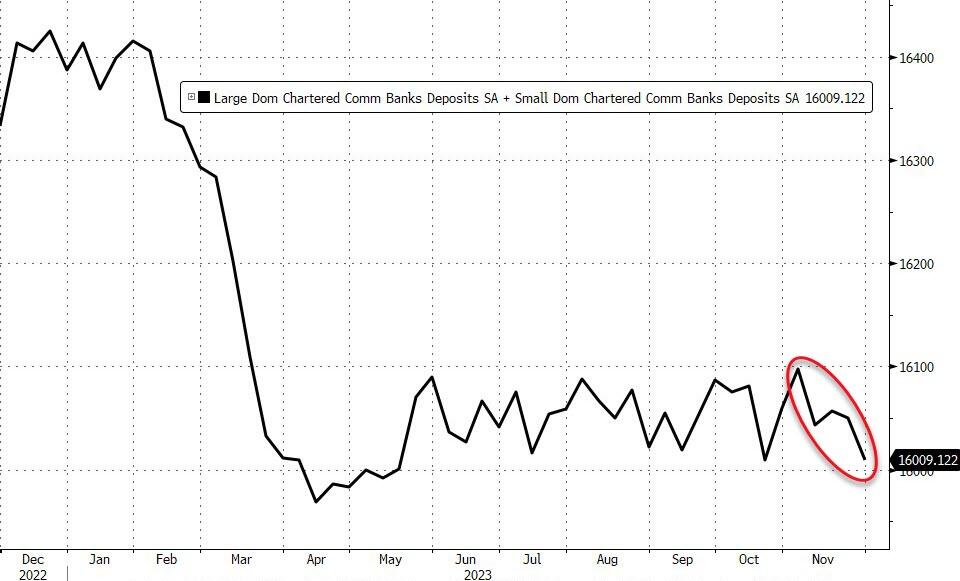
That adds up to $88BN (SA) of deposit outflows in the last four weeks (bank to its lowest total since May…
Source: Bloomberg
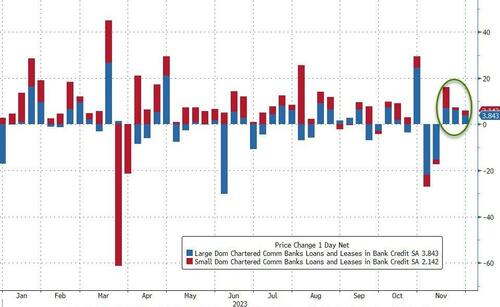
And on the other side of the ledger, despite deposits declining SA, loan volumes increased (SA) for the third week in a row with Small banks adding $2.1BN and Large banks adding $3.8BN…
Source: Bloomberg
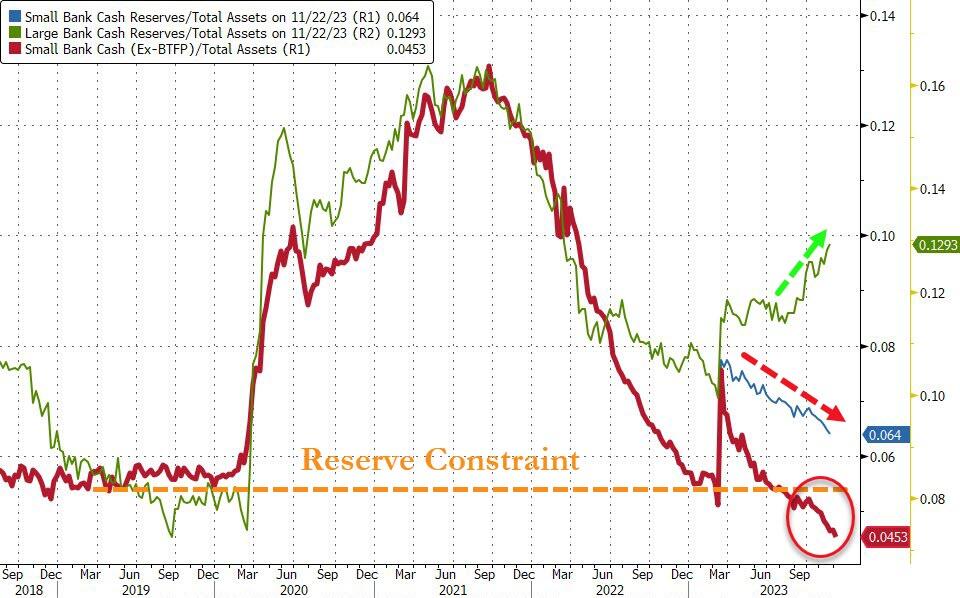
Finally, the key warning sign continues to trend ominously lower (Small Banks’ reserve constraint), supported above the critical level by The Fed’s emergency funds (for now)…
Source: Bloomberg
As the red line shows, without The Fed’s help, the crisis is back (and large bank cash needs a home – green line – like picking up a small bank from the FDIC).
Mortgage rates, despite coming down recently, are still up 151% under Biden. And home prices are up 33.2%. So much for affordable housing for those renting.
So, “Running on Empty” applies to middle class and their ability to afford housing.
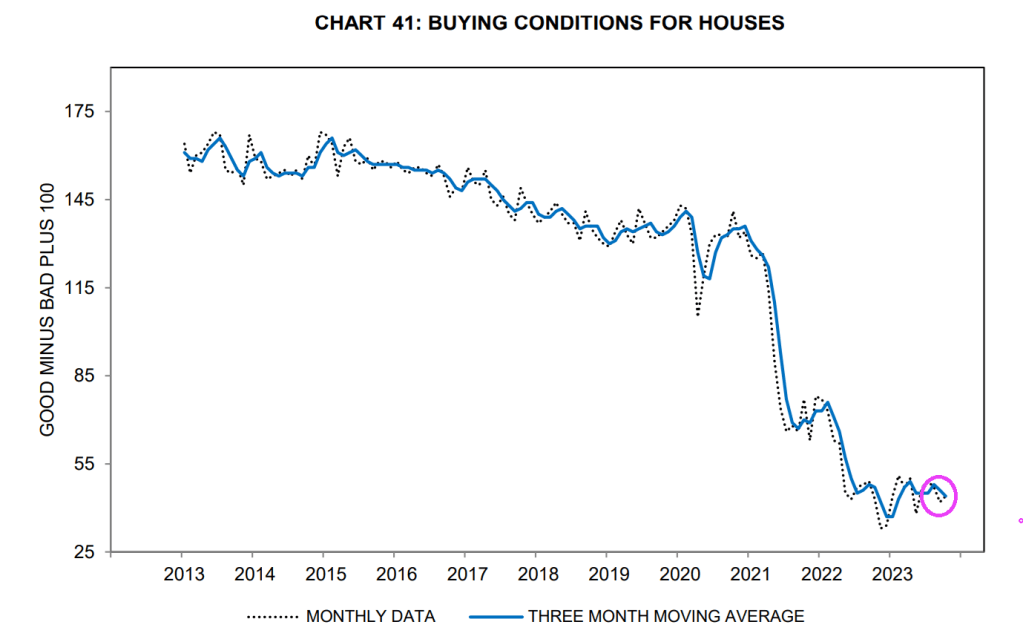
Why are buying conditions for houses so low? Well, mortgage rates, despite coming down recently, are still up 151% under Clueless Joe. And home prices are up 33.2% under Biden. So much for affordable housing for those renting.
Like the great Shoeles Joe Jackson on ChiSox and Cleveland Indian fame, Clueless Joe Biden cheated too. Except that Shoeless Joe was accused of accepting $5,000 to throw the World Series in 1919. Clueless Joe Biden and family are accused of accepting over $24 million from China, Ukraine, etc.
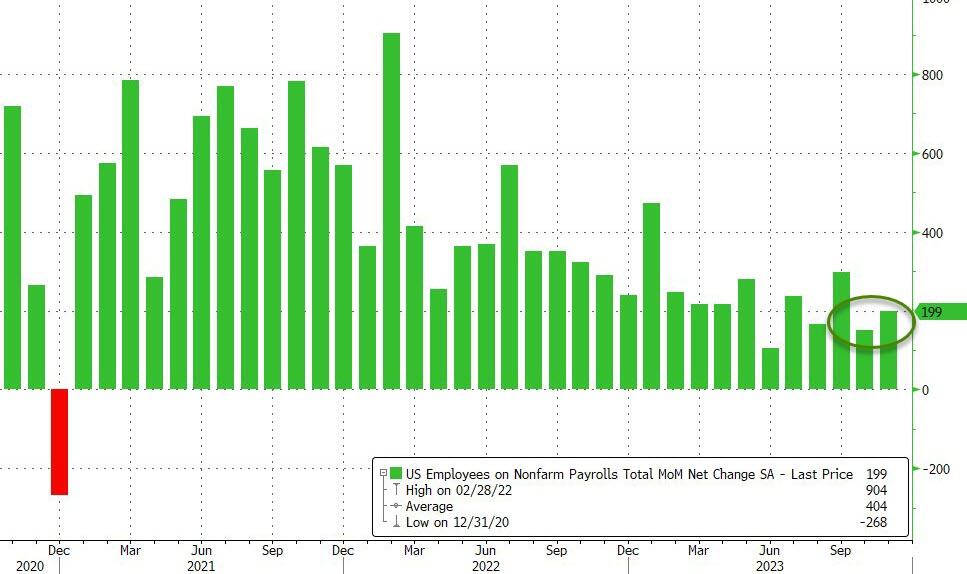
Several talking heads are salivating about the strong or solid jobs report in October. As if The Federal Reserve can’t read the jobs report. I call the report “Government gone wild!” since 51k government jobs were added in October.
Job gains occurred in health care, government, and social assistance. Employment declined in manufacturing due to strike actvity.
Total nonfarm payroll employment increased by 150,000 in October, below the average monthly gain of 258,000 over the prior 12 months. In October, job gains occurred in health care, government, and social assistance. Employment in manufacturing declined due to strike activity. (See table B-1.) Health care added 58,000 jobs in October, in line with the average monthly gain of 53,000 over the prior 12 months. Over the month, employment continued to trend up in ambulatory health care services (+32,000), hospitals (+18,000), and nursing and residential care facilities (+8,000). Employment in government increased by 51,000 in October and has returned to its pre-pandemic February 2020 level. Monthly job growth in government had averaged 50,000 in the prior 12 months. In October, employment continued to trend up in local government (+38,000). Social assistance added 19,000 jobs in October, compared with the average monthly gain of 23,000 over the prior 12 months. Over the month, employment continued to trend up in individual and family services (+14,000). In October, construction employment continued to trend up (+23,000), about in line with the average monthly gain of 18,000 over the prior 12 months. Employment continued to trend up over the month in specialty trade contractors (+14,000) and construction of buildings (+6,000). Employment in manufacturing decreased by 35,000 in October, reflecting a decline of 33,000 in motor vehicles and parts that was largely due to strike activity. In October, employment in leisure and hospitality changed little (+19,000). The industry had added an average of 52,000 jobs per month over the prior 12 months. Employment in professional and business services was little changed in October (+15,000) and has shown little net change since May.
Speaking of Govzilla, my favorite quote showing the stupidity of BIG government is … Biden’s climate envoy John Kerry. “We’ve got to cut down on farming due to ‘Climate Change’…or people are going to starve…”
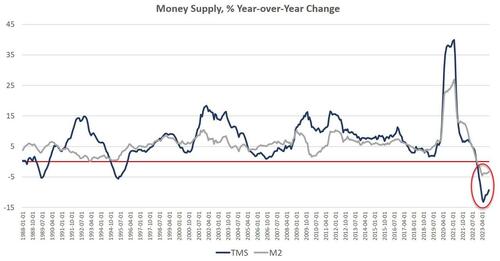
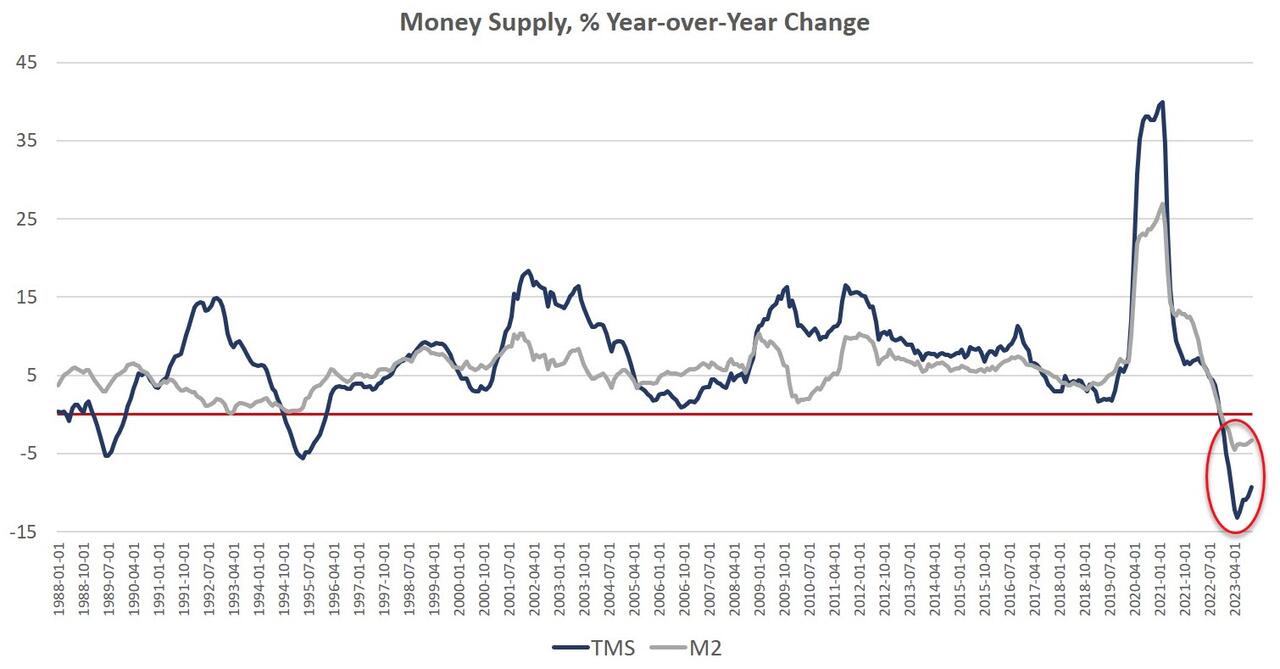
Since April 2021, money supply growth has slowed quickly, and since November, we’ve been seeing the money supply repeatedly contract year over year. The last time the year-over-year (YOY) change in the money supply slipped into negative territory was in November 1994. At that time, negative growth continued for fifteen months, finally turning positive again in January 1996.
Money-supply growth has now been negative for twelve months in a row. During October 2023, the downturn continued as YOY growth in the money supply was at –9.33 percent. That’s up slightly from September’s rate decline which was of –10.49 percent, and was far below October 2022’s rate of 2.14 percent. With negative growth now falling near or below –10 percent for the eighth month in a row, money-supply contraction is the largest we’ve seen since the Great Depression. Prior to this year, at no other point for at least sixty years has the money supply fallen by more than 6 percent (YoY) in any month.
The money supply metric used here—the “true,” or Rothbard-Salerno, money supply measure (TMS)—is the metric developed by Murray Rothbard and Joseph Salerno, and is designed to provide a better measure of money supply fluctuations than M2. (The Mises Institute now offers regular updates on this metric and its growth.)
In recent months, M2 growth rates have followed a similar course to TMS growth rates, although TMS has fallen faster than M2. In October 2023, the M2 growth rate was –3.35 percent. That’s down from September’s growth rate of –3.35 percent. October 2023’s growth rate was also well down from October 2022’s rate of 1.42 percent.
Money supply growth can often be a helpful measure of economic activity and an indicator of coming recessions. During periods of economic boom, money supply tends to grow quickly as commercial banks make more loans. Recessions, on the other hand, tend to be preceded by slowing rates of money supply growth.
It should be noted that the money supply does not need to actually contract to signal a recession and the boom-bust cycle. As shown by Ludwig von Mises, recessions are often preceded by a mere slowing in money supply growth. But the drop into negative territory we’ve seen in recent months does help illustrate just how far and how rapidly money supply growth has fallen. That is generally a red flag for economic growth and employment.
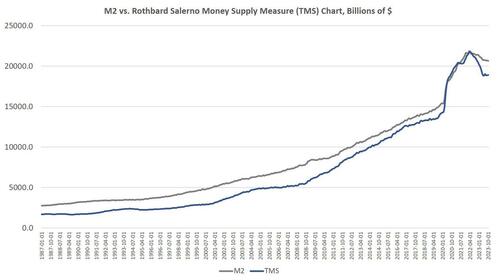
The fact that the money supply is shrinking at all is remarkable because the money supply in modern times almost never gets smaller. The money supply has now fallen by $2.8 trillion (or 13.1 percent) since the peak in April 2022. Proportionally, the drop in money supply since 2022 is the largest fall we’ve seen since the Depression. (Rothbard estimates that in the lead-up to the Great Depression, the money supply fell by 12 percent from its peak of $73 billion in mid-1929 to $64 billion at the end of 1932.)
In spite of this recent drop in total money supply, the trend in money-supply remains well above what existed during the twenty-year period from 1989 to 2009. To return to this trend, the money supply would have to drop at least another $3 trillion or so—or 15 percent—down to a total below $15 trillion. Moreover, as of October, total money supply was still up 32 percent (or $4.6 trillion) since January 2020.
Since 2009, the TMS money supply is now up by nearly 186 percent. (M2 has grown by 141 percent in that period.) Out of the current money supply of $18.9 trillion, $4.6 trillion—or 24 percent—of that has been created since January 2020. Since 2009, $12.2 trillion of the current money supply has been created. In other words, nearly two-thirds of the total existing money supply have been created just in the past thirteen years.
With these kinds of totals, a ten-percent drop only puts a small dent in the huge edifice of newly created money. The US economy still faces a very large monetary overhang from the past several years, and this is partly why after eighteen months of slowing money-supply growth, we are only now starting to see a slowdown in the labor market. (For example, job openings have fallen 22 percent over the past year, but have not yet returned to pre-covid levels.) The inflationary boom has not yet ended.
Nonetheless, the monetary slowdown has been sufficient to considerably weaken the economy. The Philadelphia Fed’s manufacturing index is in recession territory. The Leading Indicators index keeps looking worse. The yield curve points to recession. Temp jobs were down, year-over-year, which often indicates approaching recession. Default rates are rising.
Money Supply and Rising Interest Rates
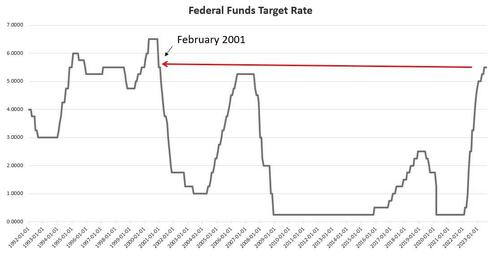
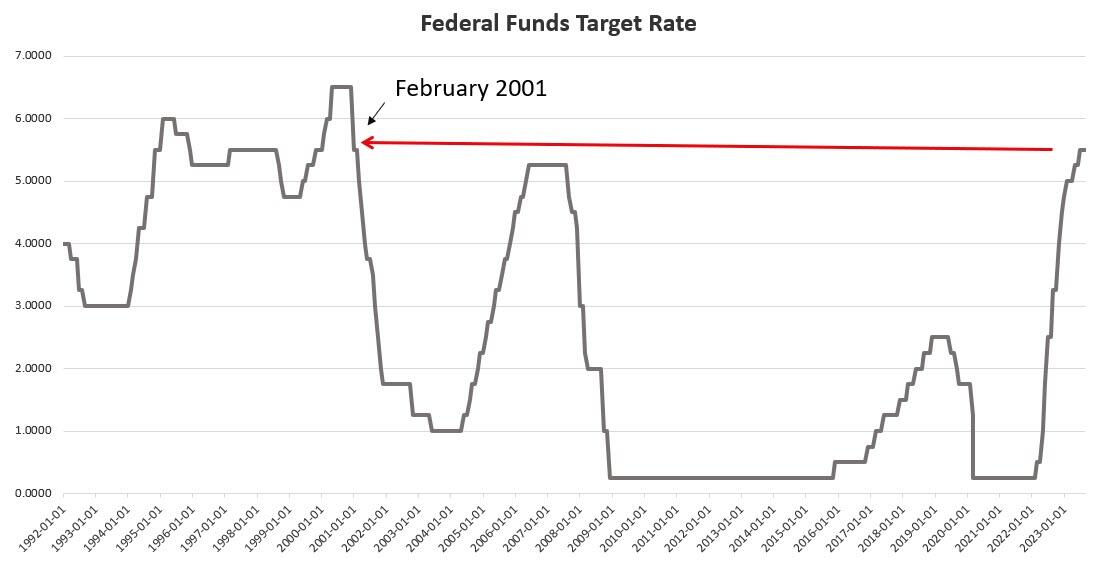
An inflationary boom begins to turn to bust once new injections of money subside, and we are seeing this now. Not surprisingly, the current signs of malaise come after the Federal Reserve finally pulled its foot slightly off the money-creation accelerator after more than a decade of quantitative easing, financial repression, and a general devotion to easy money. As of early December, the Fed has allowed the federal funds rate to rise to 5.50 percent, the highest since 2001. This has meant short-term interest rates overall have risen as well. In October, for example, the yield on 3-month Treasurys reached 5.6 percent, the highest level measured since December 2000.
Without ongoing access to easy money at near-zero rates, banks are less enthusiastic about making loans, and many marginal companies will no longer be able to stave off financial trouble by refinancing or taking out new loans. Commercial bankruptcy filings increased sizably during 2023, and continue to surge into the last quarter of the year. As reported by Monitor Daily:
The bankruptcy filing by WeWork in November propelled November commercial Chapter 11 filings to 842, an increase of 141% compared with the 349 filings registered in November 2022, according to data provided by Epiq Bankruptcy.
The case filed by WeWork on Nov. 6 included 517 related filings, according to analysis from the American Bankruptcy Institute, representing the third-most related filings in a case since the U.S. Bankruptcy Code became effective in 1979.
Overall commercial filings increased 21% to 2,252 in November, up from the 1,864 commercial filings registered in November 2022. Small business filings, captured as Subchapter V elections within Chapter 11, increased 79% to 181 in November, up from 101 in November 2022.
There were 37,860 total bankruptcy filings in November, a 21% increase from the November 2022 total of 31,187. Individual bankruptcy filings also registered a 21% year-over-year increase, as the 35,608 in November represented an increase over the 29,323 filings in November 2022. There were 20,250 individual Chapter 7 filings in November, a 23% increase compared with the 16,421 filings recorded in November 2022, and there were 15,280 individual Chapter 13 filings in November, a 19% increase compared with the 12,862 filings last November.
Lending for private consumption is getting more expensive also. In October, the average 30-year mortgage rate rose to 7.62 percent, the highest point reached since November 2000.
These factors all point toward a bubble that is in the process of popping. The situation is unsustainable, yet the Fed cannot change course without reigniting a new surge in price inflation. Although some professional economists insist that price inflation has all but disappeared, the sentiment on the ground is clearly one in which most workers believe their wages are not keeping up with rising prices. Any surge in prices would be especially problematic given the rising cost of living. Ordinary Americans face a similar problem with home prices. According to the Atlanta Fed, the housing affordability index is now the worst it’s been since 2006, in the midst of the Housing Bubble.
If the Fed reverses course now, and embraces a new flood of new money, prices will only spiral upward. It didn’t have to be this way, but ordinary people are now paying the price for a decade of easy money cheered by Wall Street and the profligates in Washington. The only way to put the economy on a more stable long-term path is for the Fed to stop pumping new money into the economy. That means a falling money supply and popping economic bubbles.
But it also lays the groundwork for a real economy – i.e., an economy not built on endless bubbles – built by saving and investment rather than spending made possible by artificially low interest rates and easy money.
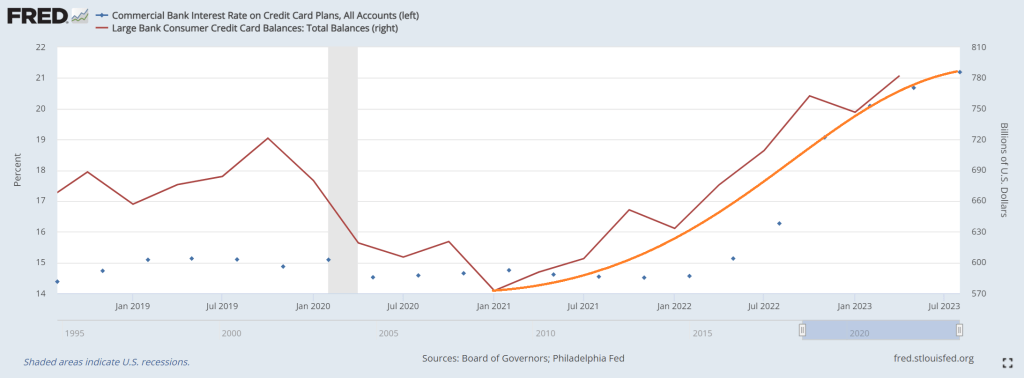
Then we have US consumers, attempting to cope with Biden’s inflation, by paying all-time highs on credit cards while trying to service ever-growing credit card balances.


You must be logged in to post a comment.