Back in red? As US fiscal policy deteriorates further thanks to endless Federal spending (not to mention seemingly endless wars under Biden and Nobel Peace Prize winner Obama), we are seeing pain in the bank lending business.
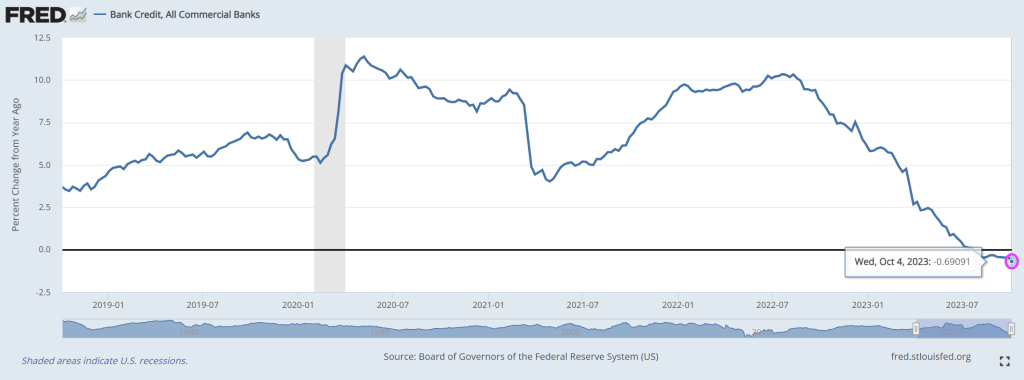
Commercial and industrial (C&I) loan lending standards is tightening (blue line) to levels typically seen in recessions. Even though Barclays HY-10Y spreads remains low.
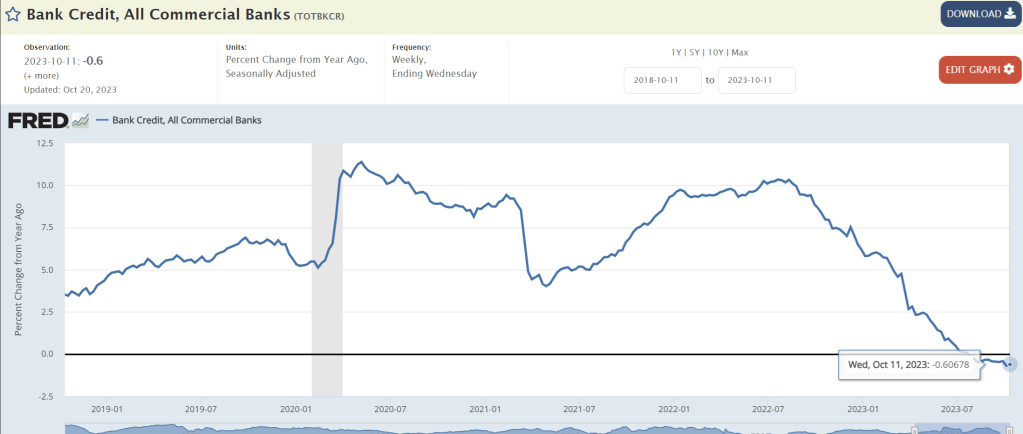
Bank credit growth remains negative for the twelve straight week.
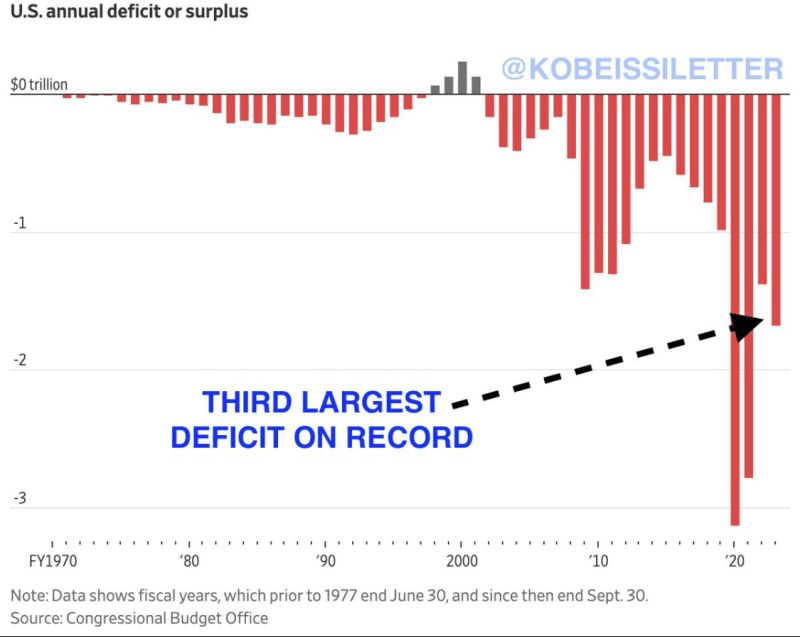
Billions Biden’s spending spree has led to the budget gap has doubled in the last year.
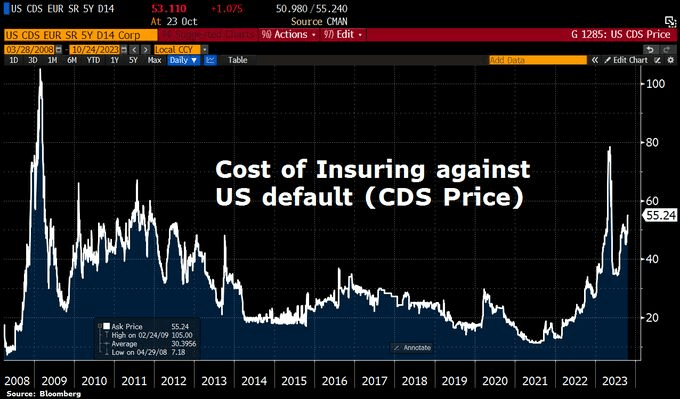
CDS is now at 55.24, highest after the Covid shock.
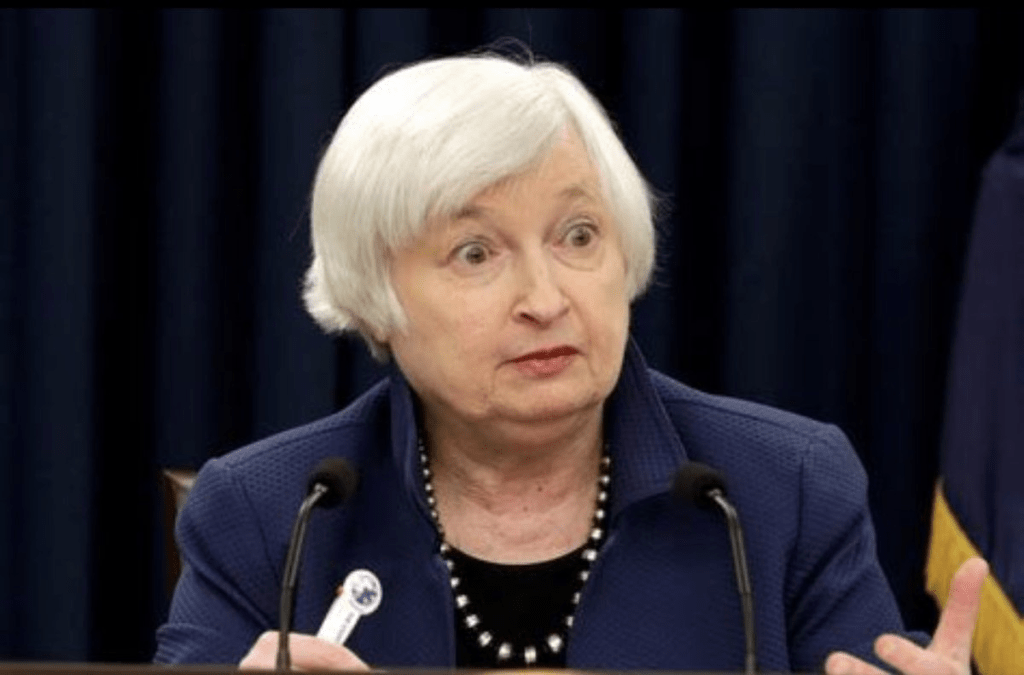
Under Biden/Yellen’s economic model, the appropriate themesong is “Hell’s Bells.”
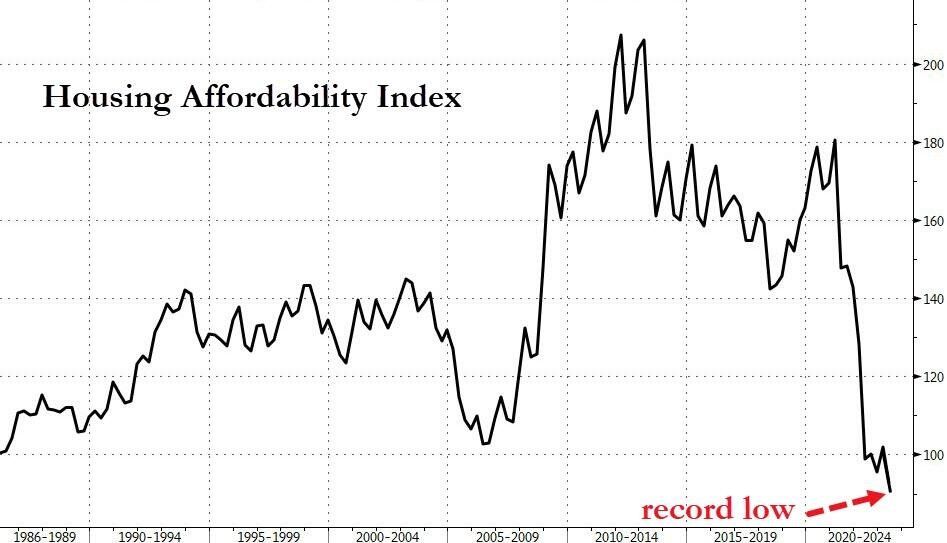
But we have video of Biden and his wife Jill walking along the beach on yet another vacation to Rehobeth Beach, Delaware while the world teeters of WWIII, over 200 hostages are still held by Hamas, and housing affordability hits an all-time low. It must be nice not to care.
Bidenomics has been a massive windfall for the top 1% of households in terms of wealth due to the emphasis on green energy transformation. But for the 99%, Bidenomics has been a disaster (unless you consider low-paying job creation a victory).
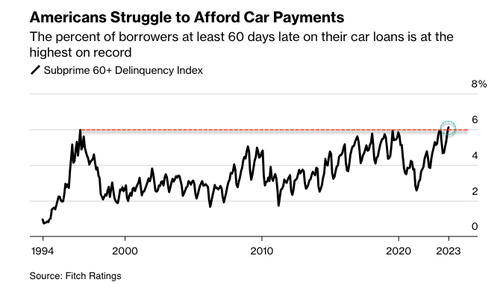
The auto sector, considered a leading economic indicator, pinpoints the arrival of the crushing auto loan crisis and even the possibility of the onset of the next recession. In late January, we Fitch revealed tat consumers are falling behind on auto payments – the most since the peak of the Great Financial Crisis. Fast forward nine months later, to September, that rate just hit the highest level in nearly three decades.
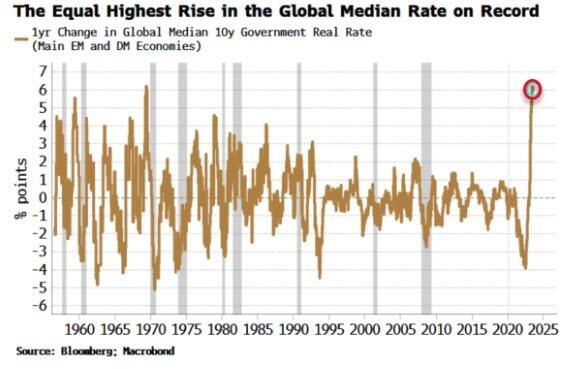
And with interest rates rising the fastest in history,
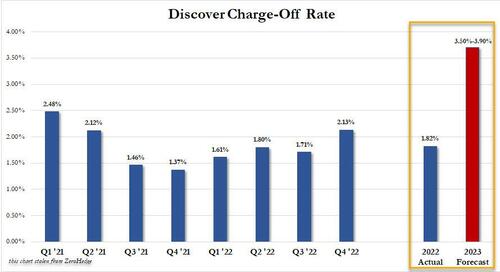
And Discover projected charge off rate for 2023 would more than double from its current 1.82% to as much as 3.90%!
In what could be the early innings of the auto loan crisis, something we called a “perfect storm” earlier this year, Bloomberg cites new Fitch data:
The percent of subprime auto borrowers at least 60 days past due on their loans rose to 6.11% in September, the highest in data going back to 1994, according to Fitch Ratings.
Source: Bloomberg
“The subprime borrower is getting squeezed,” said Margaret Rowe, senior director with Fitch.
Rowe said, “They can often be a first line of where we start to see the negative effects of macroeconomic headwinds.”
What has been widely known is the consumer has been funding car purchases with even more debt to afford record-high prices, with many monthly payments exceeding $1,000. Factor in the Federal Reserve’s most aggressive interest rate hiking cycle in a generation, elevated inflation, and the restarting of the federal student loan payments, tens of millions of consumers are under immense pressure this fall.
An endless stream of retailers, such as Walmart, Nordstrom, Macy’s, and Kohl’s – all of whom have recently warned about a consumer slowdown. Banks have also raised concerns, such as Morgan Stanley’s Mike Wilson, who believes the consumer is ‘falling off a cliff.’ And the latest high-frequency data from Barclays shows card spending has taken another leg down.
As delinquencies rise, Cox Automotive forecasts that 1.5 million vehicles will be seized this year, up from 1.2 million in 2022. That’s still below pre-pandemic levels, but the numbers could soar if a recession materializes in 2024.
Bloomberg cited Bankrate data that shows consumers with excellent credit can lock in an average interest rate of around 5.07% for a new car and 7.09% for a used vehicle. Those with bad credit should expect a new car rate of 14.18% and 21.38% for a used car.
The perfect storm we described earlier this year is unfolding.
At least residential mortgage delinquency rates remain low. With elevated home prices, the incentive to default on a loan is limited.
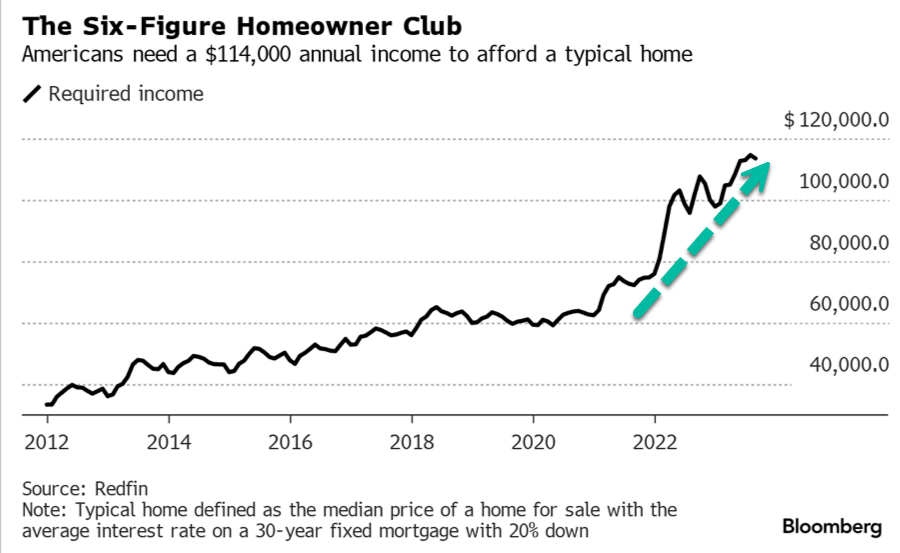
So The Perfect Storm hasn’t hit residential real estate … yet. But with households needing $114,000 in annual income to afford a typical home …
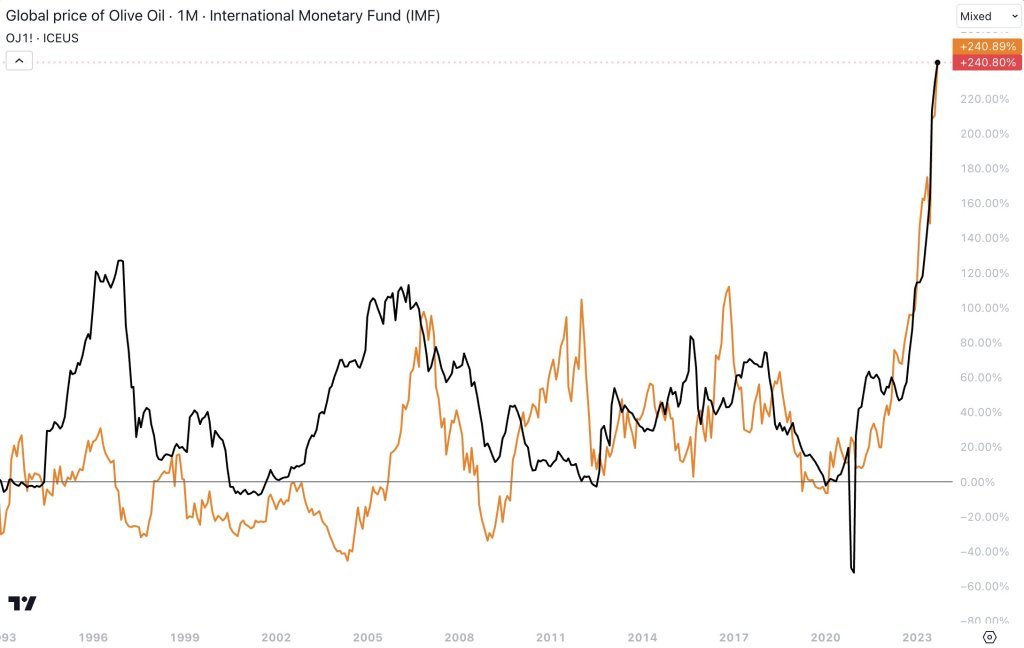
But at least home prices aren’t rising as fast as olive oil and orange juice!! Wow, that excesssive stimulypto by The Fed and Federal government is really screwing things up in the economy.
Biden is like George Clooney in “The Perfect Storm” sending the US out into stormy, violent seas while obessing about Ukraine and protecting Iran/Hamas.
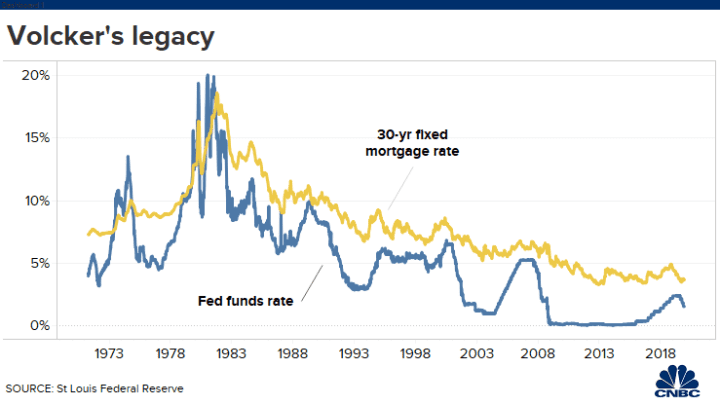
I had a wonderful time speaking at the Passive Investors Conference last night. One question I was asked was “Why doesn’t Powell (the current Fed Chair) pull “a Volcker” to cool inflation. She was referring to former Fed Chair Paul Volcker’s sudden raising of The Fed’s target rate which resulted in a cooling of inflation, but also an increase in the 30-year fixed mortgage rate to 16.63% in 1981.
Notice the trend in the Fed’s target rate and 30-year mortgage rate after Volcker’s rate shock. The trend in both has been downward as inflation was cooled.
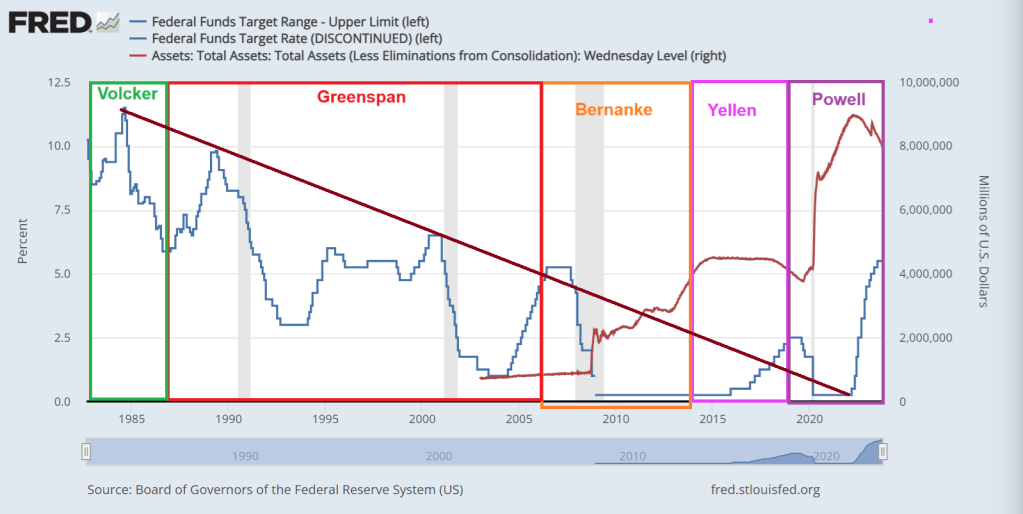
But, each Fed Chair ranged from hyperactive to hypoactive (meaning doing little). Volcker and Greenspan saw wild swings in The Fed’s target rate. Bernanke pretty much only lowered rates AND expanded the Quantitative Easing (QE) or asset purchases by The Fed. And nothing has been the same since.
Yellen, now Treasury Secretary, continued Bernanke’s practice of zero interest rate policies (ZIRP) and QE (asset purchases) … until Donald Trump was elected President. In fact, Yellen raise rates only once prior to Trump’s election as President. Then raises rates 8 consecutive times. This is why I call Yellen “TLTL Janet”. Too low for too long Janet.
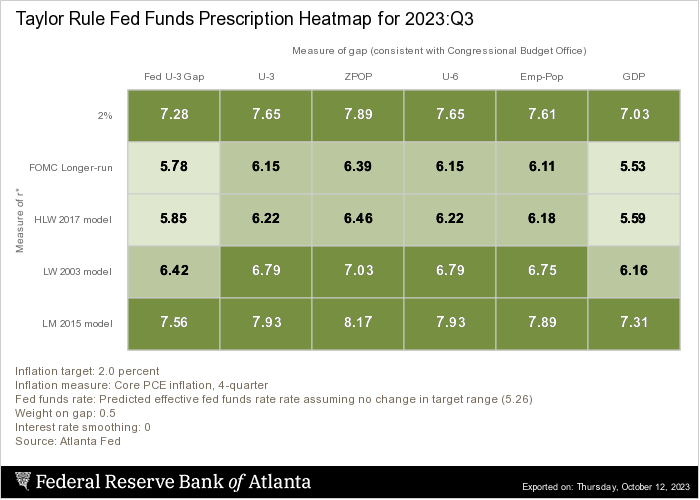
The she was replaced with DC insider Jerome Powell. Trump’s economy was strong (one explanation for Yellen trying to cool the economy with 8 consecutive rate hikes). But the Covid struck and Powell/Fed Open Market Committee overreacted, lowered the target rate back to 25 basis points and massively expanded the balance sheet. Powell also oversaw a rapid increase in the target rate, very Volckerish! But Powell stopped short of the rate suggested by The Taylor Rule of around 6.5% to 8.17%. The current target rate is 5.50%. So, Powell stopped far short of rates need to cool inflation.
But with Bidenomis came Bidenflation and a reversal of misfortunes for The Fed. They started rapidly raising rates … again.
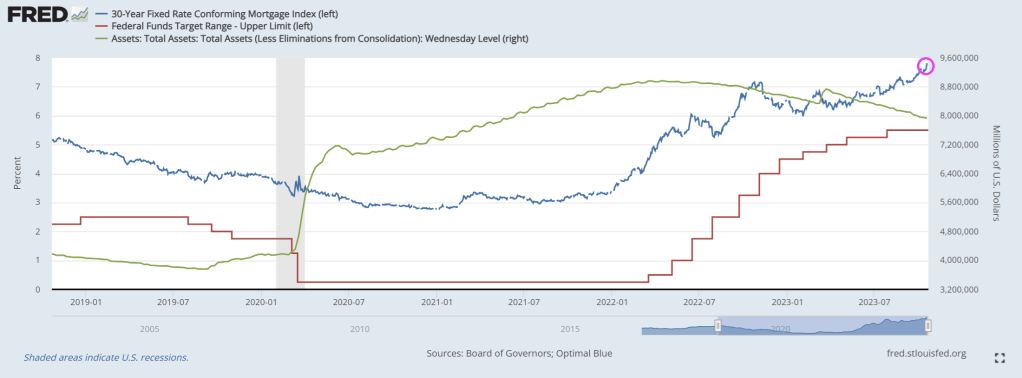
Mortgage rates continue to climb as The Fed stubbornly won’t reduce its balance sheet.
Biden/Congress have a broken fiscal model where spending is out of control. And The Fed can’t buy all the debt Biden/Yellen want to issue.
US deficits are the third highest on record.
We might as well have Taylor Swift as Fed Chair. And Travis Kelce as Treasury Secretary replacing TLTL Janet.
Fire! Yes, Biden and Congress created a fire with it reckless Federal spending leading in 40-year highs inflation, prompting The Fed to counterattack with rapid rate hikes.
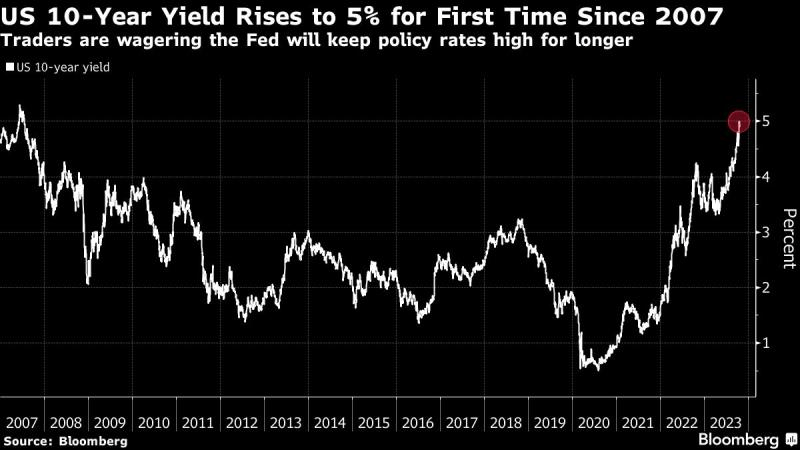
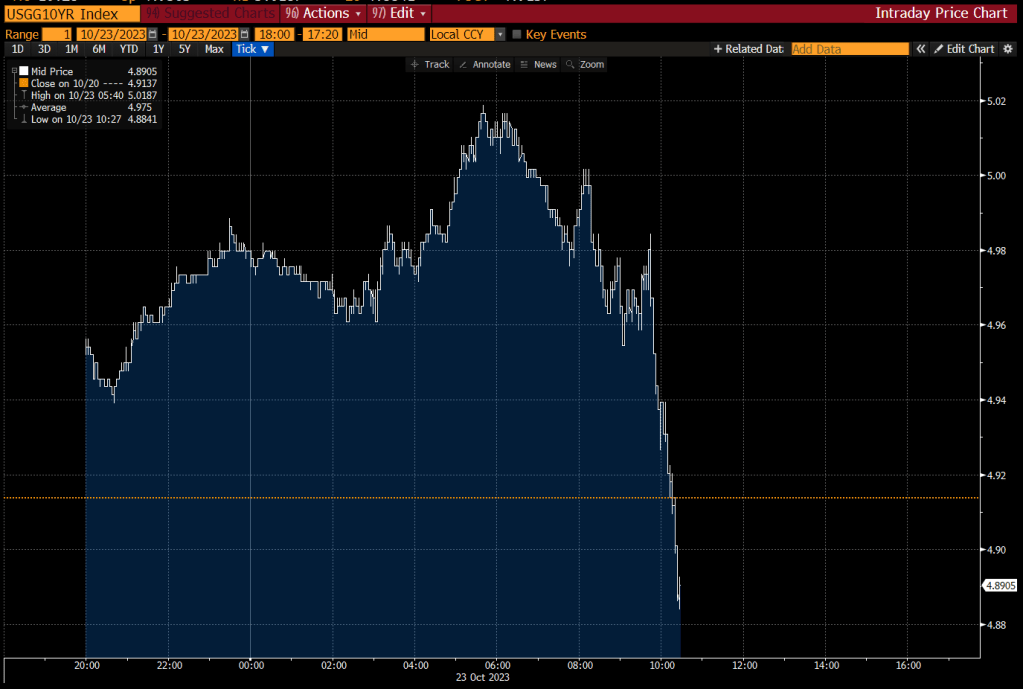
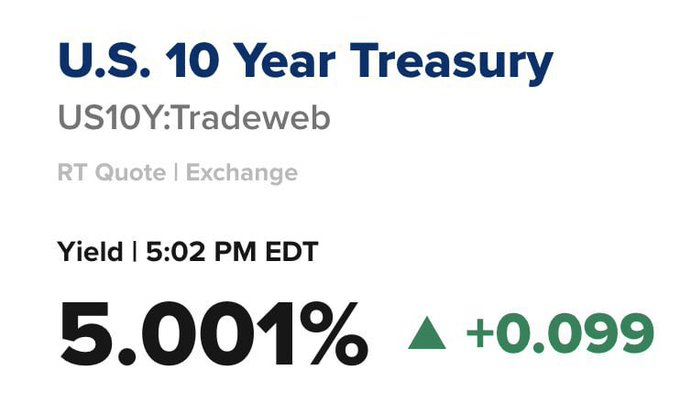
We now see the 10-year Treasury yield passing 5%. And the REAL 10-year Treasury yield passing 2.46%.
And Freddie Mac’s 30-year mortgage rate survey is at 7.63%, the highest since 2000.
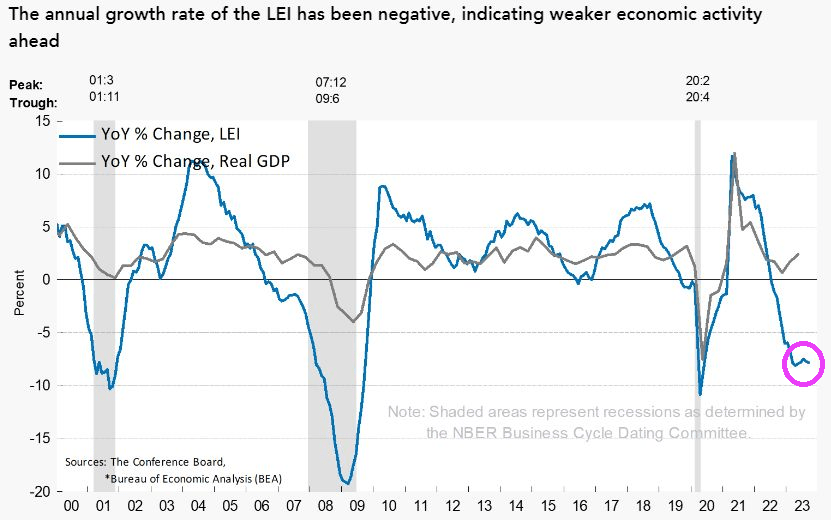
Conference Board is now forecasting a “shallow recession in the 1st half of 2024,” pushed back again from prior calls for a recession to start in Q4, Q3, Q2, and Q1 of this year.
Here is how I feel about Washington DC in general.
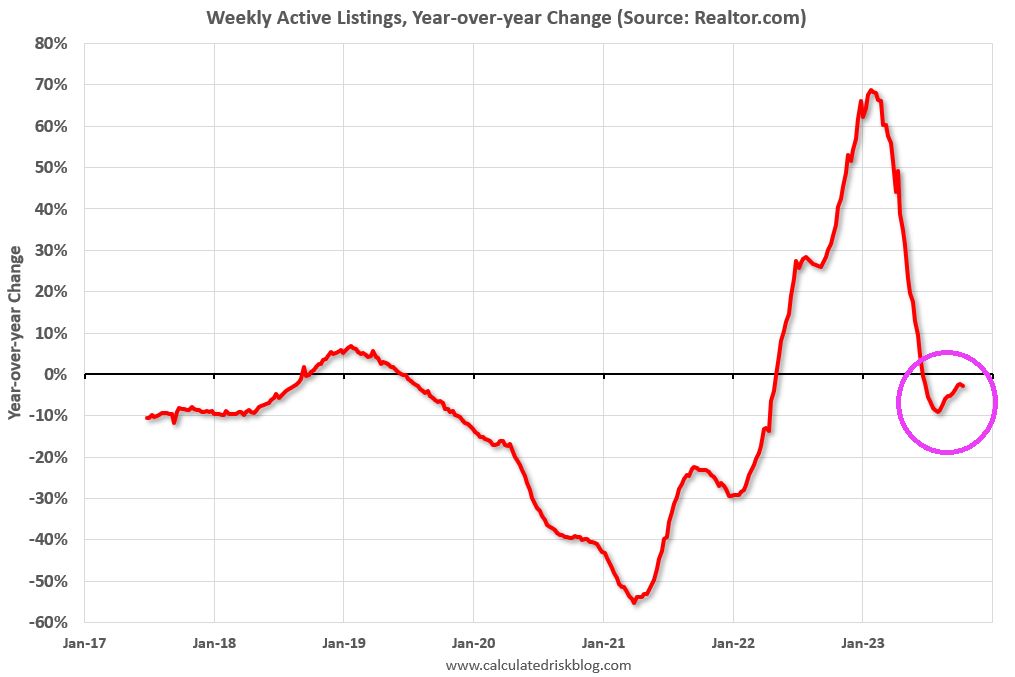
• Active inventory declined, with for-sale homes lagging behind year ago levels by 2.7%. For 17 straight weeks, the number of homes available for sale has registered below that of the previous year.
• New listings–a measure of sellers putting homes up for sale–were down again this week, by 4.4% from one year ago. Since mid-2022, new listings have registered lower than prior year levels, as the mortgage-rate lock-in effect freezes homeowners with low-rate existing mortgages in place. Although the year over year declines are smaller now than the double-digit pace seen earlier in 2023, declines from the pre-pandemic period are still substantial.
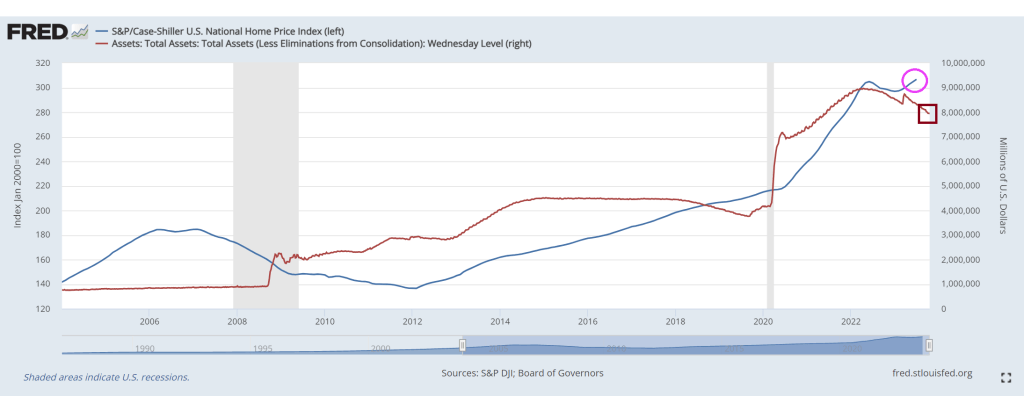
Inventory remains far below levels seen before the financial crisis. But Case-Shiller National Home Price Index (blue) remains elevated along with The Fed’s balance sheet (red) which is barely below $8 TRILLION. And Powell didn’t say much about speeding up the trimming of The Fed ballast.
Bidenomics strikes … again. No, not his inane ramblings about Hamas being “the other team” or that Hamas has to learn to shoot straight. But his policies freezing effects on the economy. Like housing.
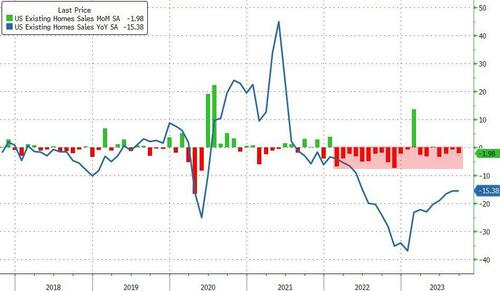
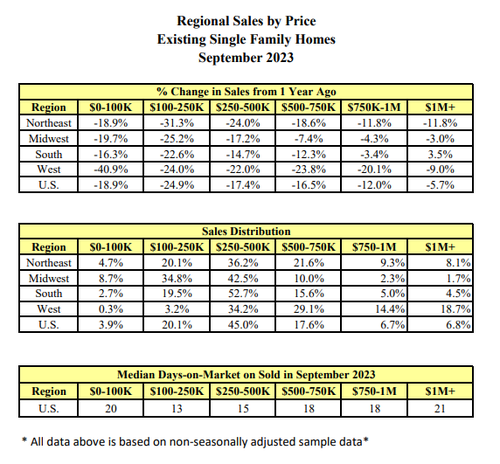
Existing-home sales faded in September, according to the National Association of REALTORS®. Among the four major U.S. regions, sales rose in the Northeast but receded in the Midwest, South and West. All four regions registered year-over-year sales declines.
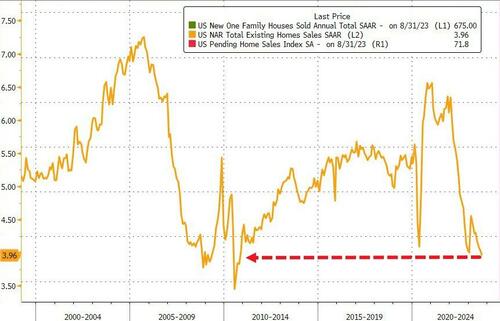
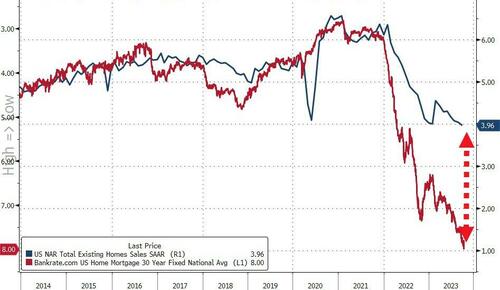
Total existing-home sales – completed transactions that include single-family homes, townhomes, condominiums and co-ops – waned 2.0% from August to a seasonally adjusted annual rate of 3.96 million in September. Year-over-year, sales dropped 15.4% (down from 4.68 million in September 2022). … Total housing inventory registered at the end of September was 1.13 million units, up 2.7% from August but down 8.1% from one year ago (1.23 million). Unsold inventory sits at a 3.4-month supply at the current sales pace, up from 3.3 months in August and 3.2 months in September 2022.
The total existing home sales SAAR dropped back below 4mm for the first time since October 2010 (during the foreclosure crisis)…
Source: Bloomberg
Sales fell in all regions except the Northeast in September… and in every price range…
Single-family home sales fell to an annualized 3.53 million pace, the lowest since 2010. Condominium and co-op sales also declined.
“As has been the case throughout this year, limited inventory and low housing affordability continue to hamper home sales,” said Lawrence Yun, NAR’s chief economist.
“The Federal Reserve simply cannot keep raising interest rates in light of softening inflation and weakening job gains.”
First-time buyers made up a historically low 27% of purchases, down from the prior month.
Cash sales represented 29% of total sales, matching the highest level in over a decade. Investors, who often purchase with cash and are therefore less sensitive to mortgage rates, made up 18% of the market.
“It would be very unusual to have higher cash compared to first time buyers,” Yun said on a call with reporters.
And, if mortgage rates (and thus affordability) are anything to go by, things are about to get real…
Source: Bloomberg
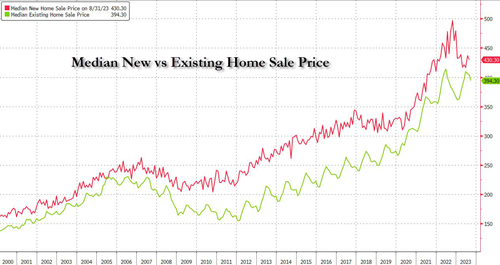
The median selling price rose 2.8% from a year earlier to $394,300, the highest September reading on record, pushing affordability even lower. But existing home prices are falling relative to new home prices (with the ratio near record lows)…
It looks like The House may elect a RINO as Speaker (Patrick McHenry, RINO-NC) to replace McCarthy. One RINO replacing another RINO … all so The House can continue its insane, inflation inducing spending.
Its the Biden Bop! As Bidenomics continues its blitzkrieg on the US economy with the Federal government massively expanding its debt while households and business cut back on debt.
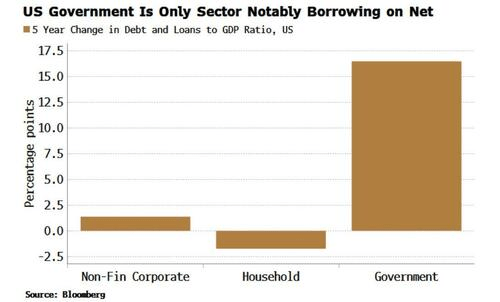
The US government is the only sector to have notably borrowed on a net basis over the last five years.The market sees that as inflationary, driving yields higher.
The pandemic saw an increase in the borrowing of all sectors. But it was the government that saw the biggest rise in GDP terms, and it is the government whose debt is still considerably higher than it was before the pandemic – the debt-to-GDP ratio is up 16 percentage points over the last five years.
In contrast, the household sector’s leverage is now lower than it was pre-pandemic, while the corporate sector’s is only marginally higher. The US government has become the borrower of first as well as last resort.
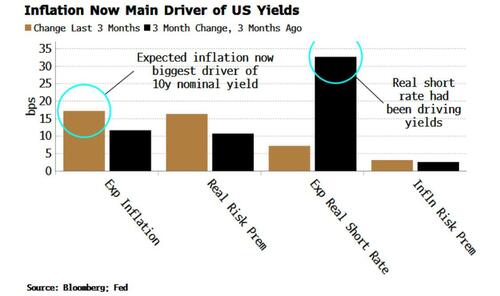
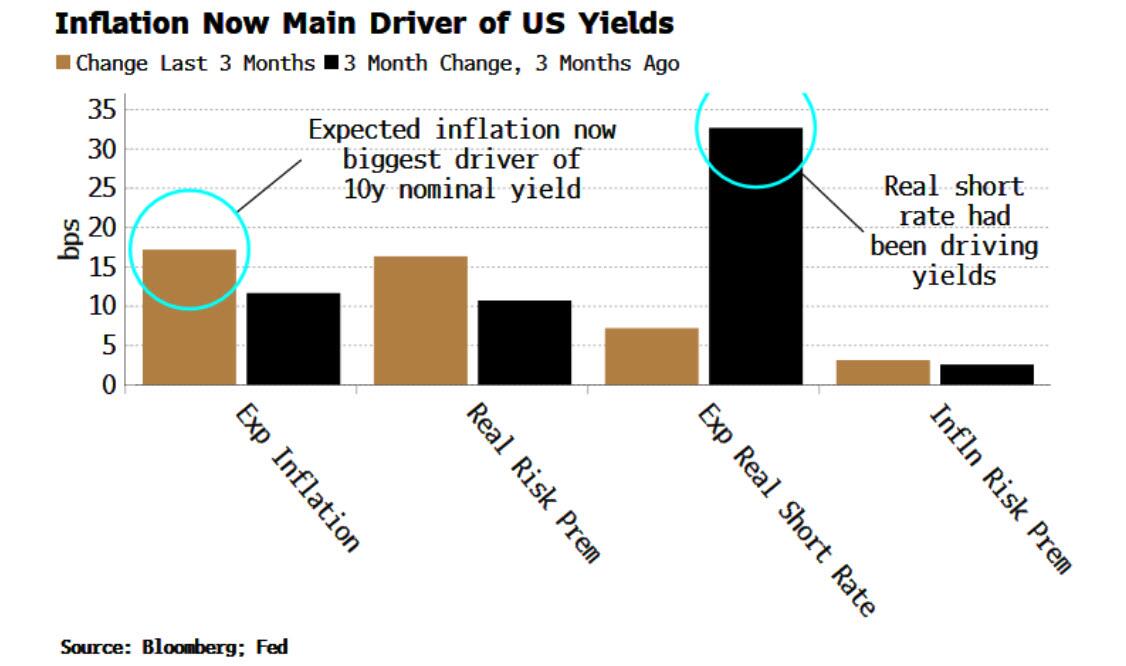
The market is picking up on this and is pricing accordingly. We can decompose nominal yields into a sum of expected short rate + real term premium + expected inflation + inflation term premium (see here for more).
Over the last three months, the main driver of rising yields in the US has been expected inflation, followed by the real risk premium. This marks a change from earlier in the year where the principal driver was the expected short rate, i.e. expectations of increases in the Federal Reserve’s policy rate.
Regressing the fiscal balance with the yield components shows that only inflation and the inflation risk premium have a negative sign, i.e. when the fiscal balance falls (greater deficit), expected inflation and the risks surrounding it increase.
Not only does increased government borrowing push up borrowing costs through greater inflation risks. When the sovereign is the only borrower, it crowds out the rest of the economy. With governments’ reputation for inefficiency, this depresses real growth.
The lost decades in Japan were primarily a result of the government stepping in to borrow as the private sector nursed its wounds from the late 1980s financial crash. But that perpetuated and entrenched the situation. With the Treasury now the sole borrower of any significance, the US risks going down a similar, yet more stagflationary path, hindering real growth, and keeping yields elevated.
On the private sector side, bank credit fell again last week.
Despite what whispering Joe Biden says, he didn’t reduce the budget deficit other than briefly. The budget deficit is forecast to run persistemly high because of endless, reckless spending and forever wars (Ukraine, Israel and … Taiwan?).
(Bloomberg) — The Federal Reserve faces potential policy pitfalls ahead as it wrestles with how to respond to investor angst about the US government’s $33.5 trillion mountain of debt.
It’s exceedingly difficult to have sound monetary policy without sound fiscal policy. Biden/Democrats do NOT equal sound fiscal policy.
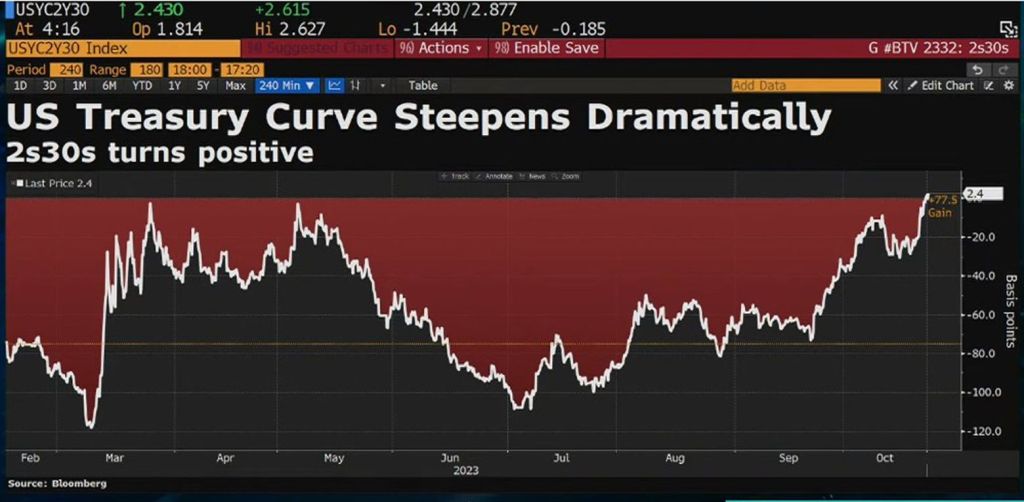
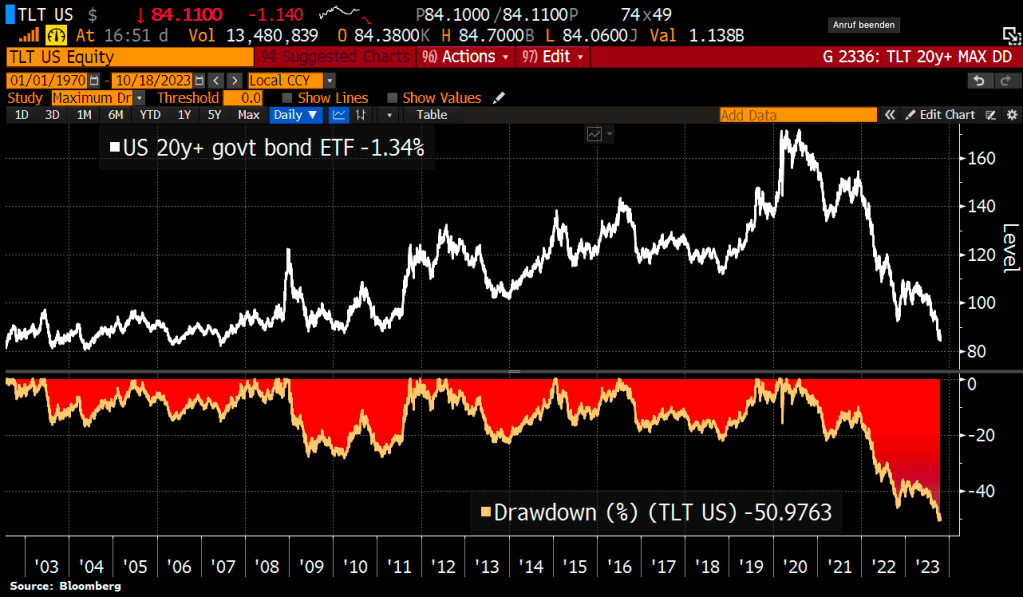
Adding to the pain, the long end of the yield curve is getting clobbered.
And bank balance sheets are getting clobbered too.
The King of Endless War! Billlions Biden! Who Janet Yellen said is “vibrant.” This is vibrant??
Trust Biden to muddy the waters about US debt, deficits and foreign wars. Hell, Biden could only say that the infamous missile that landed on the Gaza hospital was launched by “the other team” like he was watching an Eagles/Giants football game instead of a slaughter of innocents by Hamas terrorists.
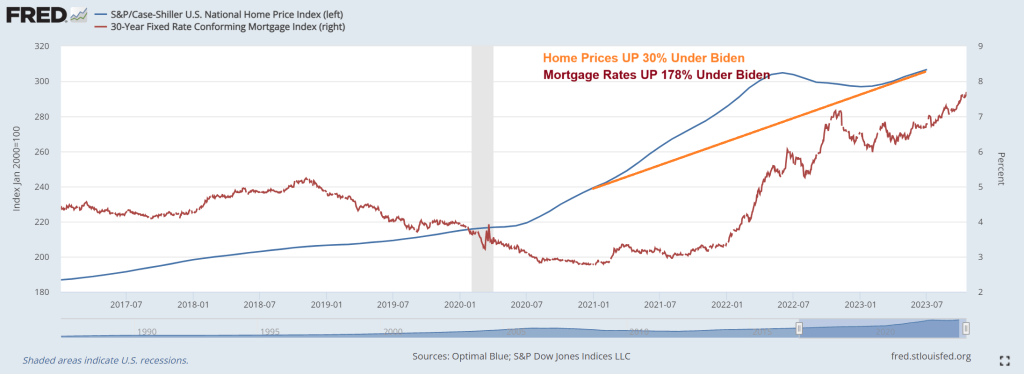
Under Bidenomics, home prices are up 30% while real weekly earnings growth has been negative for most of Biden’s Presidency. And mortgage rates are up 178% under Bidenomics.
It’s harder than ever for Americans to afford a home.
A homebuyer must earn $114,627 to afford the median-priced U.S. home, up 15% ($15,285) from a year ago and up more than 50% since the start of the pandemic. That’s the highest annual income necessary to afford a home on record.
This is based on a Redfin analysis that compares median monthly mortgage payments for homebuyers in August 2023 and August 2022. The income data in this analysis is adjusted for inflation. See the bottom of this report for more on methodology.
Housing costs are higher than ever because of the one-two punch of sky-high mortgage rates and rising home prices. The average rate on a 30-year fixed mortgage was 7.07% in August. Mortgage rates have climbed even higher since then, hitting 7.57% during the week ending October 12–their highest level in over two decades. But even though soaring mortgage rates have dampened demand, low inventory is causing home prices to increase. The typical U.S. home sold for about $420,000 in August, up 3% year over year and just about $12,000 shy of the all-time high hit in mid-2022.
The typical U.S. homebuyer’s monthly mortgage payment is $2,866, an all-time high. That’s up 20% from $2,395 a year earlier, and by that time payments had already increased substantially from the beginning of the pandemic, a time of ultra-low mortgage rates and yet-to-skyrocket home prices. In August 2020, for instance, the typical monthly payment was $1,581, based on that month’s average mortgage rate of 2.94% and median home price of $329,000. At that time, a homebuyer would have needed to earn $75,000 per year to afford the typical home.
The typical American household earns about $40,000 less than the income needed to buy a median-priced home. The median household income was roughly $75,000 in 2022, the most recent year for which annual income data is available. Hourly wages have risen in 2023, but not nearly as fast as the income necessary to afford a home is rising: The average U.S. hourly wage has increased by about 5% over the last year.
“In a homebuyer’s ideal world, rising mortgage rates would push demand and home prices down enough to make up for high interest payments. But that’s not what’s happening now: Although new listings are ticking up slightly, inventory is still near record lows as homeowners hang onto their low mortgage rates–and that’s propping up prices,” said Redfin Economics Research Lead Chen Zhao. “Buyers–particularly first-timers–who are committed to getting into a home now should think outside the box. Consider a condo or townhouse, which are less expensive than a single-family home, and/or consider moving to a more affordable part of the country, or a more affordable suburb.”
Affordability is less of a problem for all-cash and move-up buyers. The major increase in income necessary to afford a home hits first-time homebuyers hardest. Buyers who can afford to pay cash aren’t impacted by high mortgage rates, and they likely earn more than the income necessary to purchase a home, anyway. Buyers who are selling a home to buy another one are in a better boat than first-timers because they have likely built up equity in their current home, which takes a bit of the sting out of soaring monthly payments. The caveat to the caveat is those who bought at the height of the pandemic-era market with an ultra-low mortgage rate and need to sell now: Not only are they giving up a low rate, they also may have lost money on their home.
Metro-level highlights: Income needed to buy a home has risen in all major metros, with biggest uptick in Miami and smallest in Austin
August 2023, analysis includes 100 most populous U.S. metros for which data is available
Metros where necessary income has increased most: In both Miami and Newark, NJ, homebuyers must earn 33% more than a year ago to afford the typical home–the biggest percent increase of the major U.S. metros. Homebuyers in Miami need to earn $143,000 annually to afford the area’s typical monthly mortgage payment of $3,580, and Newark buyers need to earn roughly $160,000 to afford that area’s $3,989 payment.
Other metros where necessary income has increased by over 30%: The income necessary to afford a median-priced home has increased by over 30% in four other metros, all in the eastern half of the country: Bridgeport, CT ($183,000); Dayton, OH ($60,000); Rochester, NY ($66,000); and Hartford, CT ($95,000).
Buyers need to earn more in every major metro: Skyrocketing mortgage rates have caused the income necessary to buy a home to increase in every major metro, even the places where prices have declined over the last year.
Necessary income has increased least in pandemic homebuying hotspots: Austin, TX homebuyers must earn $126,000 to afford the median-priced home, 8% more than a year ago–the smallest increase of all the major U.S. metros. That’s despite Austin home prices falling 7% year over year in August after they skyrocketed during the pandemic, with remote workers flocking in. Boise, ID, another pandemic homebuying hotspot where demand has since dropped, experienced the next-smallest increase: up 9% to $127,000. Salt Lake City, Fort Worth, TX and Lakeland, FL come next, with year-over-year increases of about 13% each. Home prices are down from a year ago in all those metros.
Homebuyers must earn six figures to buy a home in half the major metros in the country: In 50 of the 100 metros in this analysis, buyers must earn at least $100,000 to afford the median-priced home in their area. Buyers must earn at least $50,000 everywhere in the country.
Bay Area buyers must earn $400,000: Buyers in the most expensive markets in the country–San Francisco and San Jose, CA–must earn more than $400,000 to afford the median-priced home in their area, both up nearly 25% year over year. The next five metros are all in California: Anaheim ($300,000), Oakland ($250,000), San Diego ($241,000), Los Angeles ($237,000) and Oxnard ($233,000).
Rust Belt buyers need the least income–but it’s still up from a year ago: Detroit homebuyers must earn about $52,000 to afford the area’s median-priced home, up 19% from a year ago. That’s the lowest income required to afford a home in the U.S. Next come three Ohio metros (Akron, Dayton and Cleveland) and Little Rock, AR, all of which require roughly $60,000 in annual income to buy a home.
Face it, the US economy and housing/mortgage markets are addicted to gov!


You must be logged in to post a comment.