Worst Monthly Spike of “Core Services” PCE Inflation in 22 Years (Will This Lead The Fed To Hike Rates?)

Well, this might keep The Fed talking heads up at night.

Over the past year or so, the Fed has been intensely discussing inflation in “core services,” which is where inflation had shifted to in 2022, from goods inflation which had spiked into mid-2022 but then cooled dramatically. So “core services” is where it’s at. Core services is where consumers spend the majority of their money. Core services are all services except energy services. Core services inflation has been behaving badly for months, and in January, it spiked out the wazoo.

The “core services” PCE price index spiked to 7.15% annualized in January from December, the worst month-to-month jump in 22 years (blue line), according to index data released today by the Bureau of Economic Analysis. Drivers of the spike were non-housing measures as well as housing inflation. More on each category in a moment.

The bad behavior of core services inflation that we have been lamenting since June – and which was confirmed earlier this month by the nasty surprise in the CPI – is why Fed governors have said this year in near unison that they’re in no hurry to cut rates, but have taken a wait-and-see approach. And now the concept of rate hikes is cropping up in their speeches again.

For example, Fed governor Michelle Bowman said in the speech yesterday, that she was “willing to raise the federal funds rate at a future meeting should the incoming data indicate that progress on inflation has stalled or reversed.”

Even year-over-year, core services inflation has now reversed and accelerated to 3.5%.

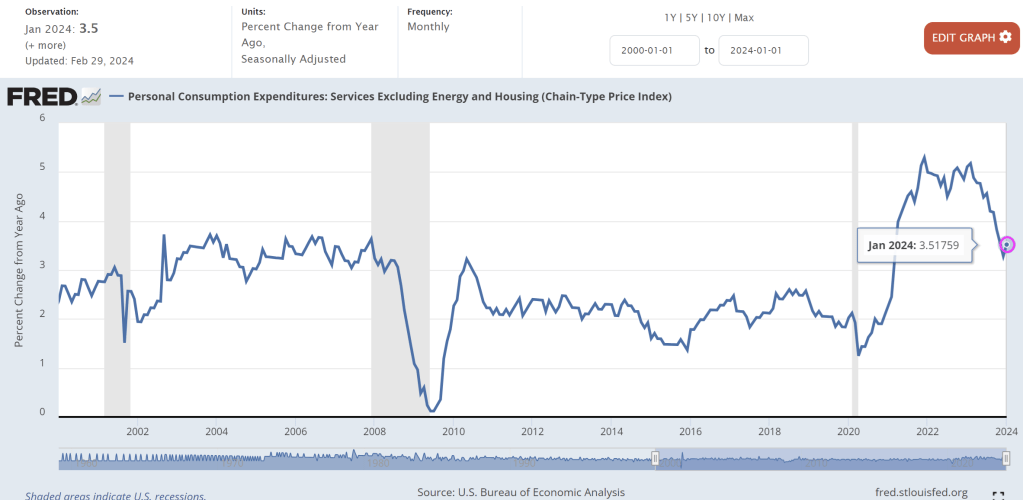
This reversal of fortune may be big enough to lead The Fed to raise rates.

Speaking of coping with inflation …

US Pending Home Sales Disappoint In January, Falling -6.82% YoY

I feel like the economy is fixing to die. At least the housing and mortgage sectors.

Pending home sales puked in January, tumbling 4.9% MoM (vs +1.5% MoM exp). This was made worse by a large downward revision for December (from +8.3% MoM to +5.7% MoM)…

Source: Bloomberg

That was the biggest MoM decline since August and dragged the YoY sales decline to -6.82%, tumbling back near record lows…

Source: Bloomberg

Realtors gonna realtor…

“This combination of economic conditions is favorable for home buying,” Lawrence Yun, NAR’s chief economist, said in a statement.

“However, consumers are showing extra sensitivity to changes in mortgage rates in the current cycle, and that’s impacting home sales.”

WTF are you talking about Larry?

Earlier this week, a gauge of US mortgage applications for home purchases fell for a fifth week, nearing its lowest level since 1995. 

Who could have seen that coming? As rates surged once again…

Source: Bloomberg

The pending-home sales report is a leading indicator of existing-home sales given houses typically go under contract a month or two before they’re sold.

The index of contract signings decreased 7.3% in the South, the nation’s biggest housing market.

Pending sales also fell 7.6% in the Midwest, but climbed 0.8% in the Northeast and 0.5% in the West.

“Southern states and those in the Rocky Mountain time zone experienced faster job growth compared to the rest of the country,” Yun said.

“As a result, long-term housing demand is increasing more significantly in these regions. However, the timing and number of purchases will largely depend on the prevailing mortgage rates and inventory availability.”

Overall sales are expected to increase 13% this year, according to NAR’s economic outlook, but as the chart above shows, unless rates start tumbling soon, that ain’t gonna happen.

Victory?? US GDP Grew By $334 Billion In Q4 With $834 Billion In Additional Debt ($2.5 In Debt To Get $1 Of GDP, Unfunded Liabilities At $664,000 Per Citizen)

Paul Krugman and others are cheering the defeat of inflation (odd since it is on the rise again). But how does our Federal government “grow” the economy and inflation? Borrow and spend, baby!

The Bureau of Economic Analysis just released Q4’s GDP update. The good news? US GDP grew by $334 billion. The bad news? Yellen and Treasury had to borrow $834 billion in debt to get there. That is a ratio of $2.5 of debt to get $1 of GDP. Only in Washington DC does math like that causes zero consternation. They are all down at the nightclub partying the nights away.

I still want to hear Biden (or any other elected official, Democrat or Republican) to explain to me how the US is going to honor its unfunded liabilities (Social Security, Medicare, etc) which is $664,000 PER CITIZEN. Again, this figure does not included the 8-11 million illegal immigrants who have stormed our borders under Biden. Hey, how about an entry fee for each immigrant of $664,000?

“Billions” Biden loves to spend money along with members of Congress and the Administrative State.

Stall Speed! How Bidenomics Has Caused Mortgage Demand To Stall, Mortgage Applications Down 5.6% From Last Week (Inflation + Fed = Mortgage Rates Above 7%)

The mortgage market has reached stall speed thanks to Bidenomics (inflation begat Fed tightening that begat 7%+ mortgage rates).

Mortgage applications decreased 5.6 percent from one week earlier, according to data from the Mortgage Bankers Association’s (MBA) Weekly Mortgage Applications Survey for the week ending February 23, 2024.

The Market Composite Index, a measure of mortgage loan application volume, decreased 5.6 percent on a seasonally adjusted basis from one week earlier. On an unadjusted basis, the Index decreased 3 percent compared with the previous week.  The seasonally adjusted Purchase Index decreased 5 percent from one week earlier. The unadjusted Purchase Index decreased 1 percent compared with the previous week and was 12 percent lower than the same week one year ago.

The Refinance Index decreased 7 percent from the previous week and was 1 percent lower than the same week one year ago.

The average contract interest rate for 30-year fixed-rate mortgages with conforming loan balances ($766,550 or less) decreased to 7.04 percent from 7.06 percent, with points increasing to 0.67 from 0.66 (including the origination fee) for 80 percent loan-to-value ratio (LTV) loans.

Conference Board’s Consumer Confidence Plunged To -3.90 In January (Consumers Suffering Under Bidenomics With Food Prices UP 21% Under Biden, Diesel Fuel Prices UP 90%)

Confidence! It’s what consumers DON’T have under Bidenomics.

For the fourth straight month, The Conference Board revised its consumer confidence data significantly lower. In fact January’s was the biggest downward revision since Feb 2022. And Conference Board Consumer Confidence was DOWN to -3.90 in January, the worst since Feb 2022.

It really isn’t surprising the consumer confidence stinks. Food prices (CPI) are UP 21% under Vacation Joe Biden. Diesel fuel prices are UP 90% under Listless Joe.

Well, Biden’s appearance on (unfunny) Seth Myer’s Late Night Show certainly didn’t make me feel more confident about America’s future.

Boom, Boom! Housing Inflation Persists As Case-Shiller 20 Home Price Index Rises For 11th Month In A Row (National Index Rose 5.54% YoY While Avg Weekly Earnings Were Only 2.97% YoY)

John Lee Hooker sang it best: Boom, Boom! Home price inflation, that is!

The Case-Shiller National home price index rose in December by 5.54% year-over-year (YoY) while average weekly earnings has remained lower that home price growth since September 2023 (pink box) and from August 2020 to December 2023.

Home prices in America’s 20 largest cities rose for the 11th straight month in December (the latest data released by S&P Global Case-Shiller today), up 0.21% MoM (in line with the 0.20% MoM expected and 0.24% prior).

San Diego reported the highest year-over-year gain among the 20 cities with an 8.8% increase in December, followed by Los Angeles and Detroit, each with an 8.3% increase. Portland showed a 0.3% increase this month, holding the lowest rank after reporting the smallest year-over-year growth.

Given the current level of home prices, here is a picture of the average down payment for a house by state. Florida and Washington DC lead the nation followed by Washington state and California.

Inflation, that hideous strength.

Here is The Animal’s version of Boom, Boom.

Fed’s Love Potion #9! US New Home Sales In January At 1.8% YoY As Supply Jumps (As Mortgage Rates SOAR 149% Under Biden)

The Fed’s love potion #9: Printing endless supplies of money. But it still isn’t creating a large enough growth in new homes. The Fed’s money printing has helped drive housing prices up 32.7% under Biden, making housing unaffordable for millions of households.

But how about NEW homes? New home sales rose in January, but less than expected.

After December’s 8.0% surprise jump was revised down to +7.2% MoM, January sales rose just 1.5% MoM (half the 3.0% expected). In fact all three of the last months’ data was revised lower…

The downward revision and disappointment reduced the YoY sales growth to just 1.8%

The total new home sales SAAR rose from a downwardly revised 651k to 661k in January (well below the 684k expected)…

Source: Bloomberg

The median sales price of a home decreased to $420,700 in January from a year ago, marking the fifth-straight decline (up marginally from the $413,000 in December which was two year low).

Interestingly, the average price (NSA) soared from $493.4k to $534.3k)… which signals more higher-priced homes selling…

Source: Bloomberg

Mortgage rates are back on the rise, not exactly a good sign for new home sales as homebuilders margins collapse…

Source: Bloomberg

Finally, new-home supply increased to 456,000 from the prior month, the most in over a year.

Source: Bloomberg

Is reality about to set in for the US housing market? Or will Powell step in (with a banking crisis excuse) to save all that ‘wealth’?

Source: Bloomberg

The total new home sales SAAR rose from a downwardly revised 651k to 661k in January (well below the 684k expected)…

Source: Bloomberg

The median sales price of a home decreased to $420,700 in January from a year ago, marking the fifth-straight decline (up marginally from the $413,000 in December which was two year low).

Interestingly, the average price (NSA) soared from $493.4k to $534.3k)… which signals more higher-priced homes selling…

Source: Bloomberg

Mortgage rates are back on the rise, not exactly a good sign for new home sales as homebuilders margins collapse…

Source: Bloomberg

Finally, new-home supply increased to 456,000 from the prior month, the most in over a year.

Source: Bloomberg

Is reality about to set in for the US housing market? Or will Powell step in (with a banking crisis excuse) to save all that ‘wealth’?

Of course, mortgage rates rising 149% under Biden might have something to do with it.

Simply Unaffordable! Home Prices In 575 Counties Show Housing Unaffordable In 99% Of Counties (Home Prices UP 33% Under Biden, Mortgage Rates UP 149%, Average Weekly Income UP 3% In January)

Simply unaffordable should be the campaign song for the upcoming election.

Housing under Bidenomics is simply unaffordable for many Americans since home price growth has outstripped average income for most Americans.

 ATTOM Data Services examined the median home prices last year for roughly 575 U.S. counties and found that home prices in 99% of those areas are beyond the reach of the average income earner. And to add insult to injury, 30-year fixed mortgage rates just rose back above 7%.

Although the Attom data is from Q3 2023, not much has changed. Under Biden (and his HUD Secretary Marcia Fudge, Fed Chair Jay Powell, and Treasury Secretary Janet Yellen), I did manage to find TWO AFFORDABLE areas to live: Shreveport Louisiana and Midland/Odessa Texas. The housing market remains unaffordable for millions of Americans.

I am not surprised given that the Case-Shiller National home price index has risen by 32.7% under Biden while mortgage rates are up … 149%.

Here is a chart of home prices against M2 Money.

Doctor, Doctor (Yellen), please stop the insane spending and borrowing!

Washington DC’s Reverse Robin Hood Model: Steal From The Middle Class And Bottom 50% And Give To The Elites (The New Forgotten Man)

Robin Hood is a legendary heroic outlaw originally depicted in English folklore and subsequently featured in literature, theatre, and cinema. Traditionally depicted dressed in Lincoln green, he is said to have stolen from the rich to give to the poor. Politicians have created the new “Forgotten Man” by Amity Shlaes.

However, politicians like Joe Biden, Chuck Schumer, Mitch McConnell are “reverse Robin Hoods” dressed in business suits (although Jamie Raskin D-MD is often seen wearing a bandana and John Fetterman D-PA is often seen in a hoodie and shorts). They instead enact policies that steal from the middle class and give to themselves and the donor class. How do you think that politicians like the Bidens, Obama, Clintons and AOC go in broke and emerge as multi-millionaires?

Part of the problem with the reverse Robin Hood model is the Federal Reserve itself. They helped punish the 99% with inflation due to excessive money printing. The share of total net worth held by the top 1% has exploded since The Fed’s rate cuts following the 2001 recession. The Fed has never lowered rates since to levels we saw prior to the 2001 recession, although The Fed is getting close.

Then we have the green energy hysteria (which like pornography excites the brain and distorts logical thinking). Wealthy donors have received a massive windfall (along with China) from Biden/Congress’s green energy spending (scam). The middle class and low-wage workers are now playing higher utility bills (sacrificial lambs on the altar of global warming … or cooling) along with seeing gasoline and diesel prices far higher than before Biden was elected. Gasoline prices are up 46.25% under Biden and diesel prices are up 55.6%.

I like this chart of the distribution of household wealth by income group. The top 1% (the elite Pelosi class, are getting wealthier and wealthier. The 90-99% group are doing well, but not as well as the top 1%. The bottom 50% (who the Washington DC elite class seems to have forgotten about)

Here is a table of the same data.

Then we have the exploding mortgage rates under Biden. Rates are up over 155% under Old Grandad Joe Biden. Another shot through the heart of the middle class. And Washington DC is to blame.

Speaking of Washington DC millionaire elites, I want to share this picture with you. Hillary Clinton is NOT Robin Hood but an example of a REVERSE Robin Hood.

Escape From New York And LA! NY, California And Illinois Seeing Net Out-migration Due To High Taxes/Regulations, Crime And High Housing Costs (Moving To Florida, Texas And The Carolinas)

Director John Carpenter had two films, “Escape From New York” and the less popular “Escape From LA.” Carpenter’s vision of a dystopian future with Manhattan as a prison island, filled with criminals and Los Angeles as a just a weird, dystopian area filled with gangs and sleazebags. Apparently, Carpenter read George Orwell with a splash of Franz Kafka in writing these films which are sadly becoming a reality. With Biden’s immigration “policy” (let everyone in without checking who they are) is a blueprint for a new film “Escape From The USA!” I wonder if Kurt Russell is available to reprise his role as Snake Plisken?

Like John Carpenter foretold, both California and New York are leading the nation in outmigration. BAD crime, high taxes, insane politicians and droves of illegal immigrants are making living in those state very difficult. Throw in the NY AG Letisha James and Judge Engmoron’s Marxist show trials of Donald Trump for doing absolutely nothing wrong and many people are are plain fed up. Illinois under the “leadership” of Chicago Fats (Governor J.B. Pritzker) and horrendous Chicago mayor Brandon Johnson (who makes former Chicago Mayor Lori Lightfoot almost look reasonable) is third in the nation for outmigration. Once again, high taxes, high crime, lots of illegal immigrants, and inane policies are causing people and businesses to flee. John Carpenter should do a film “Escape From Chicago.”

Where are people fleeing to? Florida leads followed by Texas, then the Carolinas, and Tennessee. Generally, these states have lower taxes, lower crime, and less intrusive politicians. E.g., no Gavin Newsom (CA), no Kathy Hochul (NY) and no J.B. Pritzker (IL).

Another reason that people are fleeing New York and California is cost of living. To be sure, Bidenomics (an insidious malinvestment plan, aka, donor-nomics) has made matters worse. Home prices (blue line) and rents (red line) has soared and are far higher than the grow in average earnings (green line). Los Angeles is wonderful if you are a celebrity like Steve Spielberg, Tom Hanks and The Office’s Jenna Fischer where you live in a mansion and are protected by the police force. But other parts of Los Angeles are filled with the homeless, illegal immigrants, rampant crime, and is simply unlivable.

Escape From New York is appropriate for today’s situation. An idiot Mayor and Governor, illegals crowding the streets and hotels, crime through the roof, illegals attacking police. And Joe Biden acting like The Duke of New York, A number One! I guess the closest person we have to Snake Plisken is Donald Trump.

On a related note, Georgia is still seeing positive net in-migration. But as the Fani Willis corruption scandals unfolds and their weak-kneed Governor Kemp does nothing, we have yet another film John Carpenter could make “Escape From Atlanta.” Or a computer game like “Call of Booty.”