The US midterm elections are Tuesday. I was denied an absentee ballot for some reason, but I will get my disabled body over to the local precinct to cast my ballot.
Fortunately for Democrats, the next inflation report is not due out until November 10th. Because the forecast for the next inflation report is ugly.
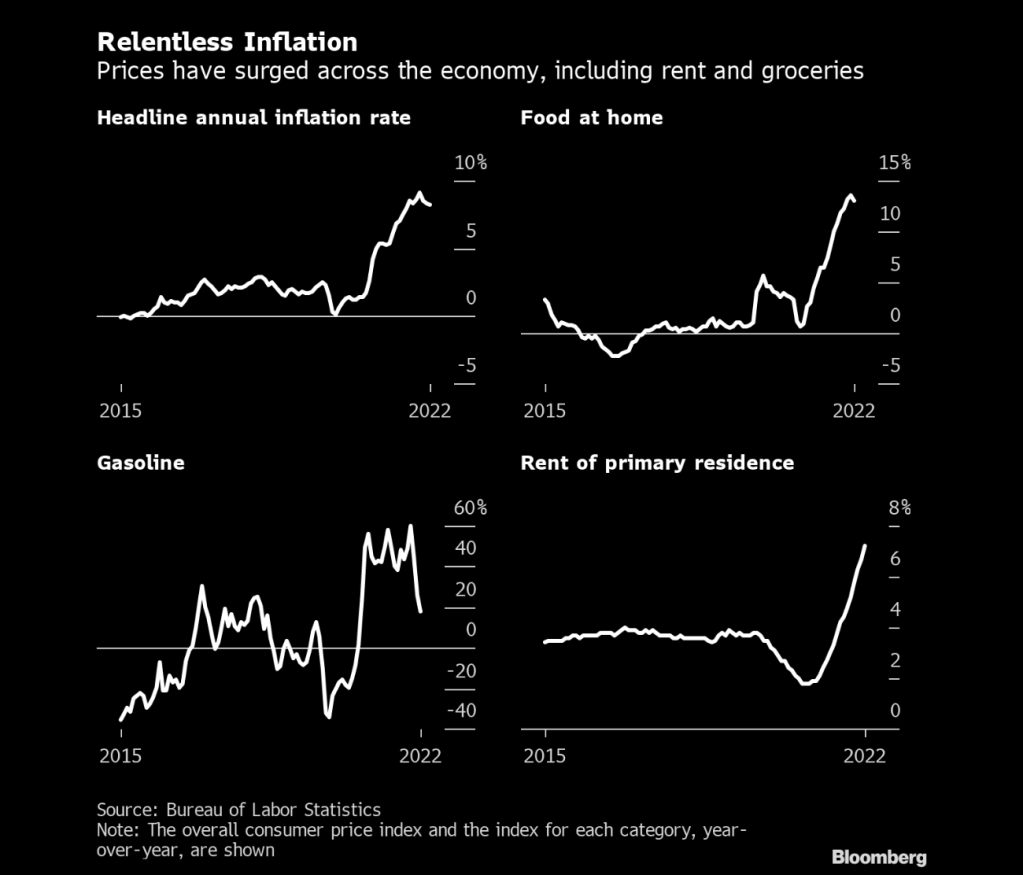
Headline CPI YoY = 7.9%
Core CPI YoY = 6.5%
These numbers are slightly lower than the last inflation report, but Americans are still suffering mightily under Biden’s Reign of Error.
Diesel fuel prices, the lifeline of the food industry, is up 102% under Biden’s mandates with the inventory of diesel fuel down 36%.
Inflation is relentless like Jason from Halloween.
Private payrolls added 233k jobs in October, which is a -27% decline from September’s revised private payroll figures.
The good news? Average hourly earnings growth is still positive, but fell to 3.7% YoY. But with inflation raging at 8.2% YoY, workers are getting clobbered by inflation.
Here is the rest of the story.
The Fed is now green-lighted to raise rates even higher.
Biden’s campaign promise was to unite rather than divide. But Biden has morphed into Gustaf Holst’s, Mars – Bringer of War! Both domestically and in the Ukraine.
The Bank of England followed the Fed’s 75 basis-point increase with an equivalent hike on Thursday, but strongly pushed back against market expectations for the scale of future increases, warning that following that path would induce a two-year recession. The pound fell 1.8% to $1.1183.
Stocks and bonds fell as Jerome Powell’s warning that the Federal Reserve would raise interest rates more than previously anticipated sapped risk appetite. The dollar gained.
Futures on the S&P 500 fell 1% in the wake of Wednesday’s 2.5% drop. The selloff spread to Europe and Asia, where China’s affirmation of its Covid-Zero stance dashed hopes of a reopening. Lumen Technologies Inc., Peloton Interactive Inc., Moderna Inc. and Qualcomm Inc. tumbled in premarket trading, while Etsy Inc. and EBay Inc. rose.
So, the BofE, Fed and ECB are back to 2008/2009 era central bank rates.
But the US Fed is slow to shrink its enormous balance sheet.
US 30-year mortgage rates are above 7% as The Federal Reserve slowly withdraws its Covid-related monetary stimulus and attempt to combat near 40-year highs in inflation under Biden (aka, Bidenflation).
However, the US Treasury 10-year yield is down -12 basis points this morning.
And we have an important predictor of recession, the Treasury 10yr-3mo yield curve.
And if the Republicans win The House (and maybe the Senate) at the midterms, Biden can blame Republicans for the recession.
The next Federal Reserve Open Market Committee (FOMC) meeting in on Wednesday, November 2nd. Let’s see what The Fed does with its BIG GREEN BAG … OF MONEY.
As I set here on Sunday morning waiting to see how the Cleveland Browns will lose to cross-state rival Cincinnati Bengals, I see that both the US Treasury 10yr-2yr and 10yr-3mo yield curves are inverted (below zero).
Core inflation (CPI less food and energy) YoY (blue line) was only 1.3% in February 2021 shortly after Biden was sworn-in as President and is now 6.6% in September 2022. That is over a 400% increase in core inflation!
We have this tantalizing headline on Bloomberg:
Goldman Sachs Now Sees Fed Rates Peaking at 5% in March By Simon Kennedy(Bloomberg) —
Goldman Sachs Group Inc. economists said they now expect the US Federal Reserve to raise interest rates to 5%, higher than previously predicted.
The central bank will lift its benchmark rate to a range of 4.75% to 5% in March, 25 basis points more than earlier expected, economists led by Jan Hatzius wrote in an Oct. 29 research report.
The route to the new peak includes increases of 75 basis points this week, 50 basis points in December and 25 basis points in February and March, they said.
The economists cited three reasons for expecting the Fed to hike beyond February: “uncomfortably high” inflation, the need to cool the economy as fiscal tightening ends and price-adjusted incomes climb, and to avoid a premature easing of financial conditions.
Well, not exactly earth-shattering. Fed Funds Futures data point to a peak of near 5% (4.905%) for the May 2023 FOMC meeting, so Goldman Sachs is calling for an earliest peak at the March 2023 FOMC meeting,
Regardless of what Goldman Sachs thinks, Fed officials are expecting a peak in 2023 followed by a decline to 2.5%.
Brainard and Bostic are the only “doves.” Which is silly because Chicago’s Evans is a perma-dove. Let’s see how the Dots Plot changes at the November 2nd meeting.
America’s distressed debt pile is biggest since September 2020.
US Q3 GDP numbers are out and they are … meh. Only Biden and Karine Jean-Pierre would cheer about 1.8% real GDP growth. At least real GDP growth wasn’t negative!
Real GDP rose 2.6% after -0.6% in Q2 and 1.8% YoY. But the most interesting data bit is the GDP Price Index. It fell to 4.1% in Q3 down from a whopping 9.0% in Q2.
But wait! Also declining at a stall speed is M2 Money.
And brace yourself for a cold winter. Heating oil is UP 162% under Biden.
As the midterm elections get close, the news for Americans gets worse.
On the housing/mortgage front, Bankrate’s 30-year mortgage rate (yellow line) just hit 7.20%, the highest since 2000. Also, the US Treasury 10yr-3mo yield curve (white line) inverted, historically a precursor to recession, before barely climbing back above 0%.
Meanwhile, M2 Money growth has collapsed to the lowest level since 2010.
US GDP numbers are due out at 8:30AM EST for Q3. The numbers are expected to show slow growth (around 2.4%) with rapid inflation (5.3%). While the GDP numbers are better than Q2’s numbers, they are still pretty lousy.
One reason is diesel fuel prices are up 102% under Biden’s Reign of Error. While inventory of diesel fuel down -37%. Meanwhile core inflation is up from a measly 1.3% to a whopping 6.6% at the latest inflation report.
Introducing Biden’s Thanksgiving dinner … in a can to cope with rising prices.
Just kidding. This is too clever for the clueless Biden Administration. But Karine Jean-Pierre might get as confused as Joe Biden and repeat it as one of the ways that The Biden Administration is helping consumers.
As I told my Chicago, Ohio State and George Mason University finance and real estate students, repeatedly, “Watch out when The Fed begins to tighten monetary policy. It will be a bloodbath for taxpayers.”
Well, here we are. I argue that Biden’ green energy knucklehead policies are driving inflation, or it could be the insane level of Federal spending that Obama economist Larry Summers warned us about, or rising wages (in part due to Federal spending) is to thank for inflation. Or all of the above.
Regardless of the cause, the bond market is enduring its worst selloff in a generation, triggered by high inflation and the aggressive interest-rate hikes that central banks are implementing. Falling bond prices, in turn, mean paper losses on the massive holdings that the Fed and others accumulated during their rescue efforts in recent years.
Rate hikes also involve central banks paying out more interest on the reserves that commercial banks park with them. That’s tipped the Fed into operating losses, creating a hole that may ultimately require the Treasury Department to fill via debt sales. The UK Treasury is already preparing to make up a loss at the Bank of England.
The Reserve balance has crashed into negative territory.
And Fed losses are skyrocketing.
Agency MBS prices are up today, but are down since August 2022. But risk measures duration and convexity are zooming upwards.
Alarm! US home prices are decelerating as inflation rages and The Fed tightens.
Home price growth in the US slowed the most on record as a doubling of borrowing costs (thanks to the US Federal Reserve) has sapped demand.
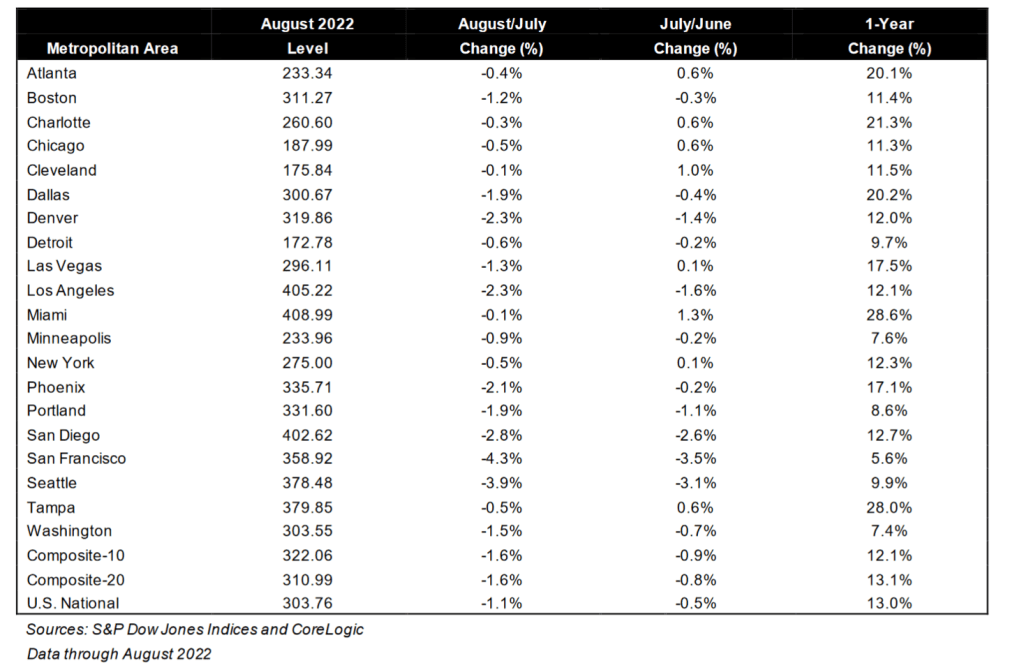
A national measure of prices increased 13% in August from a year earlier, but is down from 20.79% in March, the S&P CoreLogic Case-Shiller index showed Tuesday. That’s the biggest deceleration in the index’s history.
The housing market has started to slump as the Federal Reserve hikes interest rates to curb the hottest inflation in decades. Even with the deceleration, prices remain high compared to last year. Coupled with mortgage rates that are edging closer to 7%, many would-be buyers have been shut out, while some sellers have retreated.
While 13% growth sounds good, it is not good for renters looking to buy a home.
According to S&P/CoreLogic/Case-Shiller, Southern (red) cities Atlanta, Charlotte, Dallas, Miami and Tampa all still grew at over 20% YoY. Other cities like blue cities Detroit, Minneapolis, Portland, San Francisco, Seattle and Washington DC are grew at UNDER 10% YoY.
On related news, I always said in my classes that +/- 10 basis point in the US Treasury yield is a big deal. This morning, the US Treasury 10-year yield is DOWN -16.1 bps. In fact, the 10-year yields are down across the board globally.


You must be logged in to post a comment.