The elite class “economists” (aka, cheerleaders) are meeting at Jackson Hole, Wyoming this week. But while they are planning our future, the revision to the miserable Q2 Real GDP report came out this morning.
So, the second pass at measuring Real GDP produced a slightly better number (-0.6% vs -0.9%).
But the GDP PRICE index revision worsened from 8.7% to 8.9%. Look at REAL personal consumption (yellow line) as M2 Money growth slows.
Let’s see how things go at The Fed party at Jackson Hole, Wyoming. It is appropriate for The Fed to hold their party/meeting at Jackson Hole (Teton County) since it has the highest concentration of wealth per household than any other county in the nation.
Biden is the opposite of the miserly Scrooge McDuck. He gives billions to Ukraine and spends trillions on various Federal projects without batting an eye as to how and who is going to pay for all the spending. And Biden’s latest election pandering is no different.
Speaker Pelosi claims that Biden’s bold action on student loan forgiveness is a strong step in Democrats’ fight to … make college even MORE expensive and lead to colleges hiring even MORE administrators (aka, apparatchiks) making colleges even MORE bogged-down in red tape.
And Speaker Pelosi, the costs of Biden’s midterm election buy of votes is estimated to be $300 BILLION. And a report from the Brookings Institution observed that one-third of student debt is owed by the wealthiest 20% of households, while only 8% is owned by the bottom 20%.
So, Biden is letting AOC write-off $10k of her student loan obligation. Bear in mind that the $10k forgiveness is taxed by The Federal government as income.
It looks like The Fed will have to expand the M2 Money supply to pay for “Billions Biden’s” spending spree.
US mortgage applications just hit the lowest levels in 22 years, January 2000 as The Federal Reserve continues monetary tightening to combat Bidenflation.
Mortgage applications decreased 1.2 percent from one week earlier, according to data from the Mortgage Bankers Association’s (MBA) Weekly Mortgage Applications Survey for the week ending August 19, 2022. The Refinance Index decreased 3 percent from the previous week and was 83 percent lower than the same week one year ago.The seasonally adjusted Purchase Index decreased 1 percent from one week earlier. The unadjusted Purchase Index decreased 2 percent compared with the previous week and was 21 percent lower than the same week one year ago.
MBA mortgage applications just declined to their lowest level in 22 years (January 2000) as The Fed has begun raising rates to fight inflation caused by 1) excessive monetary stimulus since late 2008, 2) Biden’s green energy policies driving up transportation costs, 3) distortionary Federal spending (e.g., Covid relief, infrastructure bills and now green energy/IRS spending by Biden/Pelosi/Schumer).
Here is the data summary for the latest MBA applications report.
Fed Chair Jerome Powell shrinking The Fed’s balance sheet.
The phrase “crossing the Rubicon” is an idiom that means that one is passing a point of no return. Its meaning comes from allusion to the crossing of the river Rubicon by Julius Caesar in early January 49 BC.
Indeed, the US crossed the FISCAL Rubicon in Q4 2012. That is when US Treasury Public Debt outstanding exceeded Real GDP. And the gap has been growing ever since.
In case you were wondering why M2 Money Velocity is so low, it is because the US is in constant crisis management mode as an excuse to spend trillions of dollars …. that generates progressively lower real GDP.
They built this nation on MMT (Modern Monetary Theory) which translates to the Federal government and Federal Reserve just wanting to spend trillions and trillions. Since 2005 (the peak of the housing bubble), the US Federal Reserve has increased the M2 Money stock more than real GDP growth in almost every quarter.
I remember when macroeconomists used to say “Everything is beautiful … as long as M2 Money growth is LESS than real GDP growth.” But we have apparently shifted to MMT when Everything is beautiful as long as there is a crisis and Congress can spend trillions.
Now Biden/Congress are spending billions in trying to reduce inflation (seriously, only in Washington DC would they think that massive spending bills would REDUCE inflation).
Dear Mr. Fantasy, play us a tune, something to make us all happy (like hitting 2% inflation WITHOUT crashing the economy). Do anything take us out of this gloom (caused by The Fed, Biden’s energy policies and Federal spending). Sing a song, play guitar, Make it snappy. Or in the case of housing, make it crappy.
(Bloomberg) — Federal Reserve Bank of Richmond President Thomas Barkin said the central bank was resolved to curb red-hot inflation, even if that meant risking a US economic recession.
“We’re committed to returning inflation to our 2% target and we’ll do what it takes to get there,” Barkin said Friday during an event in Ocean City, Maryland. He said that this could be achieved without a “tremendous decline in activity” but acknowledged that there were risks.
“There’s a path to getting inflation under control but a recession could happen in the process,” he said.
The US central bank hiked interest rates by 75 basis points in July for the second straight month as policy makers tackle inflation that’s running near 40-year highs. Fed officials speaking in recent days have said more rate increases are needed, but they are still deciding how big to move at their next policy meeting.
St. Louis Fed President James Bullard, one of the most hawkish policy makers, on Thursday urged another 75 basis-point move while Kansas City’s Esther George struck a more cautious tone.
Well, The Fed (aka, Der Kommissars) let the monetary stimulus blow out of control since 2000.
With the 2001 recession, The Fed crashed the target rate (white line) causing home price growth (blue line) to soar. Then The Fed decided that the economy was overheated and cranked up their target rate. This sudden rise in The Fed’s target rate helped to slow/crash housing prices. Resulting in … a frantic decrease in the target rate (late 2007- late 2008) and the adoption of asset purchases of Treasury Notes/Bonds and Agency Mortgage-backed Securities in late 2008.
The Bernanke/Yellen “loose as a goose” policies from late 2008 to Feb 2018 created a total mess. Bernanke/Yellen raised the target rate only one before Trump was elected President, and 8 times AFTER Trump was elected. And Yellen’s Fed began to let the balance sheet shrink a bit before Covid struck in early 2020. And with Covid came another massive expansion of The Fed’s Balance Sheet WHICH HAS NOT YET BEEN WITHDRAWN (despite Fed talking heads saying it would be reduced).
Here we sit with The Fed NOW trying to extinguish inflation (yellow line) by raising their target rate (white line) but NOT shrinking the balance sheet (orange line).
Wonder why this is a horrible homeless problem in the US, particularly in California? While Stanford University has an excellent study of the causes of California’s homeless problem, there is another cause of homelessness … The Federal Reserve’s insane monetary policies since late 2008. The Case-Shiller National Home Price Index is 65% higher in May than during the calamitous home price bubble of 2005-2007, helping to exacerbate the homeless problem.
One of the many problems created by the reckless Bernanke/Yellen/Powell monetary policies is the M2 Money Velocity is near an all-time low making a return to “easy money policies” far more difficult.
I won’t post any photos of the homeless encampments in Los Angeles since it is very sad. But here is a photo of the Dunder-Mifflin paper company “office” on Saticoy Street. The point is that thanks to The Federal Reserve’s loose monetary policies, housing is unaffordable for millions of households forcing many to live on the streets.
Figure 2: Median Rent for a Two-Bedroom Apartment, California, 2022
And a point of trivia. The Office’s Charles Miner (played by the GREAT Idris Elba) was allegedly hired from Saticoy Steel. The Dunder-Mifflin paper company site was on Saticoy Street in sunny LA, not Scranton PA.
Good luck to The Federal Reserve in combating inflation without causing a recession.
In honor of Wolfgang Peterson who passed away yesterday, the Director of the classic WWII movie “Das Boot!” …. ALARM!
Sales of previously owned US homes fell for a sixth straight month in July in the latest indication of how high borrowing costs and waning demand are propelling the housing market’s rapid decline. In fact, existing home sales fell -19% YoY in August.
Contract closings fell 5.9% in July to an annualized 4.81 million, the weakest since May 2020, figures from the National Association of Realtors showed Thursday. The median estimate called for 4.86 million in a Bloomberg survey of economists. Sales fell 22.4% from a year ago on an unadjusted basis.
The nearly 26% decline in previously owned home sales since January marks the steepest six-month plunge in records back to 1999 and underscores a housing market that’s reeling from elevated mortgage rates and prices. The industry is also experiencing a slowdown in construction, and more buyers are backing away from deals.
Weaker demand has led to a pickup in inventory, which may help to cool home prices in coming months.
The median price of existing home sales growth fell to 10.55% YoY as M2 Money growth slows.
As The Federal Reserve fights inflation (caused by too much Fed stimulus for too long) and Federal energy policies, we are seeing mortgage rates rising and the housing market decaying.
1-unit (single family detached) housing starts dropped -18.5% YoY in July as mortgage rates rose in 2022. Note the impact of the Covid stimulus (green line) and the resulting surge in housing starts in April 2021, but housing starts have decayed as M2 Money growth slows.
5+ unit (apartment) starts were down -10% MoM in July, but at least permits for apartments rose +2.51% MoM.
Well, we at least know why the NAHB Homebuilder index sucked wind so badly yesterday.
The National Association of Home Builders Market Index slipped into darkness … that is, dropped below 50 to 49 in August as The Federal Reserve continues to tighten its uber-loose monetary policy, resulting in rising mortgage rates.
Note the plunge in the NAHB market index as mortgage rates began rising.
The US Empire State Manufacturing Survey General Business Conditions, that is. It just crashed and burned (-31.3) in August, the lowest reading since The Great Covid Shutdown and before that The Great Recession.
The inverted US Treasury yield curve (10Y-2Y) is beginning to make sense.
The 2020 Covid outbreak led to a massive (and generally awful) reaction. There were economic shutdowns that caused extensive damage (particularly to small firms), but it was the massive overreaction by The Federal government in terms of Covid relief and The Federal Reserve’s expansion of the money supply that caused considerable damage.
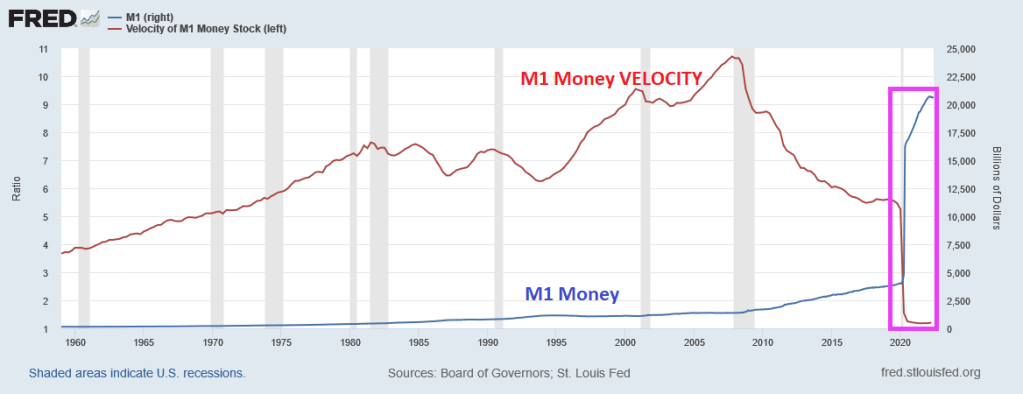
One truly horrific chart is that of M1 Money and M1 Money Velocity (M1/GDP). M1 Money surged with Covid driving M1 Money Velocity down to levels never seem before.
The broader measure of money, M2, isn’t as dramatic, but we also see that M2 Money VELOCITY has plunged to levels never seen before.
What does low money velocity indicate? Simply put, The Fed is printing trillions of dollars, but GDP isn’t moving much. But that won’t stop Congress from spending (and using The Fed to buy its debt).
So, here we sit. This morning, the US Treasury yield curve (10Y-2Y) remains inverted. This AM, the curve inverted another -.591 basis points to -42.725, a sign of impending recession.
Yes, we are living through Jay Powell’s famous chili episode where money velocity is near historic lows and we have an inverted yield curve.
BTW, congratulations to Will Zalatoris (aka, Happy Gilmore’s caddy) for his first PGA Tour victory at the FedEx St. Jude Championship!


You must be logged in to post a comment.