The cumulative number of jobs reported each month was 1,255,000 less than previously thought, with new seasonal and census data affecting total employment estimates, according to data from the BLS calculated by the Daily Caller News Foundation. The huge downward revisions are in spite of a 115,000 upward revision in December, the only month that saw an upward revision to the employment level in 2023.
The biggest revision was for March, which was revised down by a total of 266,000 jobs, followed by January at 234,000 and April at 205,000, according to the BLS. The lowest downward revision was in November, with only 2,000, followed by 11,000 in October.
“Revisions are a normal part of the reporting process, but large changes, or adjustments that consistently move in the same direction, are not normal,” E.J. Antoni, a research fellow at the Heritage Foundation’s Grover M. Hermann Center for the Federal Budget, told the Daily Caller News Foundation. “Instead, they’re indicative of something problematic with the BLS’ methodology. That can happen when market conditions change drastically enough to be outside of the assumptions used in their models.”
The revisions are due in part to an overestimate of the number of jobs in the U.S. economy in January 2023 at 155,007,000 instead of the revised 154,773,000, according to the BLS. The job level increased to a revised 157,347,000 by December, totaling an increase of 2,340,000 positions in the year.
The most recent jobs report in February also released an adjustment to the total jobs level, lowering March by 266,000 positions, according to the BLS. The jobs totals were also adjusted to recent census data, throwing off past estimates.
Recent years have not seen the same high downward revisions as 2023, with 2022 only seeing negative revisions in five months, equating to a downward revision of 66,000 for the year. March was the only month that was revised down in 2021, with the total number for the year being revised up by nearly 2 million as the country recovered from the COVID-19 pandemic.
Growth in government positions has bolstered recent job numbers, adding a total of 601,000 jobs to the U.S. economy in the past 12 months. The gains have led to an all-time record for government positions at 23,091,000, outdoing a surge in hiring from the 2010 census collections.
“When the economy was rapidly deteriorating at the onset of the Great Recession, the BLS repeatedly and consistently overestimated job levels, which then had to be revised down,” Antoni told the DCNF. “The worsening economic conditions fell outside of the assumptions used by the BLS statisticians, so the estimates became inaccurate. There could be similar problems today due to fallout from the government-imposed recession in 2020 because the labor market still hasn’t recovered.”
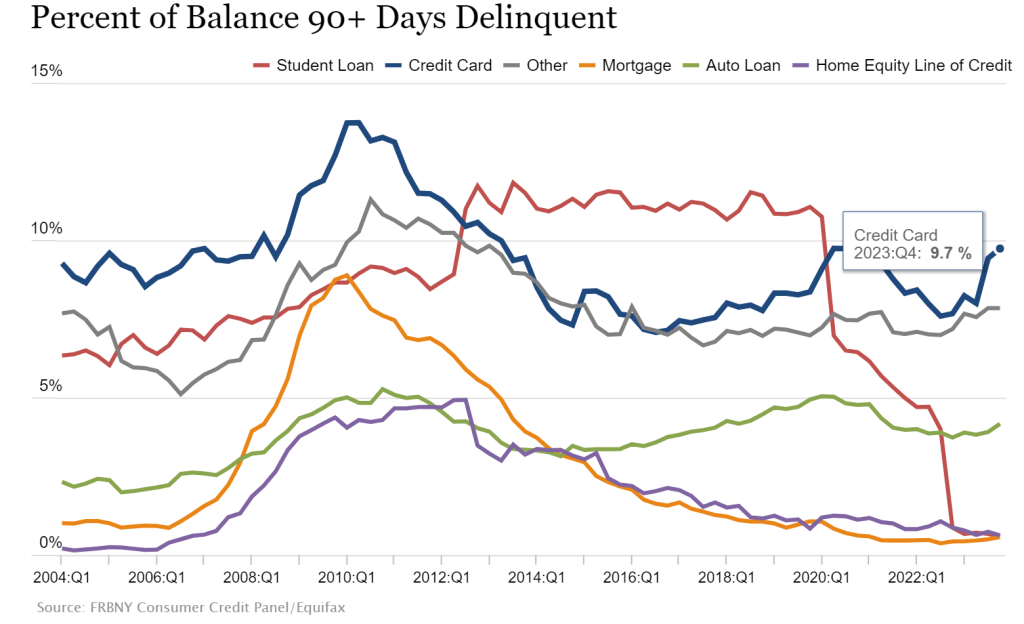
Credit card delinquecies (90+ days) rose to almost 10% in Q4 2023.
Credit card delinquencies surged more than 50% in 2023 as total consumer debt swelled to $17.5 trillion, the New York Federal Reserve reported Tuesday.
Debt that has transitioned into “serious delinquency,” or 90 days or more past due, increased across multiple categories during the year, but none more so than credit cards.
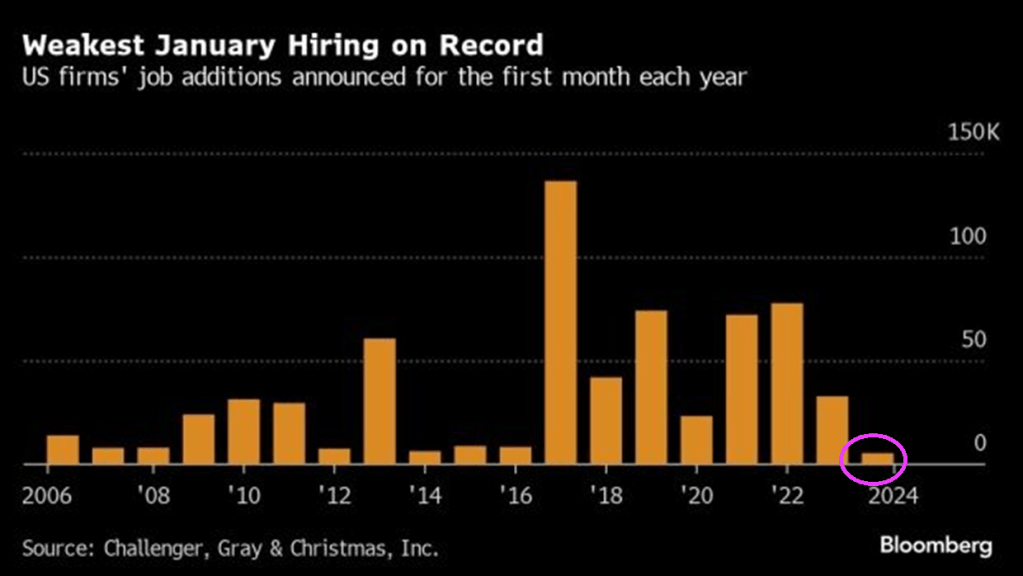
Rising credit card delinquencies combined with the worst job additions in January on record.
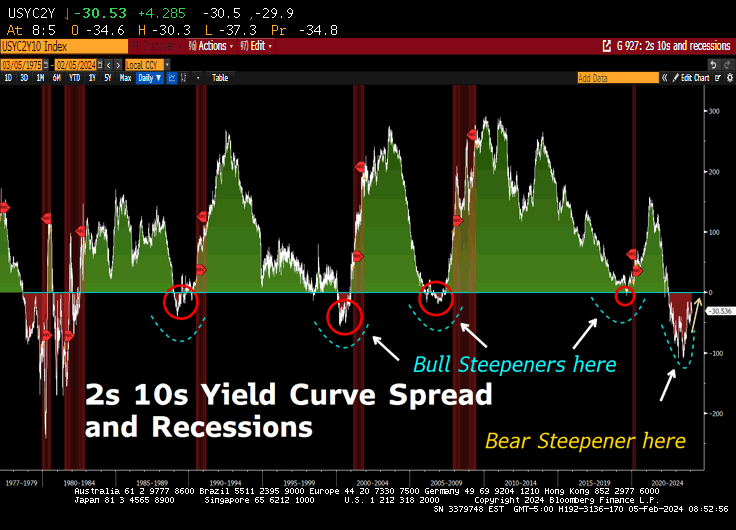
But at least the 10Y-2Y US Treasury yield curve is ALMOST flat (h
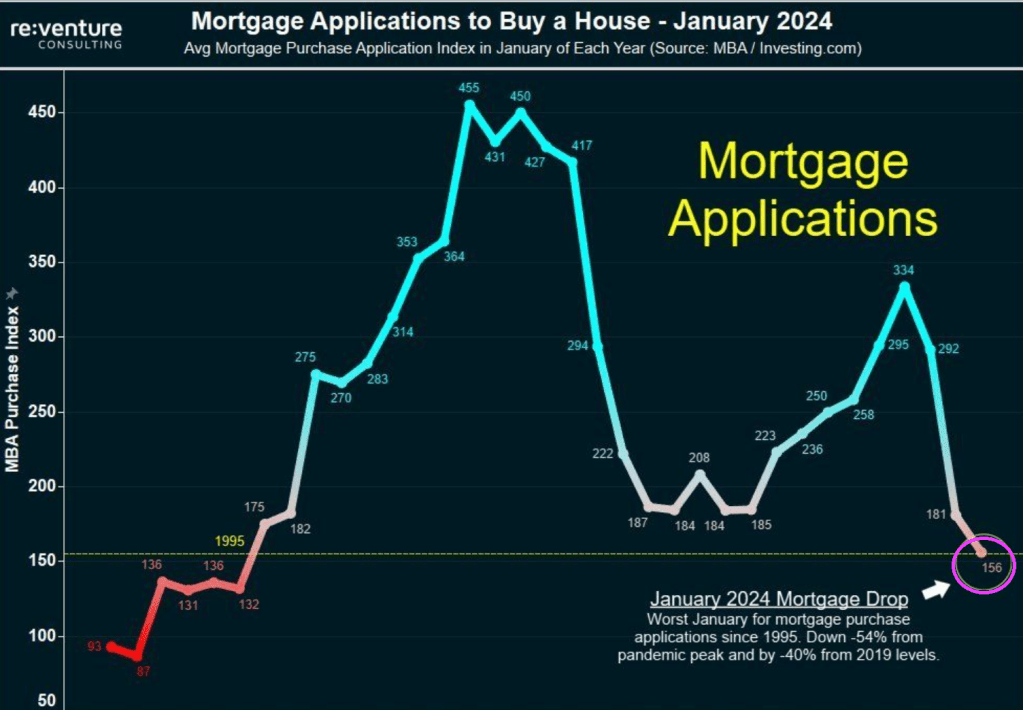
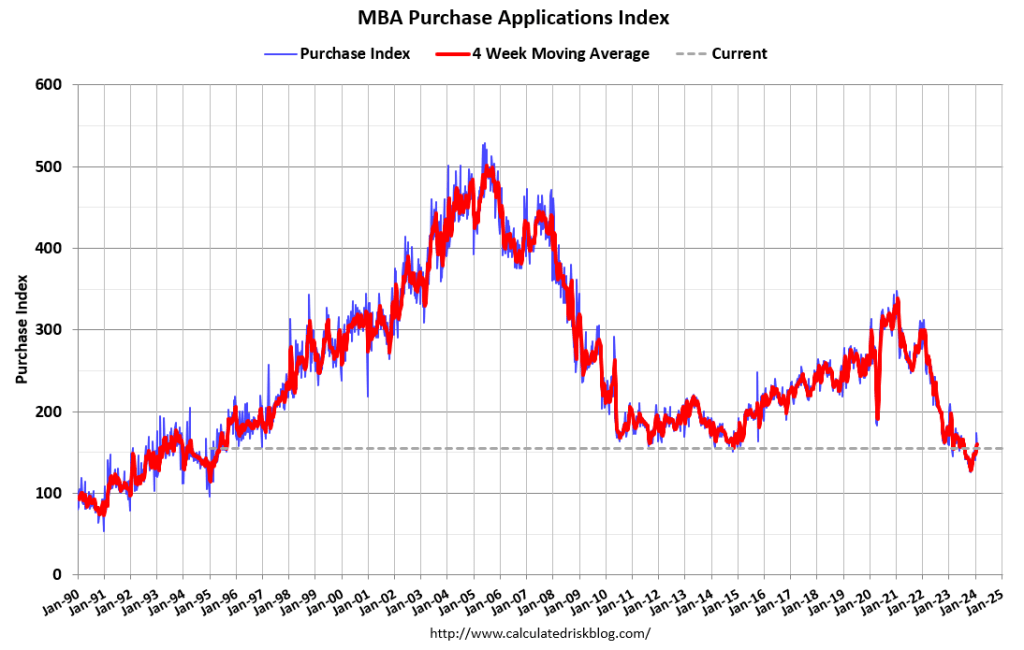
Yikes! Bidenomics is a disaster! MBA mortgage purchase applications are down 54% from Pandemic Peak. I was going to play “The Wreck of the Edmund Fitzgerald” by Gordon Lightfoot and rename it “The Wreck of The US Economy.”
Mortgage demand fell to a new 30-year low in January 2024, down 54% from the pandemic peak. Mortgage demand is down 14% over the last year and 40% from pre-pandemic levels.
Mortgage applications decreased 7.2 percent from one week earlier, according to data from the Mortgage Bankers Association’s (MBA) Weekly Mortgage Applications Survey for the week ending January 26, 2024. Last week’s results included an adjustment to account for the MLK holiday.
The Market Composite Index, a measure of mortgage loan application volume, decreased 7.2 percent on a seasonally adjusted basis from one week earlier. On an unadjusted basis, the Index increased 8 percent compared with the previous week. The Refinance Index increased 2 percent from the previous week and was 3 percent higher than the same week one year ago. The seasonally adjusted Purchase Index decreased 11 percent from one week earlier. The unadjusted Purchase Index increased 6 percent compared with the previous week and was 20 percent lower than the same week one year ago.
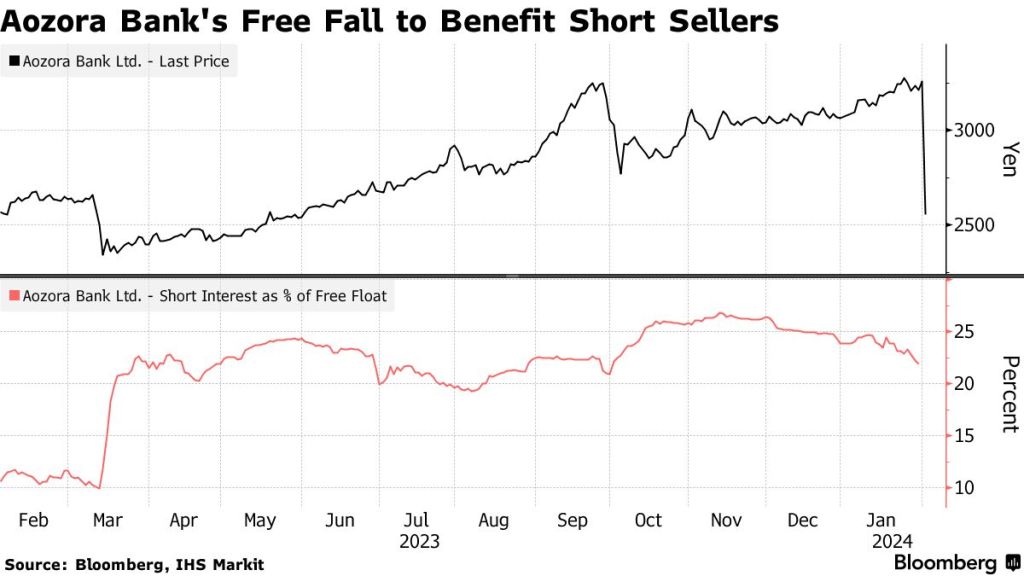
Like rows of falling dominoes, Aozora Bank, the 16th largest in Japan by market value, saw its shares plunge by 20% on Thursday after reporting a net loss of 28 billion yen ($191 million) for the fiscal year. This was in stark contrast to its earlier projection of a 24 billion yen profit.
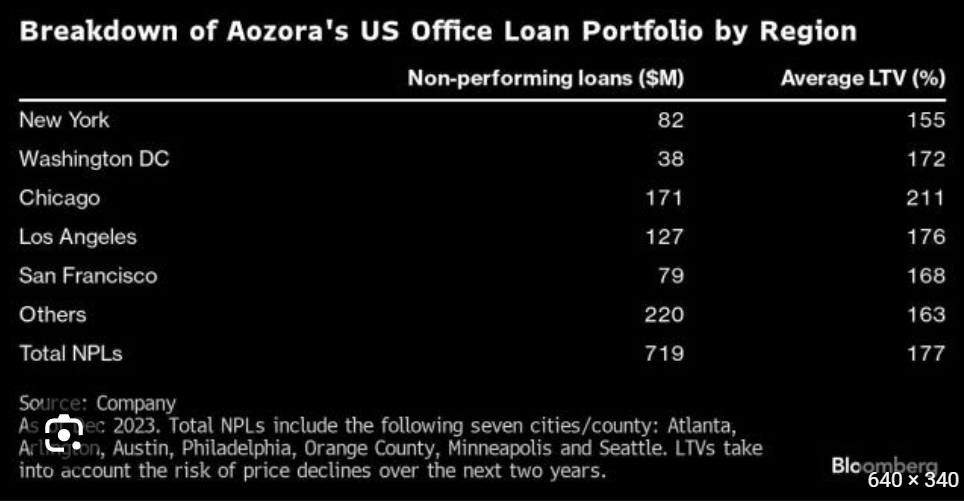
Aozora wrote down the value of its non-performing office loans by 58%, including a 63% reduction in Chicago and between 51% and 59% in New York, Washington D.C., Los Angeles, and San Francisco – all of these cities are plagued with violent crime and controlled by radical Democrats.
In total, the bank’s US office loans were about 6.6% of its portfolio, or approximately $1.89 billion. It said 21 office loans worth $719 million were classified as non-performing, and as a result it increased its loan-loss reserve ratio on US offices to 18.8% from 9.1%.
“It’s a shock,” said Tomoichiro Kubota, a senior market analyst at Matsui Securities Co., adding, “The expectation was the worst was over and that the bank had set aside enough provisions.” Guess not.
Far markets, this was another flashing red warning sign that not only is a tsunami of office loan defaults still on the horizon, but that banks continue to be woefully underprovisioned for the coming bloodbath.
“This is a huge issue that the market has to reckon with,” said Harold Bordwin, a principal at Keen-Summit Capital Partners LLC in New York, specializing in renegotiating distressed properties.
Bordwin said, “Banks’ balance sheets aren’t accounting for the fact that there’s lots of real estate on there that’s not going to pay off at maturity.”
Besides New York Community Bancorp and Aozora Bank, Deutsche Bank noted in fourth-quarter results:
“Interest rate environment remains key driver for refinancing risk and potential [credit-loss provisions] in 2024 especially in office, with further drivers being ongoing sponsor support and expiring rental agreements.”
Fed chair Powell delivered bad news for the CRE world in yesterday’s FOMC meeting, warning that a March rate cut isn’t happening (absent a shock of course). Perhaps most notably, the Fed removed the following sentence from the FOMC statement: “The US banking system is sound and resilient.” Cynics asked why the Fed no longer sees “the US banking system is sound and resilient” – is it a signal of rumblings in the economy near-term, or was it just a lie before, and now that bank dominoes are again falling, will Powell be forced to trot it back out?
Where will this lead? Likely more bank and pension fund bailouts. You didn’t really believe that hype about the Dodd-Frank banking legislation that there will never be another bank bailout did, you??
Constitution Avenue in Washington DC is actually becoming Tobacco Road. No, not the dysfunctional family of Georgia sharecroppers during the Great Depression, but the Treasury Borrowing Advisory Committee (TBAC).
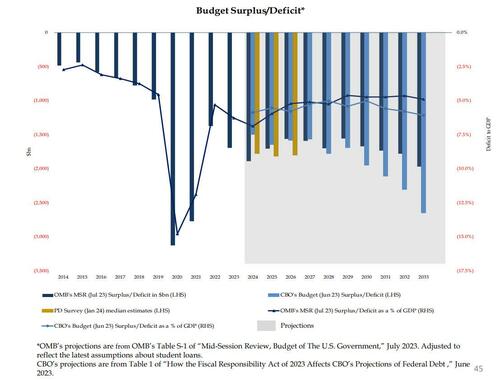
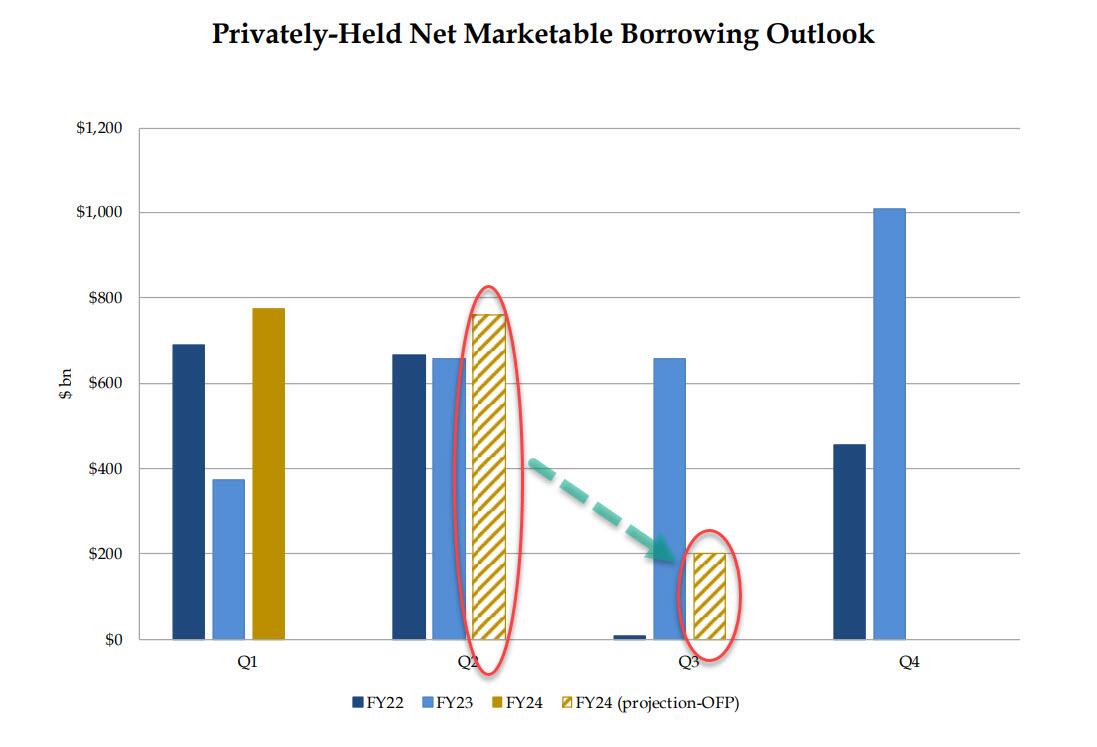
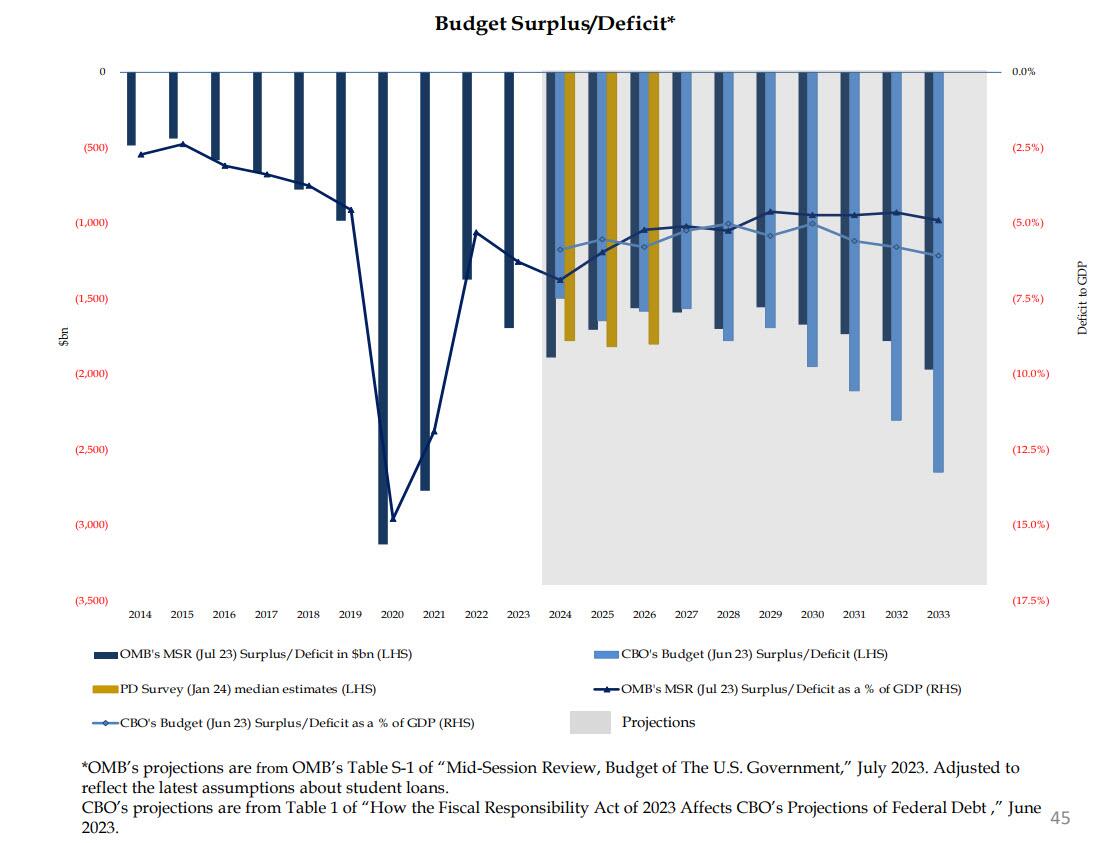
… yields tumbled as this was viewed as an aggressively dovish outlook on the future of i) the US fiscal deficit and ii) the debt needed to fund said deficit. Here is another way of visualizing the US historical and projected marketable debt funding needs:
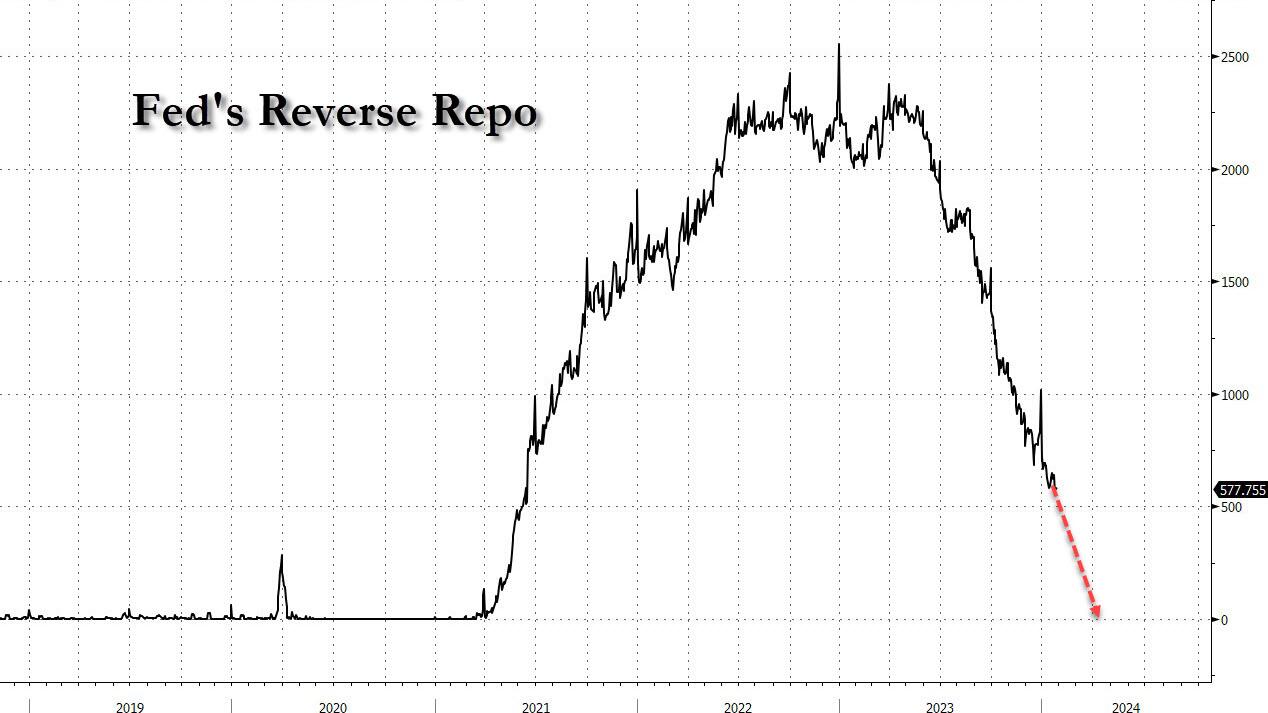
Commenting on this surprise drop in expected borrowing, on Monday we said that “the numbers also mean that the Reverse Repo facility will be fully drained by Q2, and we expect that on Wednesday we will learn that the bulk of the reduction in Q1 and Q2 estimates will be due to sharply lower Bill issuance for one simple reason: there is just no more Reverse Repo cash to buy it all.“
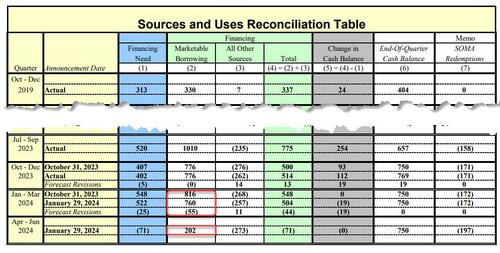
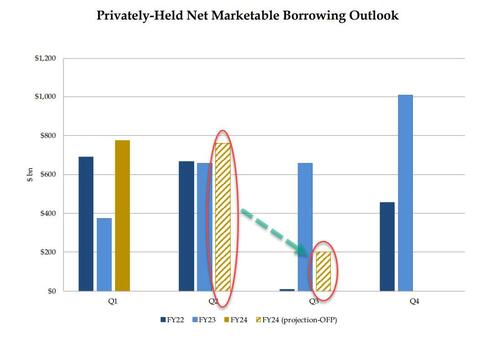
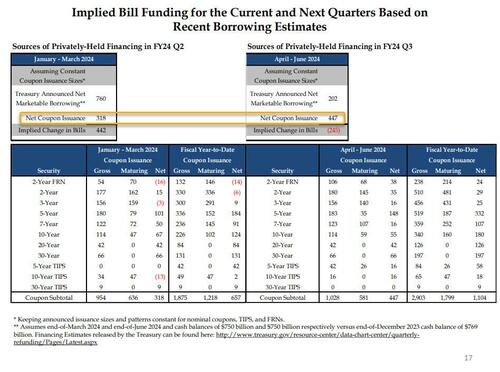
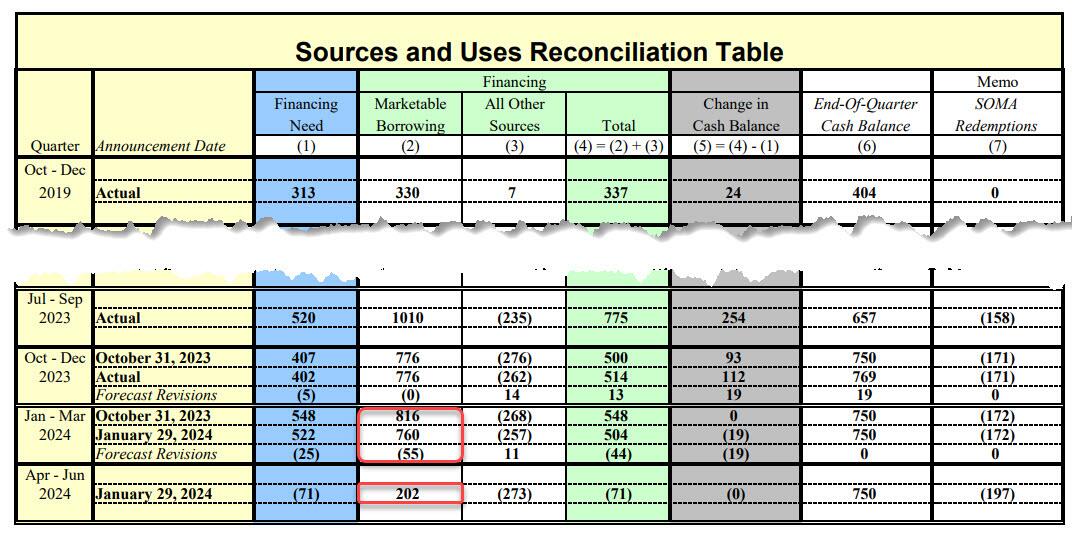
Boy, were we right: earlier today, in the Treasury’s presentation to the Treasury Borrowing Advisory Committee (TBAC) as part of the Quarterly Refunding, Janet Yellen revealed what the composition of this sharp drop in Q2 funding needs would be. As we expected, it was all bills!
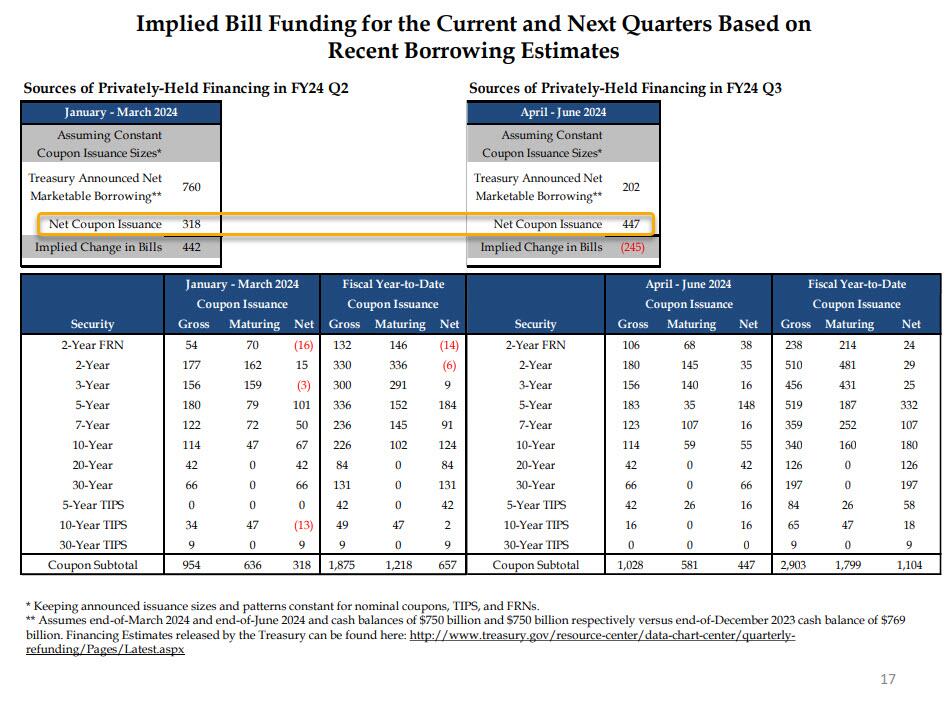
In fact, as the chart below – which we have dubbed the scariest chart in the Treasury’s presentation to TBAC today (link here) – shows, with Bills expected to fund some $442 Billion of the $760BN funding deficit in the Jan-March quarter (the balance of $318BN funded by coupons), in Q2 the Treasury now anticipates a $245BN DECLINE in net Bills outstanding (i.e., not only no incremental Bill funding but a quarter trillion maturity in Bills outstanding). In other words, while we expected a “sharply lower” Bill issuance in Q2, the Treasury is actually expecting a $245BN drawdown in Bills.
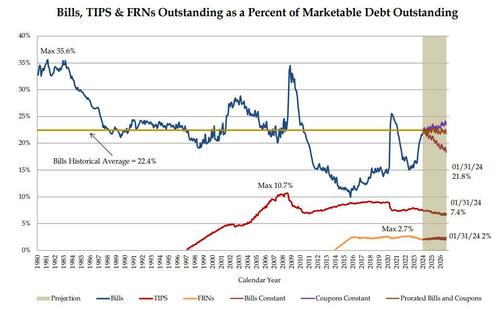
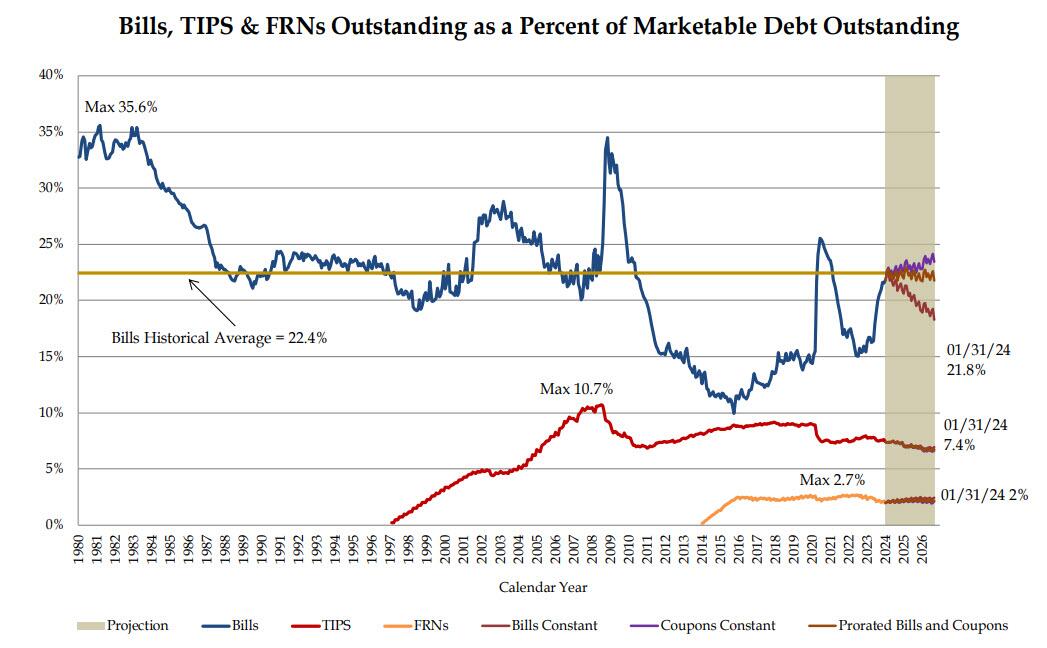
But wait, there’s more: because while the market was expecting some pro rata decline in coupon issuance to go with the slide in net Bills (we were not) in Q2 to justify the sharp drop in long-end yields, it was not meant to be. In fact, just the opposite, because as highlighted in the chart above, net Coupon issuance in Q2 is actually expected to increase by $130BN to $447BN from $318BN in Q1. This is a huge shift in higher duration supply, and is hardly what all those who were buying 10Y bonds on Monday were expecting, and yes, that too was to be expected: with Bills now well above the “comfortable” ceiling of 20% as a percentage of total debt outstanding, the Treasury had no choice but to roll it back, especially since the Reverse Repo is already mostly drained. And sure enough, in its presentation, the Treasury no longer anticipates a flood of Bill issuance in the future.
That’s not all: while the Treasury said it does “not anticipate needing to make any further increases in nominal coupon or FRN auction sizes, beyond those being announced today, for at least the next several quarters”, the TBAC politely disagreed, stating that “it may be appropriate over time to consider incremental increases in coupon issuance depending on how the current uncertainty regarding borrowing needs evolves” (translation: as the need to bribe the population with more fiscal stimmies ahead of November rises, so will borrowing needs).
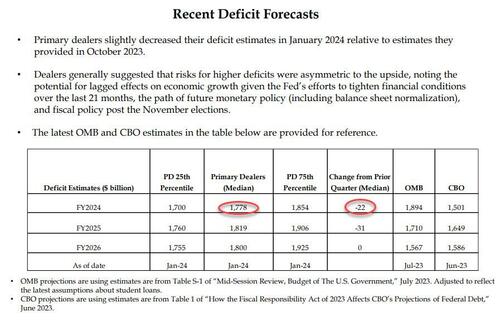
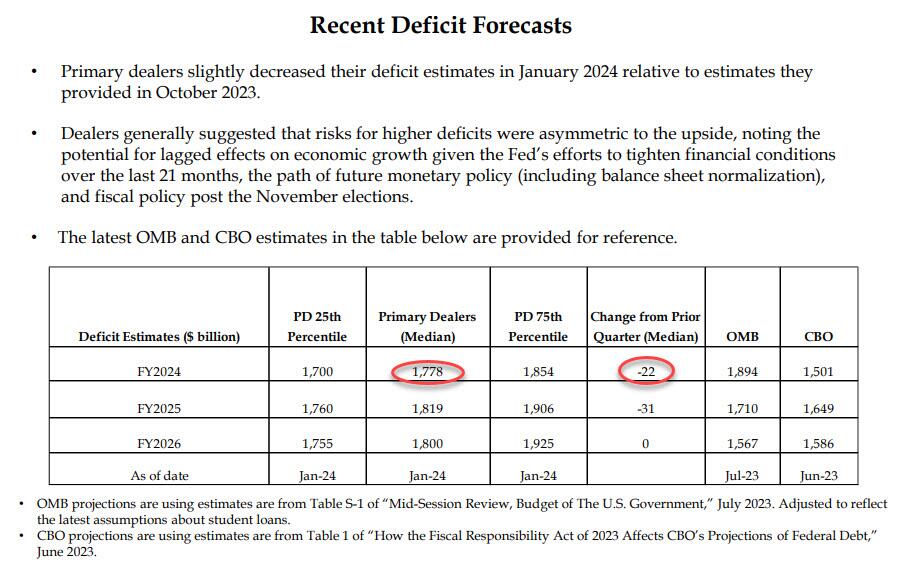
As for any naive expectations that any decline in issuance in structural instead of merely shifting away from Bills to Coupons, we have some more bad news: as the table below confirms, the Primary Dealer estimate of the US 2024 budget deficit dropped just $22BN in the past quarter, from $1.8 trillion to $1.778 trillion, a meaningless change (expect this number to rise sharply as the full brunt of fiscal stimulus in an election year become visible).
As for the bigger picture, well you can listen to either the Primary Dealers…
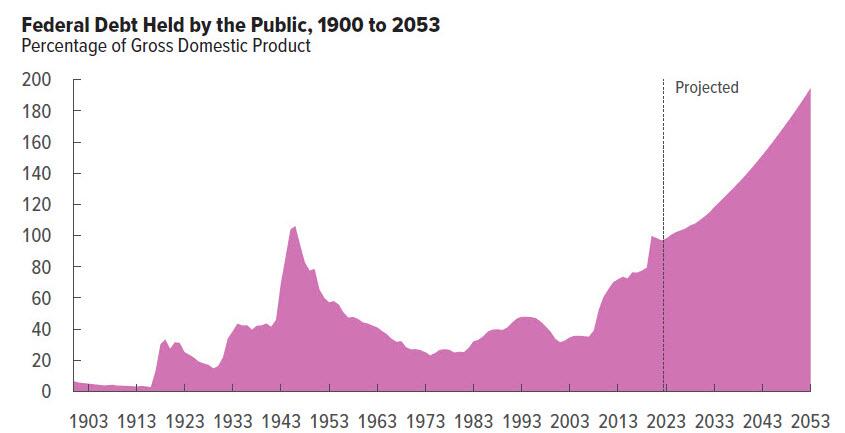
… or the CBO:
Both reach the same sad conclusion, the same one voiced by Nassim Taleb on Monday when he said that “we need something to come in from the outside, or maybe some kind of miracle…. This makes me kind of gloomy about the entire political system in the Western world.”
Sorry, Nassim, no miracles… just lots and lots of money printing coming.
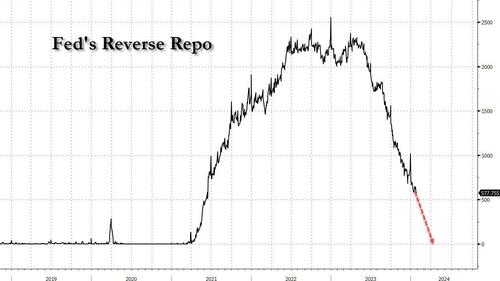
And speaking of money printing, the fact that Bill issuance is about to grind to a halt in Q2 means that, just as we expected, reverse repo balances will tumble in the remaining two months of Q1…
… bringing it effectively to zero (which means the Treasury’s stock market liquidity pump is now almost drained), at which point the Fed will have to take over and taper QT as the alternative would be draining some $100BN in reserves every month at a time when total Fed reserves are already at the level which Waller hinted may be the infamous LoLCR floor which is a hard constraint at “10-11% of GDP.” The alternative is simple: a stock market crash just months before the November election, hardly the stuff Biden’s handlers or the anti-Trump Deep State would approve of.
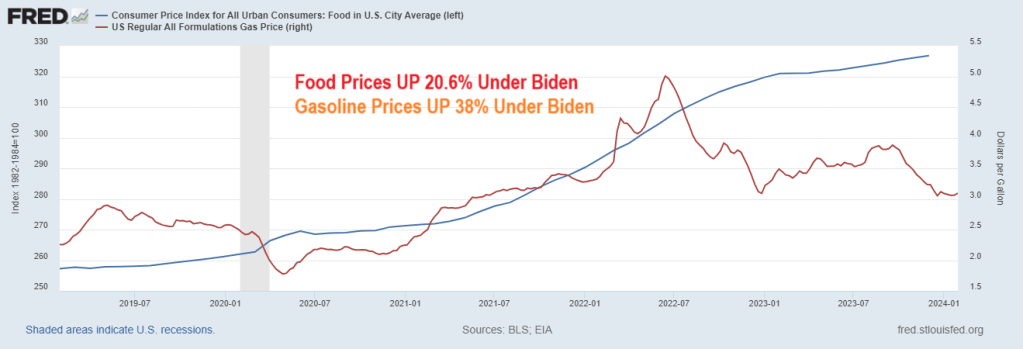
Treasury Secretary Janet Yellen just admitted what the rest of Americans already knew: high prices are here to stay. Example? Food prices (CPI) are up over 20% under Inflation Joe while gasoline prices are up 38% under Clueless Joe.
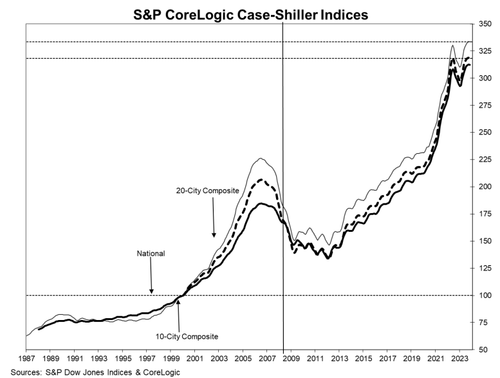
On the housing front, the Case-Shiller National Home Price Index is up 33.2% under Biden. And Freddie Mac’s 3-year mortgage rate is up 154% under Biden’s leadership (c’mon man! Obama is pulling the strings on Puppet Joe).
For months officials in the Biden administration have falsely claimed prices on everyday goods and services were going down. In reality, they’re getting more expensive at a slower pace.
During a briefing at the White House last week, Press Secretary Karine Jean Pierre had trouble explaining complaints from Biden when he purchased a smoothie that cost $6.
“Last Friday, the president was at a coffee shop in Pennsylvania, and he seemed to be surprised that the smoothie was $6 and how expensive it was,” a reporter asked. “I’m curious. So is the president now realizing the costs that Americans are bearing?”
“So, look, when he went over to you all, to the press corps, he was having a good time, right? And offered, as you know, offered to buy them coffee,” Jean Pierre responded. “There was a big group there, and he made sure everyone got coffee and pastries. So I just want to make that really clear.”
That is wonderful, KJP! The White House Press Corps got free coffee and pastries! Yippee!!!
But the rest of us in America are suffering from Bidenomics and inflation. Like food prices having risen 21% under Biden, gasoline prices UP 38%, home prices UP 33.2% and mortgage rates UP 154%.
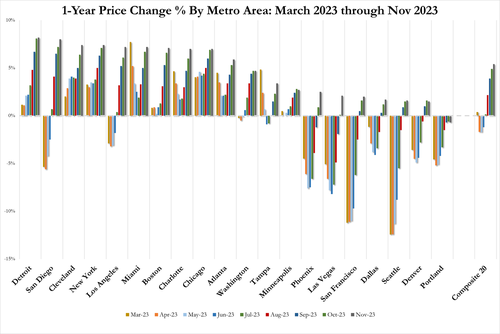
Home prices in America’s 20 largest cities rose for the 10th straight month in November (the latest data released by S&P Global Case-Shiller today), up 0.15% MoM (considerably slower than the 0.50% MoM expected and 0.63% prior).
That is the weakest MoM rise since Jan 2023.
Source: Bloomberg
That pushed the YoY price up to +5.40% (but well below the +5.8% exp)…
“November’s year-over-year gain saw the largest growth in U.S. home prices in 2023, with our National Composite rising 5.1% and the 10-city index rising 6.2%,” says Brian D. Luke, Head of Commodities, Real & Digital Assets at S&P DJI.
Six cities registered a new all-time high price in November – Miami, Tampa, Atlanta, Charlotte, New York, and Cleveland.
Portland is the only city with prices dropping YoY – who could have seen that coming?
Is this really what Jay and his pals were expecting when they embarked on an unprecedented tightening of monetary policy?
But, judging by the resumption of the rise of mortgage rates since the Case-Shiller data was created, we would expect prices to also resume their decline in the short-term…
Are prices set to shrink again (as the lag on Case-Shiller data and human’s response to rates) before re-accelerating later this year?
Yes, Cleveland hit an all-time high despite getting demolished by the Houston Texans in the wildcard game.
Isn’t it wonderful to be 81 years old like Biden and a have a credit card with seemingly no credit limit? And partner with other octogenarians like Pelosi and McConnell to bankrupt the US? Free-spending US Senate Demagogue Democrat Chuck Schumer is only 73. But all these elderly politicians are heaping debt on to backs of younger Americans.
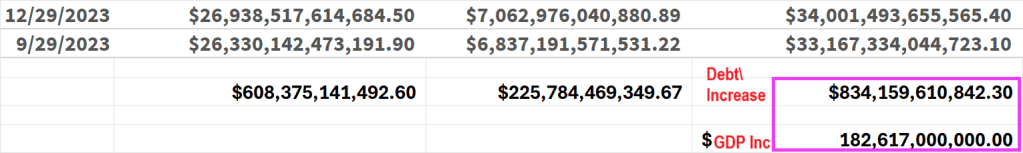
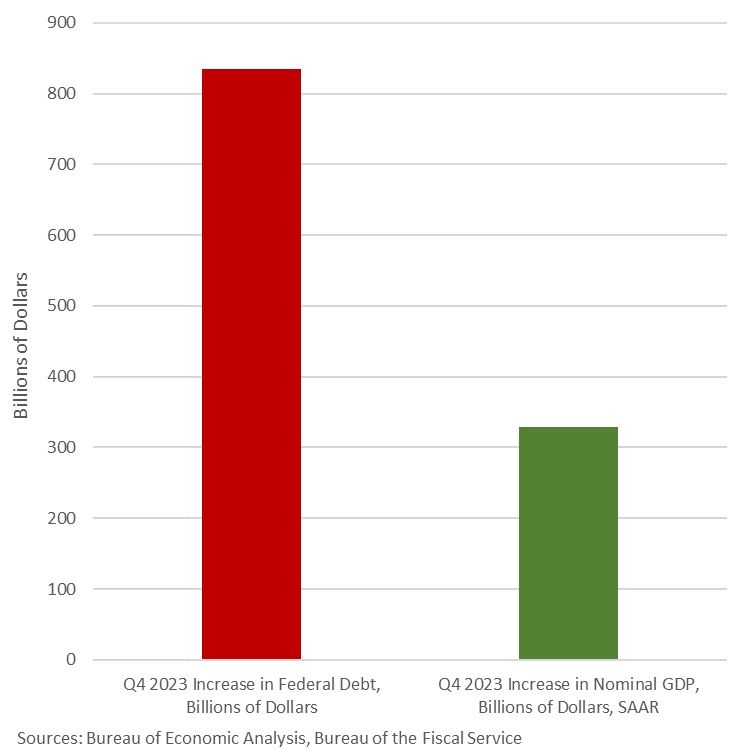
The “surprise” Q4 GDP report showed GDP rising by $182.6 billion. Unfortunately, Biden had to borrow $834 billion to get $182.6 in GDP.
Graphically, we can Biden’s folly where Q4 public debt grew almost 5 times faster than real GDP.
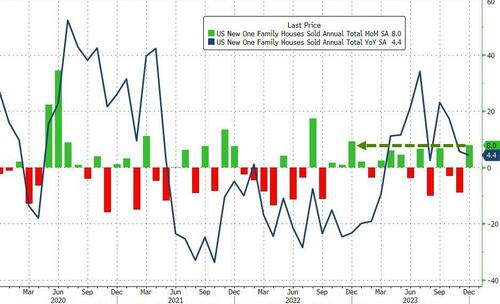
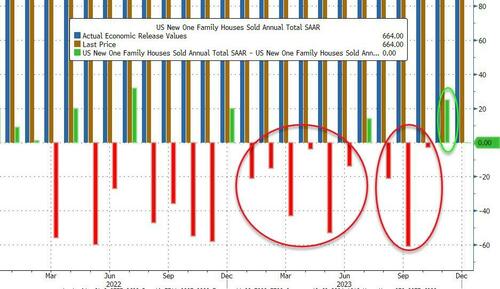
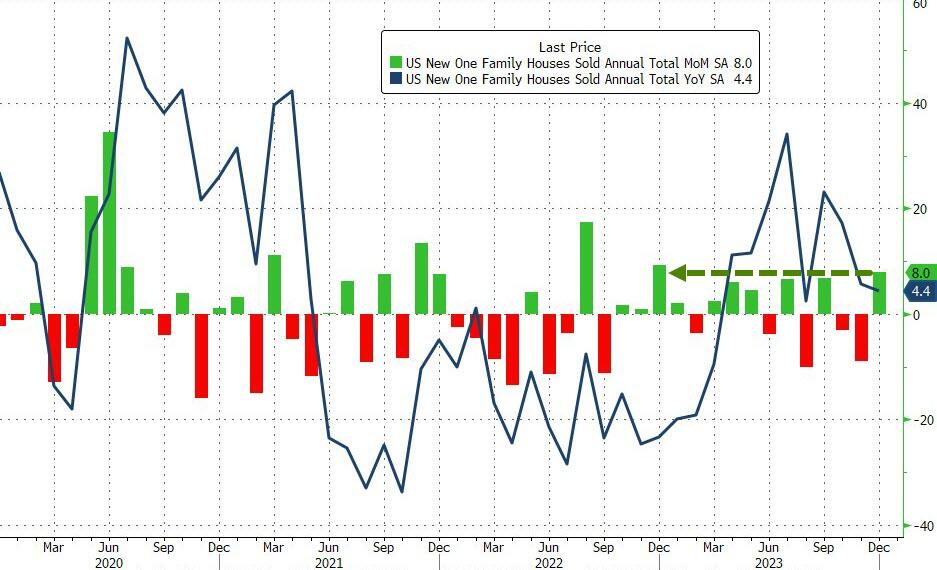
New home sales disappointed in December, rising just 8% MoM (vs 10% exp) but that is still the biggest MoM jump since last December.
Source: Bloomberg
Of course, having pointed out the dramatic series of downward revisions to this data series this year, November’s 12.2% plunge was revised up to a 8.0% drop
Source: Bloomberg
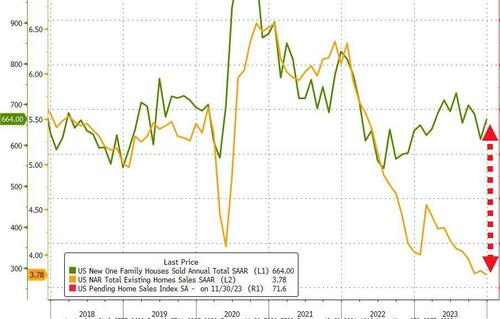
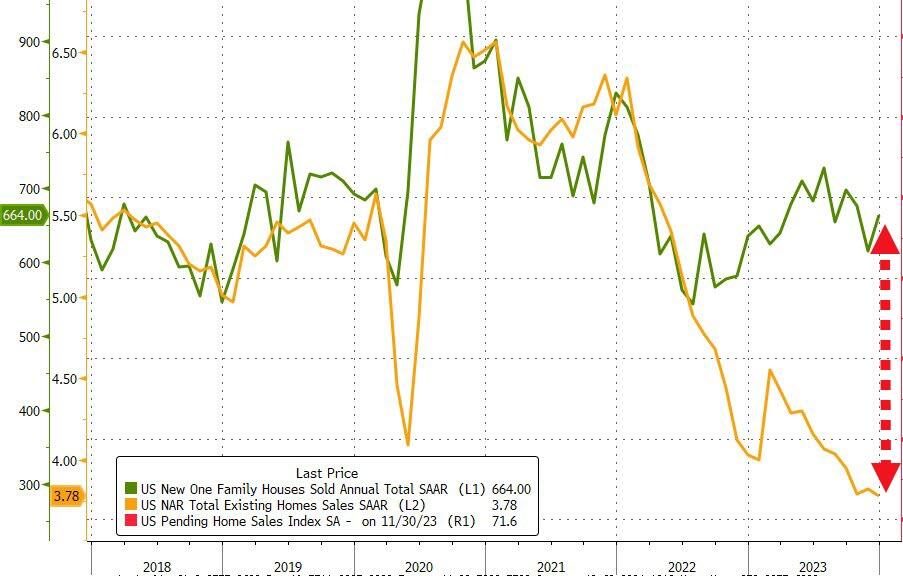
On a SAAR basis, new home sales ended at 664k (pre-COVID-lockdown levels), completely decoupled from existing home sales…
Source: Bloomberg
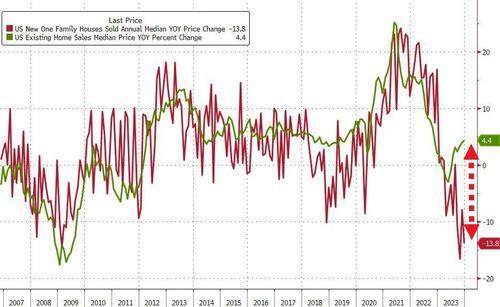
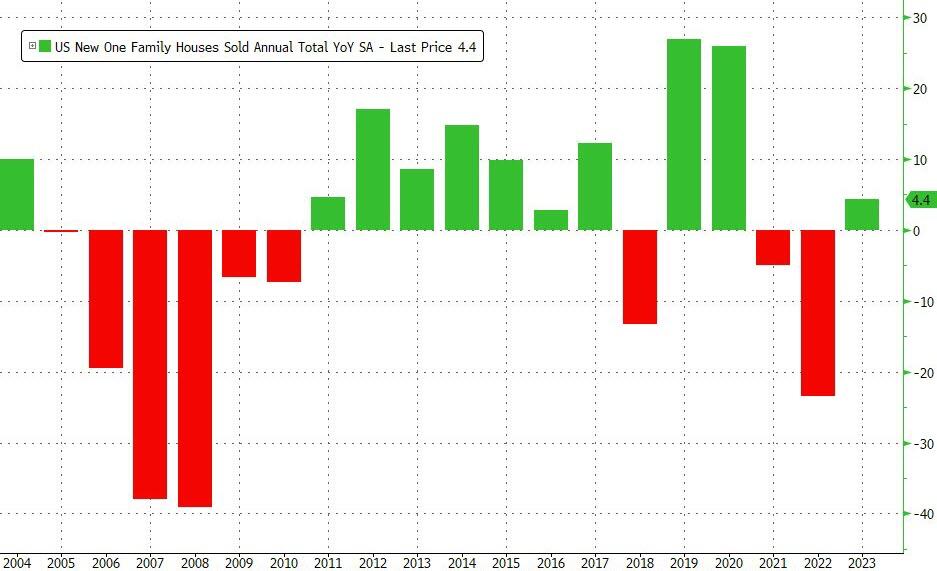
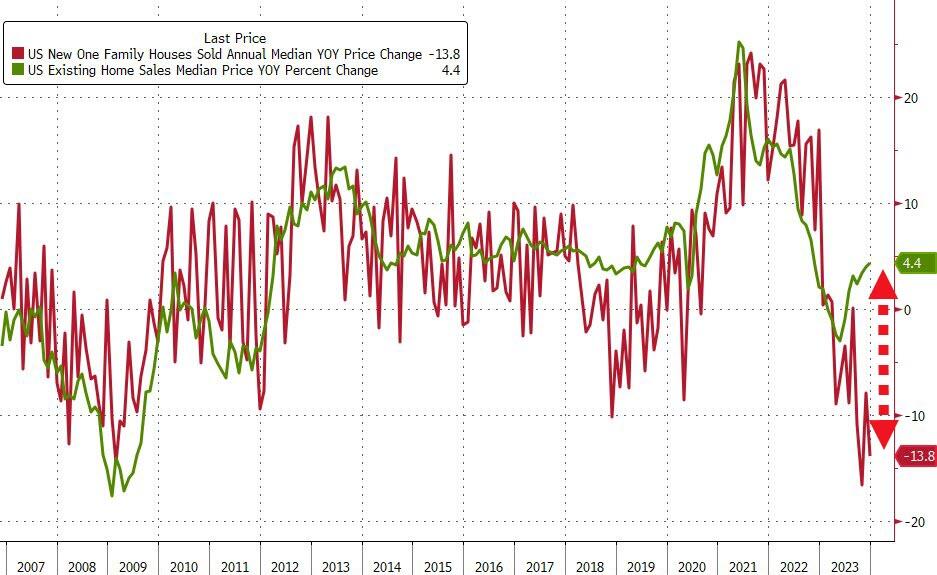
This left new home sales up 4.4% YoY…
Source: Bloomberg
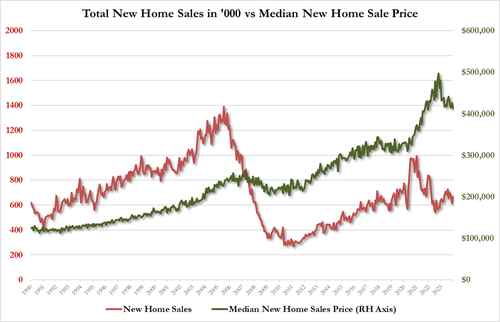
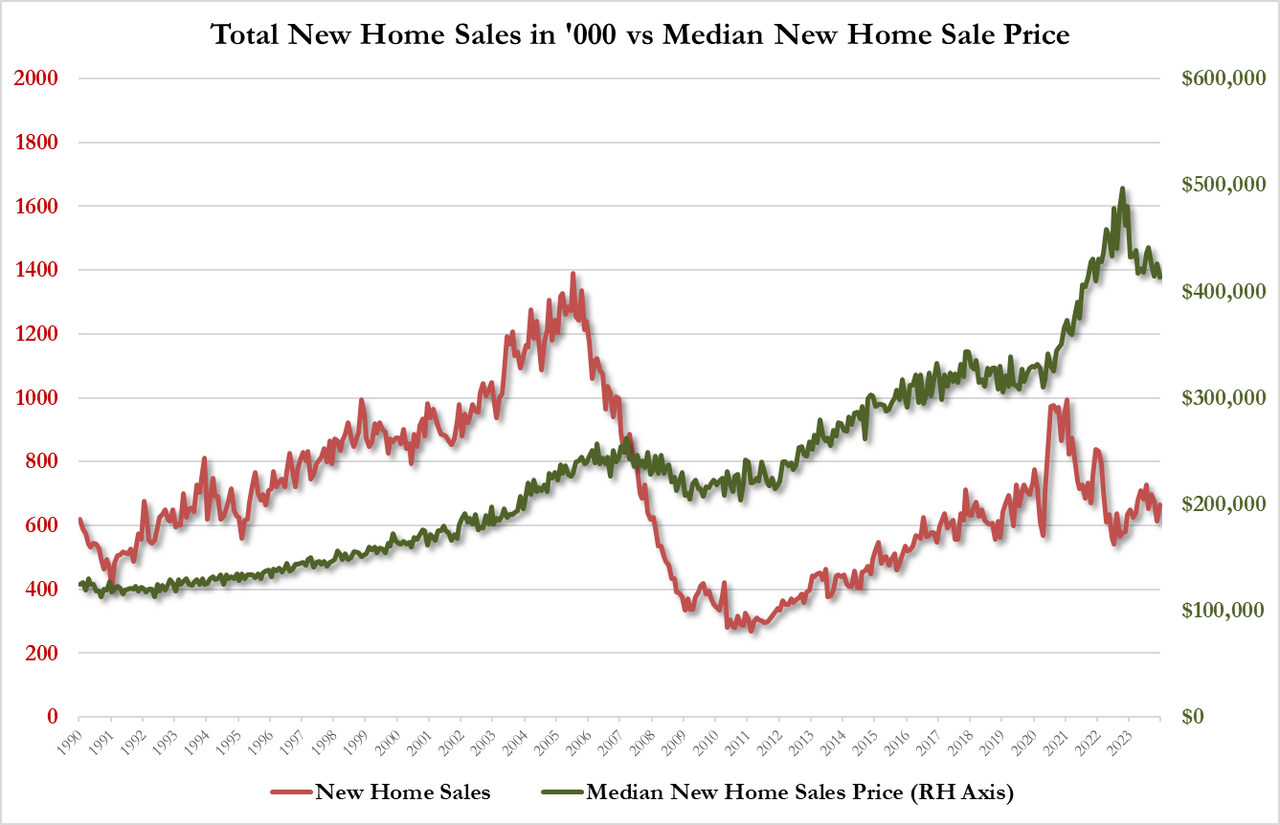
The median new home price fell 13.8% YoY to $413,200
Source: Bloomberg
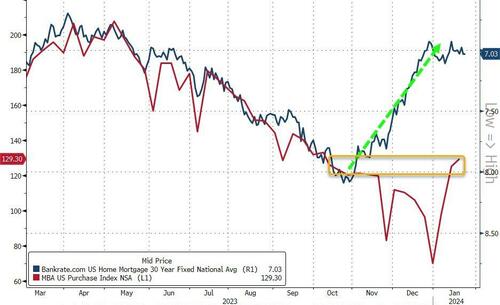
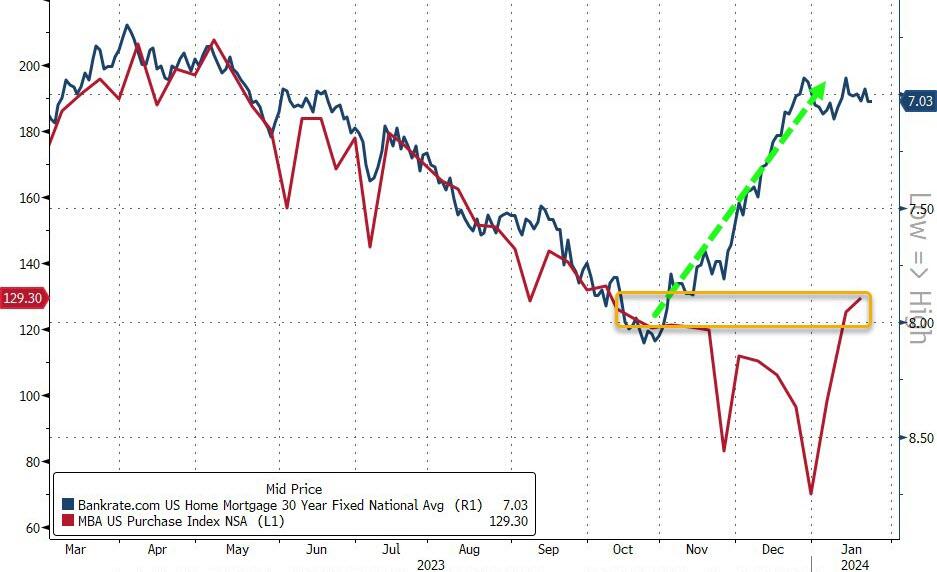
Trouble is, even as mortgage rates have plunged recently, applications for home purchases have only rebounded modestly…
Source: Bloomberg
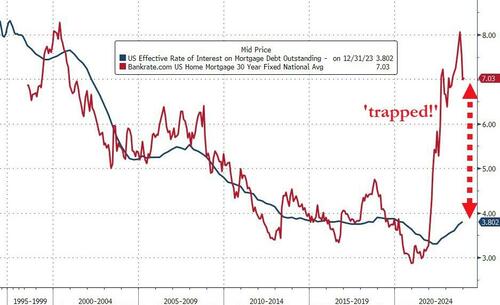
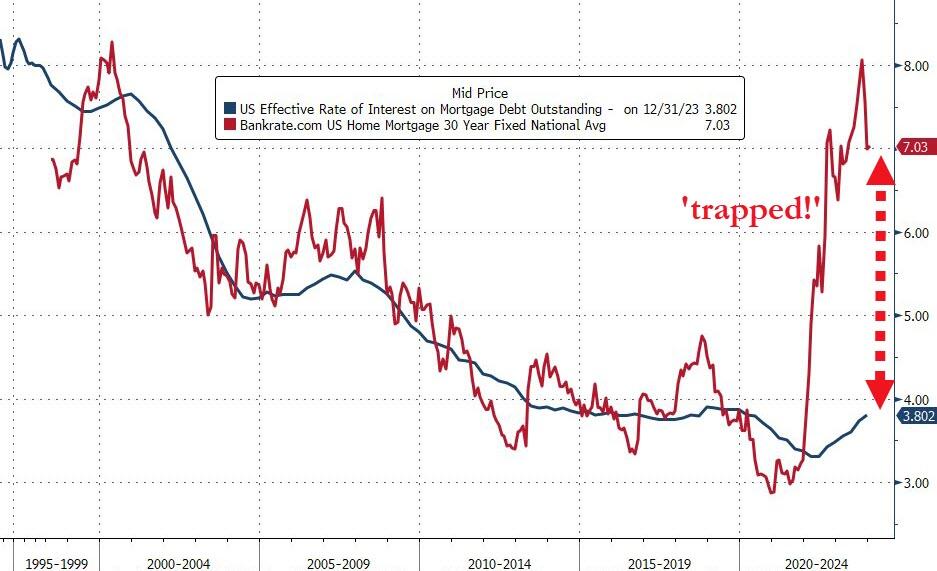
And while mortgage rates have declined (rapidly), they remain massively high relative to the effective mortgage rate for all Americans. That difference is the ‘subsidy‘ that homebuilders have to fill to enable buyers – and it’s still yuuuge!
Source: Bloomberg
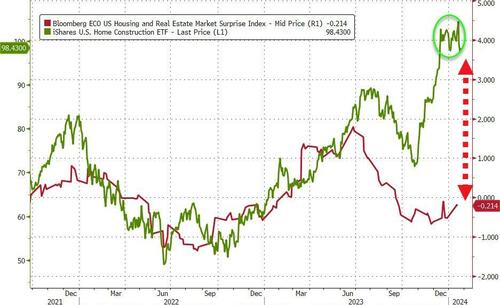
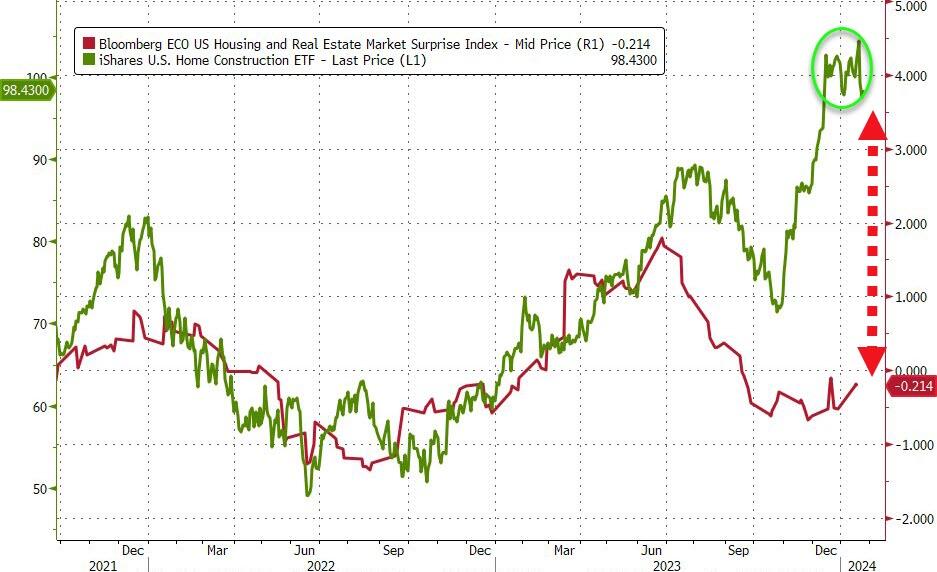
Of course, investors don’t care about actual fundamentals, rates are down so ‘buy buy buy’ the builders…
Source: Bloomberg
Finally, we note that supply shrank from 8.8 months to 8.2 months in December – so don’t expect new home prices to keep falling (they’ll be rising like the supply-constrained existing homes market)…
…and don’t expect The Fed cuts to prompt an excess-supply-driven decline in prices – it’s start your engines time on the next bubble.
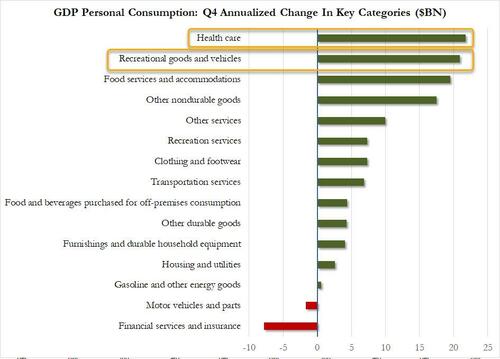
To quote Cousin Eddie from Christmas Vacation, “That there’s an RV.” Recreational goods and vehicles (aka, RVs) were second in Personal Consumption spending after America’s overpriced healthcare.
Spending on RVs makes sense since housing has become unaffordable for millions of households under Bidenomics.
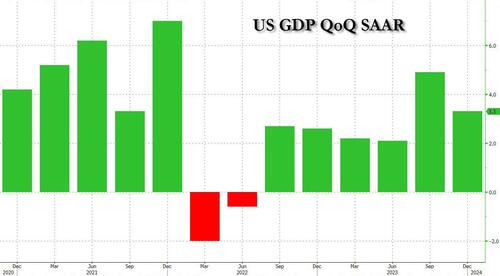
Note that GDP growth was better under Trump (pre-Covid).
The increase in consumer spending reflected increases in both services and goods. Within services, the leading contributors were food services and accommodations as well as health care. Within goods, the leading contributors to the increase were other nondurable goods (led by pharmaceutical products) and recreational goods and vehicles (led by computer software). Within exports, both goods (led by petroleum) and services (led by financial services) increased. The increase in state and local government spending primarily reflected increases in compensation of state and local government employees and investment in structures. The increase in nonresidential fixed investment reflected increases in intellectual property products, structures, and equipment. Within federal government spending, the increase was led by nondefense spending. The increase in inventory investment was led by wholesale trade industries. Within residential fixed investment, the increase reflected an increase in new residential structures that was partly offset by a decrease in brokers’ commissions. Within imports, the increase primarily reflected an increase in services (led by travel).
Compared to the third quarter of 2023, the deceleration in real GDP in the fourth quarter primarily reflected slowdowns in private inventory investment, federal government spending, residential fixed investment, and consumer spending. Imports decelerated.
Current‑dollar GDP increased 4.8 percent at an annual rate, or $328.7 billion, in the fourth quarter to a level of $27.94 trillion. In the third quarter, GDP increased 8.3 percent, or $547.1 billion (tables 1 and 3).
The price index for gross domestic purchases increased 1.9 percent in the fourth quarter, compared with an increase of 2.9 percent in the third quarter (table 4). The personal consumption expenditures (PCE) price index increased 1.7 percent, compared with an increase of 2.6 percent. Excluding food and energy prices, the PCE price index increased 2.0 percent, the same change as the third quarter.
Personal Income
Current-dollar personal income increased $224.8 billion in the fourth quarter, compared with an increase of $196.2 billion in the third quarter. The increase primarily reflected increases in compensation, personal income receipts on assets, and proprietors’ income that were partly offset by a decrease in personal current transfer receipts (table 8).
Disposable personal income increased $211.7 billion, or 4.2 percent, in the fourth quarter, compared with an increase of $143.5 billion, or 2.9 percent, in the third quarter. Real disposable personal income increased 2.5 percent, compared with an increase of 0.3 percent.
Personal saving was $818.9 billion in the fourth quarter, compared with $851.2 billion in the third quarter. The personal saving rate—personal saving as a percentage of disposable personal income—was 4.0 percent in the fourth quarter, compared with 4.2 percent in the third quarter.
GDP for 2023
Real GDP increased 2.5 percent in 2023 (from the 2022 annual level to the 2023 annual level), compared with an increase of 1.9 percent in 2022 (table 1). The increase in real GDP in 2023 primarily reflected increases in consumer spending, nonresidential fixed investment, state and local government spending, exports, and federal government spending that were partly offset by decreases in residential fixed investment and inventory investment. Imports decreased (table 2).
The increase in consumer spending reflected increases in services (led by health care) and goods (led by recreational goods and vehicles). The increase in nonresidential fixed investment reflected increases in structures and intellectual property products. The increase in state and local government spending reflected increases in gross investment in structures and in compensation of state and local government employees. The increase in exports reflected increases in both goods and services. The increase in federal government spending reflected increases in both nondefense and defense spending.
The decrease in residential fixed investment mainly reflected a decrease in new single-family construction as well as brokers’ commissions. The decrease in private inventory investment primarily reflected a decrease in wholesale trade industries. Within imports, the decrease primarily reflected a decrease in goods.
Current-dollar GDP increased 6.3 percent, or $1.61 trillion, in 2023 to a level of $27.36 trillion, compared with an increase of 9.1 percent, or $2.15 trillion, in 2022 (tables 1 and 3).
The price index for gross domestic purchases increased 3.4 percent in 2023, compared with an increase of 6.8 percent in 2022 (table 4). The PCE price index increased 3.7 percent, compared with an increase of 6.5 percent. Excluding food and energy prices, the PCE price index increased 4.1 percent, compared with an increase of 5.2 percent.
Measured from the fourth quarter of 2022 to the fourth quarter of 2023, real GDP increased 3.1 percent during the period (table 6), compared with an increase of 0.7 percent from the fourth quarter of 2021 to the fourth quarter of 2022.
The price index for gross domestic purchases, as measured from the fourth quarter of 2022 to the fourth quarter of 2023, increased 2.4 percent, compared with an increase of 6.2 percent from the fourth quarter of 2021 to the fourth quarter of 2022. The PCE price index increased 2.7 percent, compared with an increase of 5.9 percent. Excluding food and energy, the PCE price index increased 3.2 percent, compared with 5.1 percent.
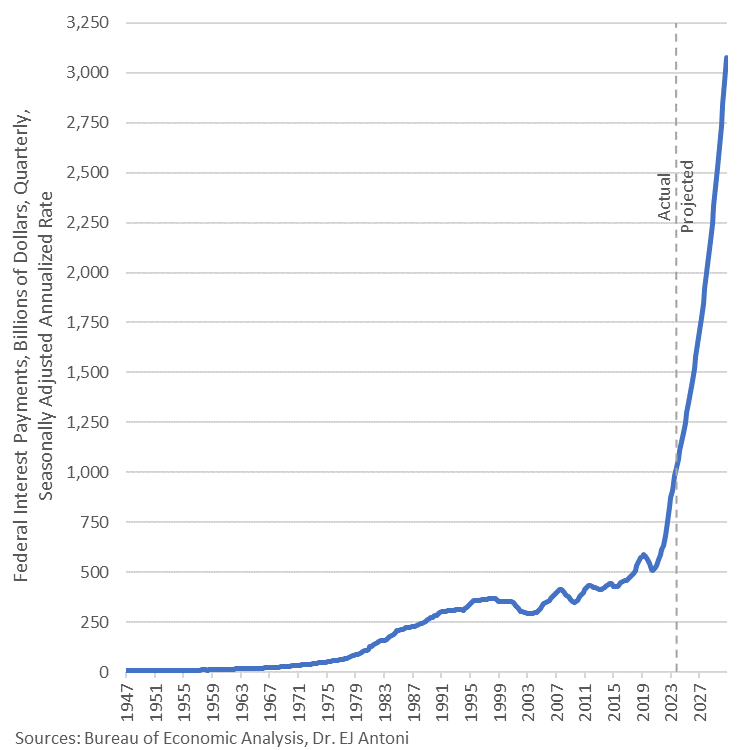
Annualized interest on the federal debt now exceeds $1 trillion and is projected to breach $3 trillion, annualized rate, by Q4 2030.
What can you get for an $834-billion increase in federal debt? Only a $328-billion increase in GDP. This economic “growth” in Q4 ’23 was fueled by gov’t expenditures and gov’t transfers, which in turn are fueled by deficits – sound sustainable?
This is Cousin Eddie’s RV. Cheaper than a house under Bidenomics!


You must be logged in to post a comment.