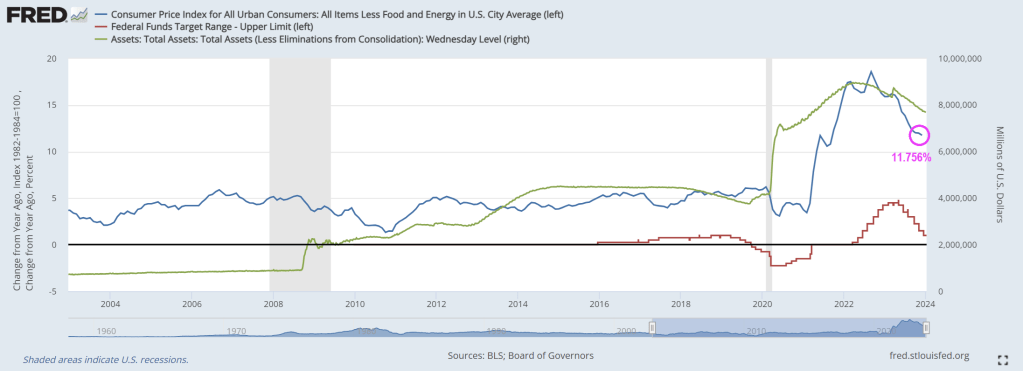
Although core inflation declined in December (CPI all items less food and energy), it is still hot, hot, hot at 4% Year-over-year (YoY). This raises the following question: Is The Fed tightening too much? Aka, yet another Fed policy error?? Since The Fed target rate is 5.50% and core inflation is now 4%?
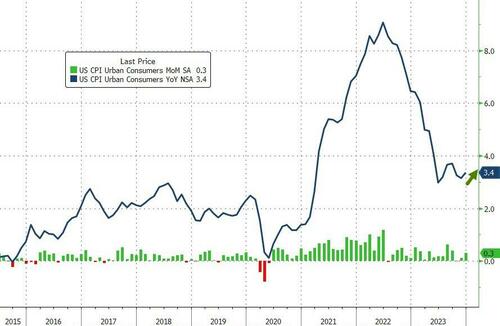
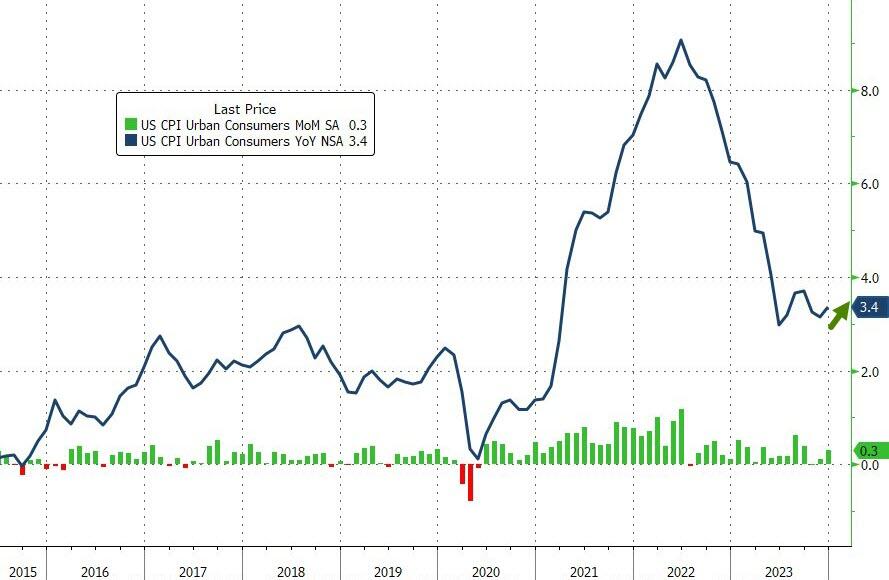
Headline Consumer Price Inflation printed hotter than expected in December, +0.3% MoM vs +0.2% exp and +0.1% prior, pushing the YoY headline CPI up to +3.4% (from +3.1% prior and hotter than the +3.2% exp)…
Source: Bloomberg
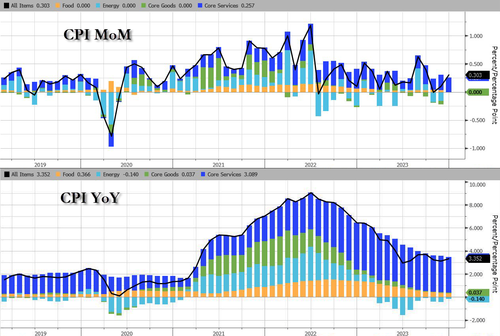
Services (Shelter mostly) costs re-accelerated and energy deflation stalled in December…
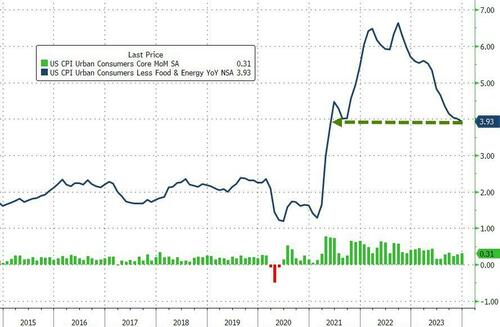
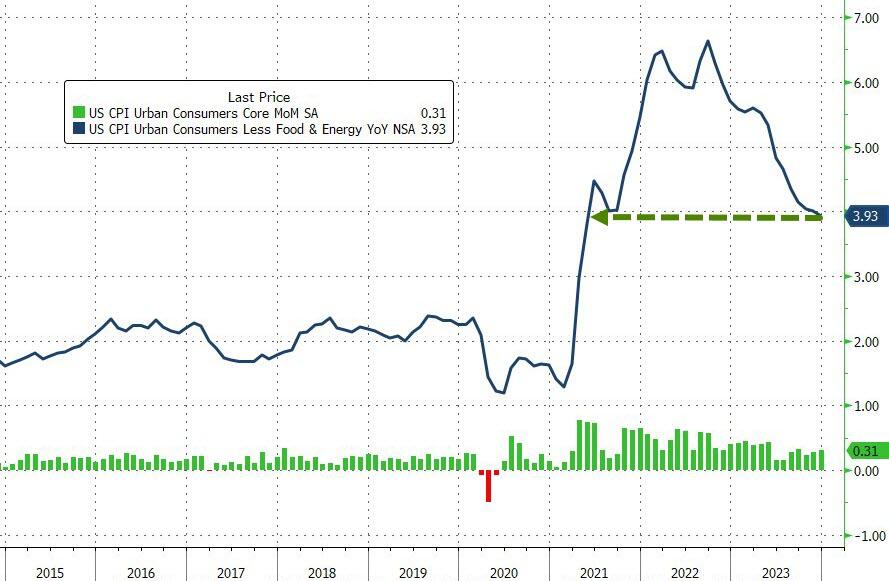
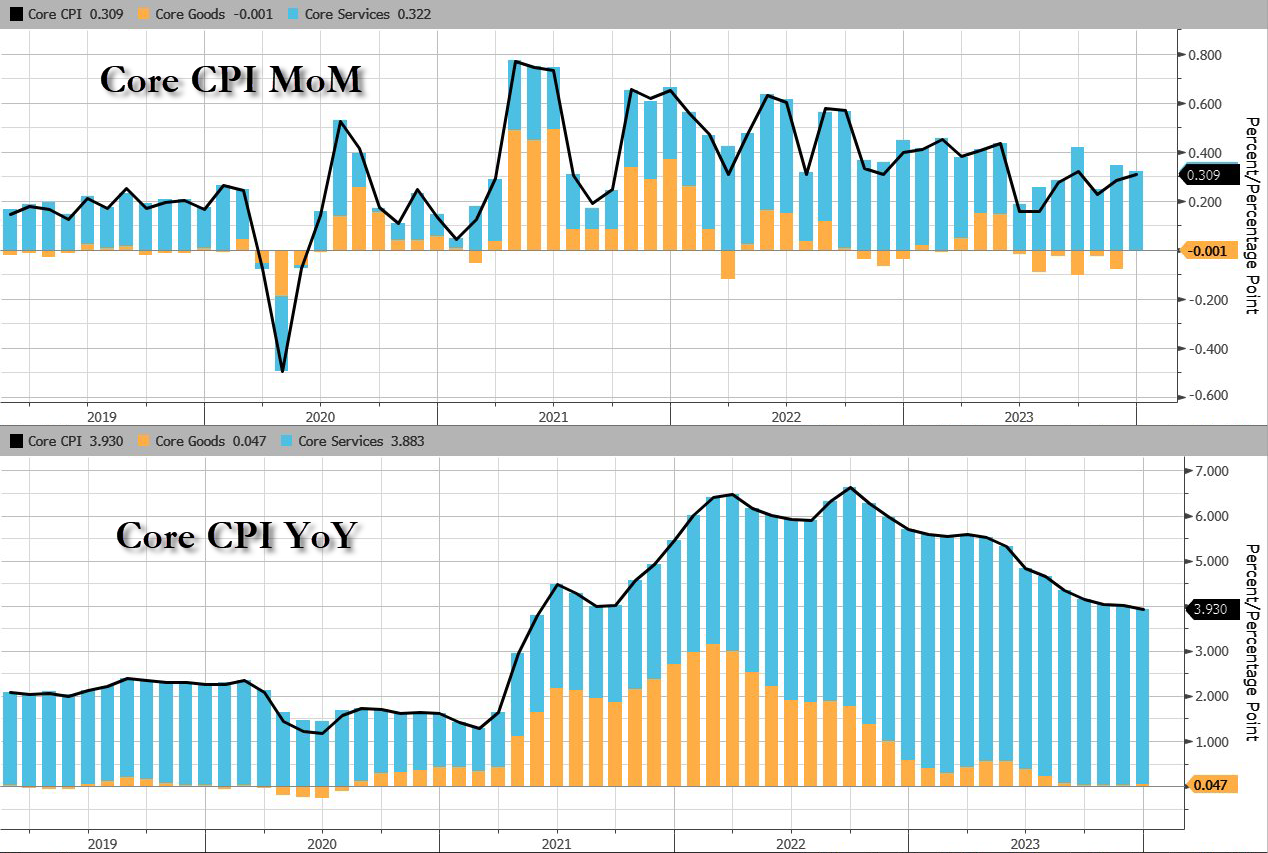
On the brighter side, core CPI according to the BLS rose 0.3% MoM as expected, dropping the YoY change below 4.00% for the first time since May 2021…
Source: Bloomberg
Goods deflation has stalled as the used cars and trucks index rose 0.5 percent over the month, after rising 1.6 percent in November.
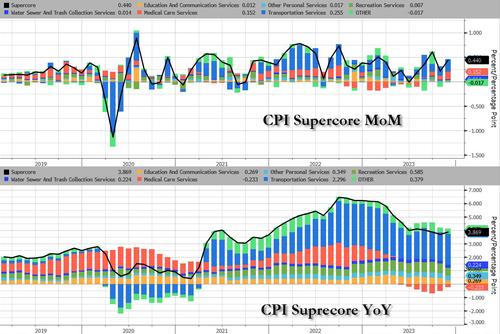
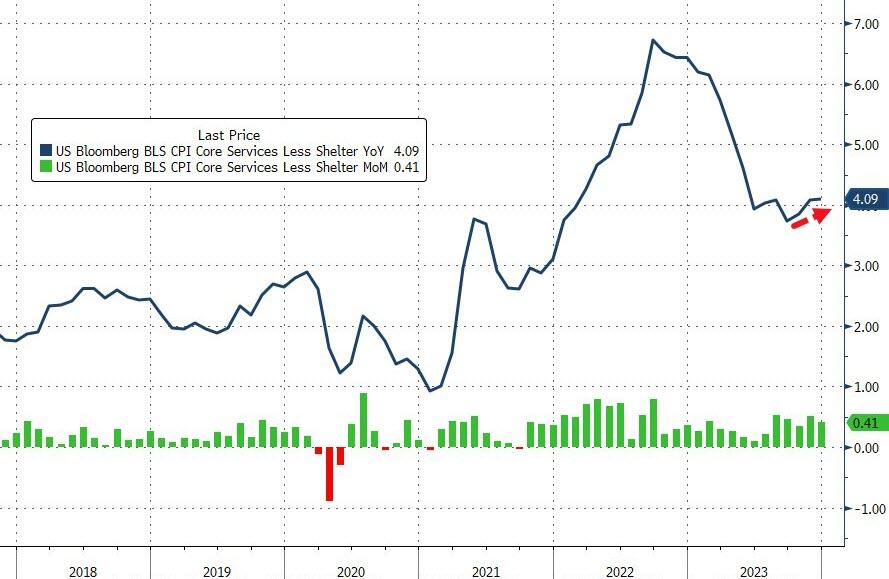
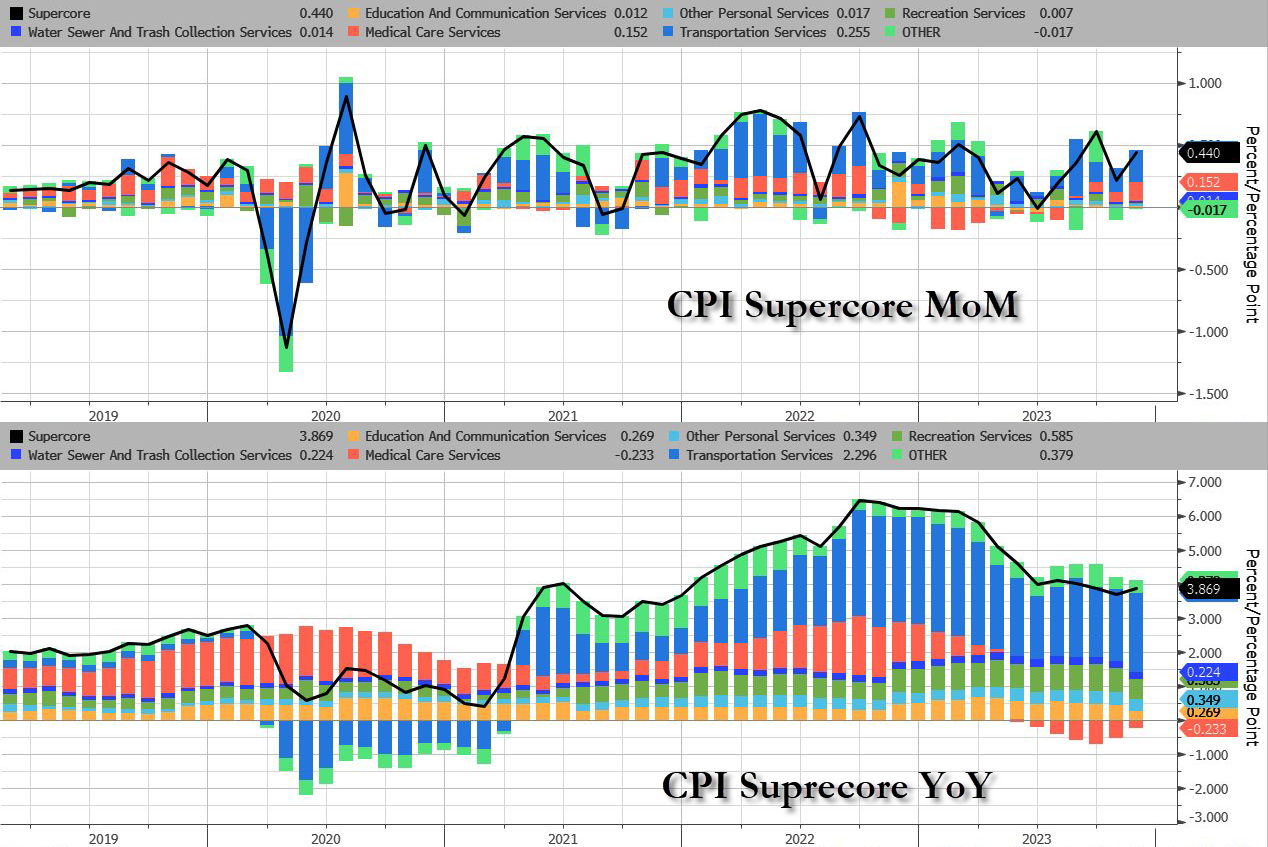
More problematically for The Fed (and the rate-cut ‘hypers’), is the fact that Core CPI Services Ex-Shelter (SuperCore) rose 0.4% MoM, upticking the YoY rise to +4.09%…
Source: Bloomberg
This is a category that Fed Chair Jerome Powell and other policymakers have highlighted as a focus.
All the subsectors of SuperCore rose MoM with the shelter index increased 6.2 percent over the last year, accounting for over two thirds of the total increase in the all items less food and energy index.
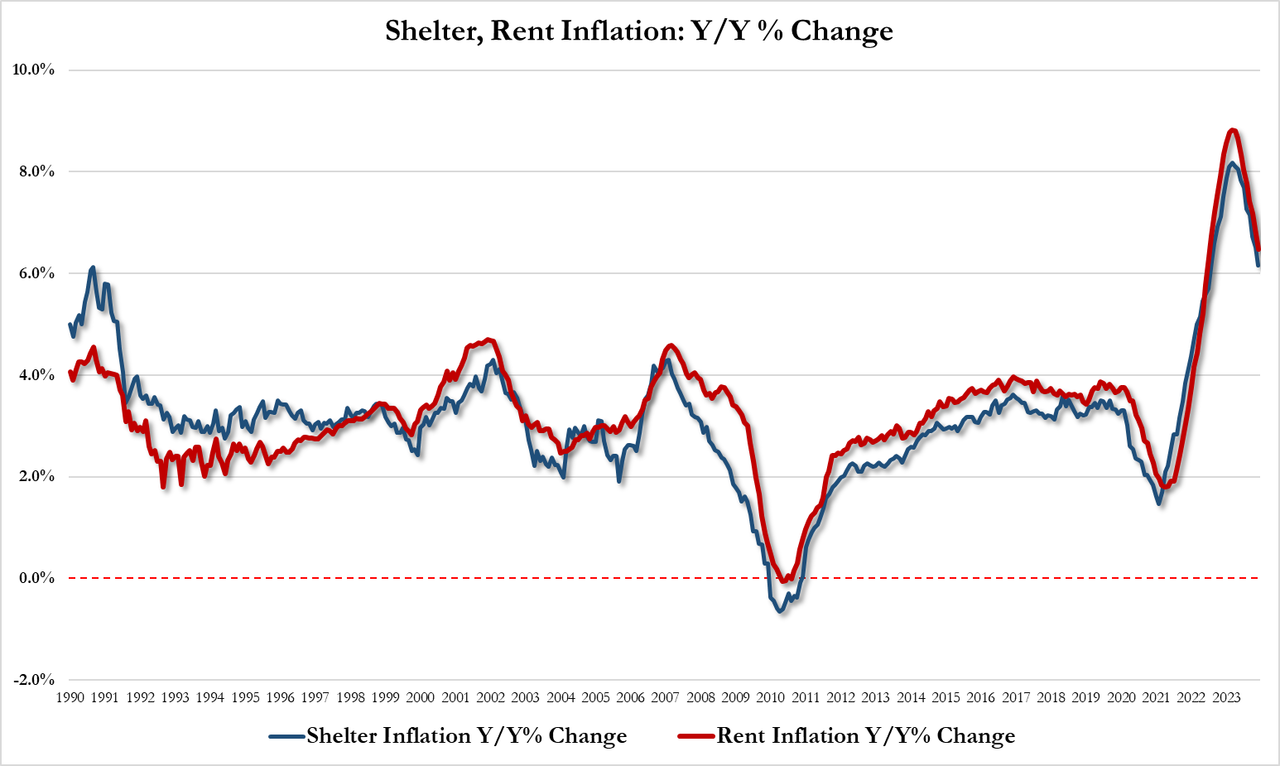
But shelter inflation is slowing (slowly):
Shelter inflation was up 6.15% YoY in Dec, down from 6.51% in Nov and the lowest since July 2022
Rent inflation was up 6.47% YoY in Dec, down from 6.87% in Nov and the lowest since July 2022
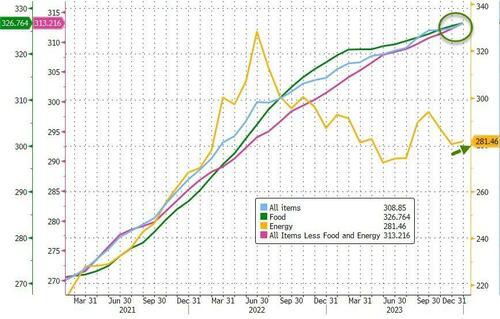
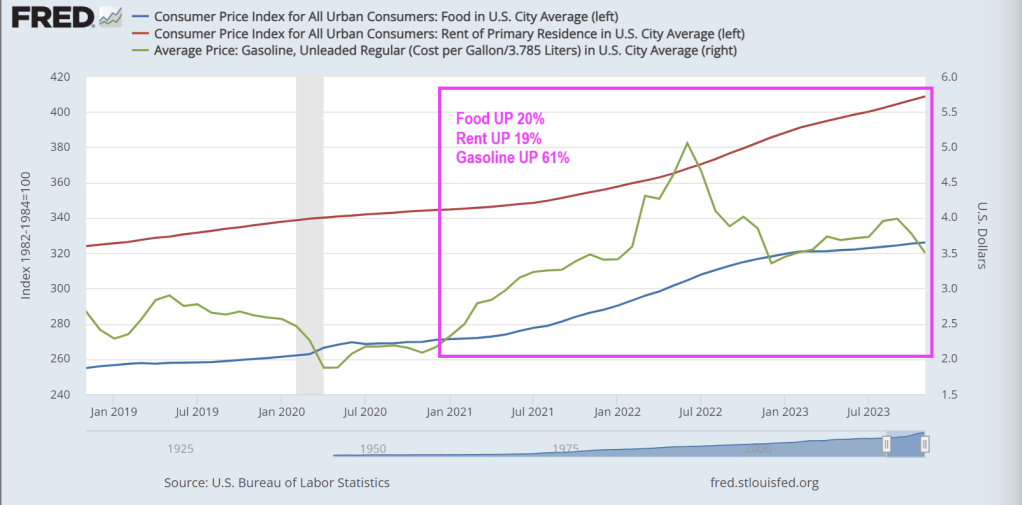
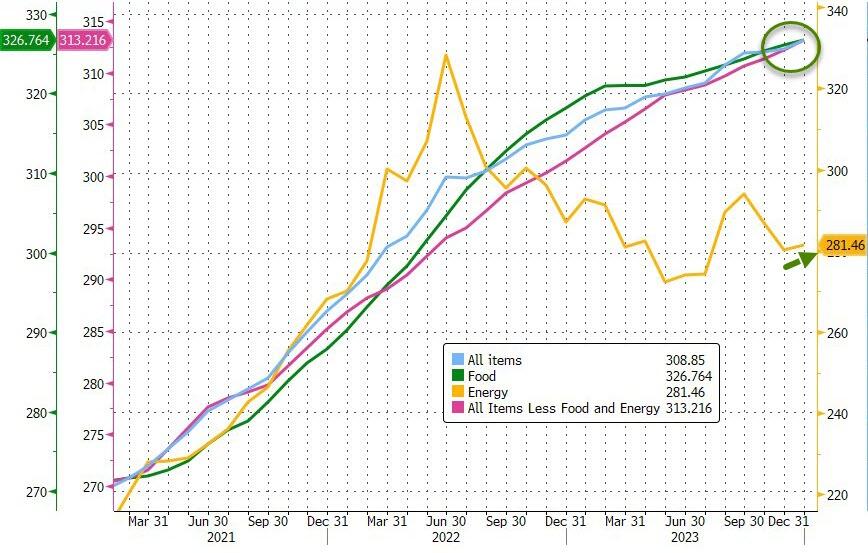
And the next time someone from the Biden administration says ‘inflation is down’ in an attempt to gaslight the public into believing ‘prices are down’ – show them this chart…
Headline costs at record highs
Core costs are record highs
Food costs at record highs
Fuel costs on the rise again
Source: Bloomberg
Four of the six major grocery store food group indexes increased over the month.
The index for meats, poultry, fish, and eggs rose 0.5 percent in December, led by an 8.9-percent increase in the index for eggs.
The index for food away from home rose 5.2 percent over the last year.
The index for limited service meals rose 5.9 percent over the last 12 months, and the index for full service meals rose 4.5 percent over the same period.
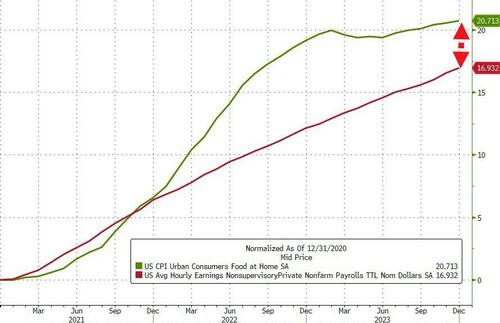
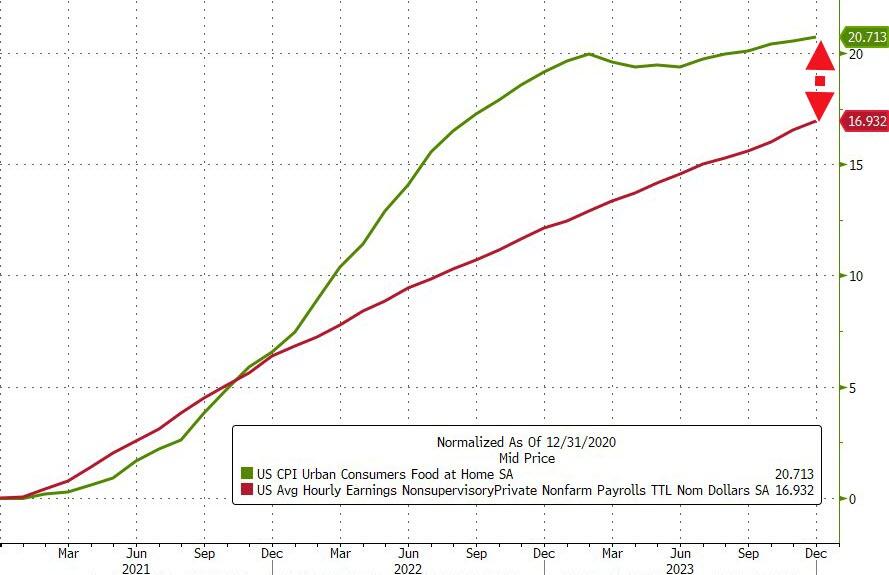
The White House was quick to note that real hourly earnings was positive in December (+0.8% YoY) but that number is the aggregate of ALL American workers.
If we drill down to the ‘average joe’ – production and non-supervisory jobs – their wages are up 17% since Biden was elected… The only problem is, the cost of food since then has surged almost 21%…
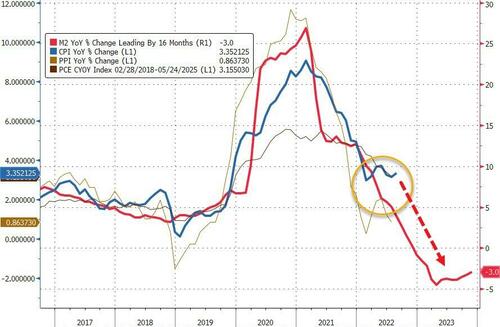
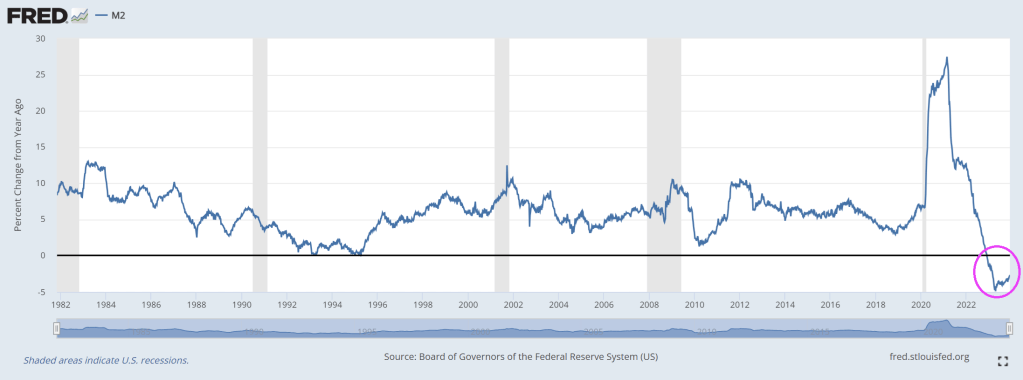
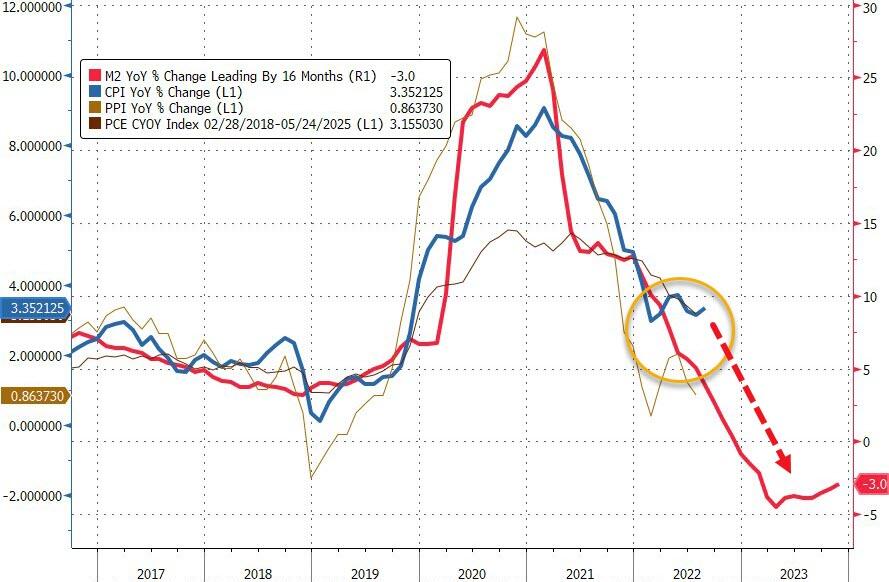
Is this a pause before the re-plunge? M2 thinks so…
So what happens next?
Not so much Goldilocks perfection.
Powell is in a real pickle now – does the Fed begin shrinking QT in March (which it has to if it is terminating BTFP and Reverse Repo is drained) without starting rate cuts.
Unfortunately, that period of relative stability appears to be ending.
The pace of layoffs really seemed to pick up steam at the end of 2023, and the outlook for the coming year is not promising at all. In fact, a survey that was just conducted by Resume Builder discovered that a whopping 38 percent of U.S. companies anticipate that they will conduct layoffs in 2024…
38% of companies say they are likely to have layoffs in 2024
52% are likely to implement a hiring freeze in 2024
Half say anticipation of a recession is a reason for potential layoffs
4 in 10 say layoffs are due to replacing workers with artificial intelligence (AI)
3 in 10 companies reducing or eliminating holiday bonuses this year
If you currently have a job that you highly value, try to hold on to it as tightly as you can.
Because the employment market is starting to shift in a major way.
Nike has announced a $2 billion cutback over the next three years, with an uncertain number of job cuts included. Toy giant Hasbro will cut nearly 20% of its workforce in 2024, according to reports from the Wall Street Journal. Music service Spotify announced a third round of layoffs. A recent email from CEO Daniel Ek says the company plans to cut its workforce by nearly 20%. Roku is going to be limiting new hires, and laying off about 10% of its workforce, while Amazon layoffs are effecting its new gaming division (all 180 jobs there are being eliminated). Citi CEO Jane Fraser announced layoffs in September, and sources have told CNBC that the bank could let go of at least 10% of its workforce, across several business lines. Flexport Logistics plans to cut up to 30% of its employees, and financial services company Charles Schwab is cutting back by 5-6% of its workforce, according to reports from Business Insider.
Unfortunately, this is just the tip of the iceberg.
With the continued rise of online shopping, along with record inflation, it’s no wonder that retailers are suffering steep financial losses. Unfortunately, this means that companies all across the U.S. are downsizing brick-and-mortar storefronts to make ends meet. In 2023, we’ve seen closures from big-name retailers and local shops alike—and the shutdowns don’t appear to be easing up anytime soon.
More than 3,000 retail locations were shut down in 2023, but that is nothing compared to what is coming…
According to UBS equity analyst Michael Lasser, the U.S. remains over-retailed. Lasser estimated that the U.S. will shed almost 50,000 retail stores by 2028. He cites rising operating costs and a higher proportion of e-commerce sales, causing retailers to look closely at store locations and performance.
Can you imagine what our communities will look like if that projection is even close to accurate?
As economic conditions deteriorate, people are going to get more desperate and the conditions in our streets will become even more chaotic.
A mob of over 100 looters purposefully crashed a Kia into a small bakery in Compton, Calif., before they flooded in and ransacked the store during a night of rampage on the streets earlier this week.
The thieves had gathered in the area for an illegal street takeover around 3 a.m. Tuesday before making the mile-long trek to Ruben’s Bakery & Mexican Food.
When they got to the locked store, a white Kia backed into the front doors, clearing an entryway for the crowd of pillagers to get to their loot.
And so it goes. Lawlessness is bad for retail businesses. Not to mention the morale of US citizens.
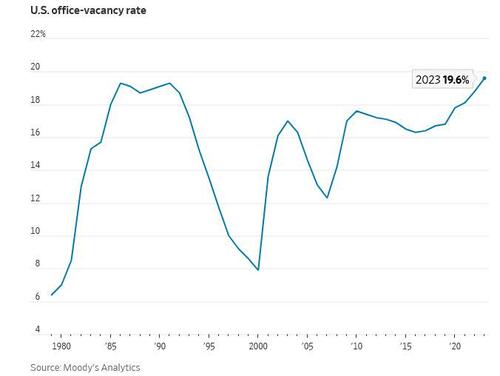
And then we have the office market. The office space vacancy rate in the US has reached its highest level since 1979. In the fourth quarter of 2023 19.6% of office space in major US cities was not leased according to data collected by Moody’s Analytics.
The increase in remote work since the COVID-19 pandemic has caused a large decline in demand for office space, despite increasing attempts to get Americans back in the office. What’s more, on the demand side the stock of office space in the US is the result of earlier booms in commercial real estate construction. The last boom took place between 2012 and 2017, when demand for commercial real estate loans strengthened. On the supply side, lending standards loosened between 2012 and 2015. This era coincides with a strong rise in the commercial real estate price index, which may have motivated banks to expand lending. Loan standards tightened during the pandemic, then loosened again when the economy rebounded, but have tightened since 2021.
Since the Great Recession, commercial real estate prices have more than doubled in nominal terms, but have moved sideways since 2021. This suggests that prices have reached a plateau. However, in recent years inflation has obscured the movement of commercial real estate prices in real terms, which shows a peak in 2021, but since then there has been a decline, almost to the level during the COVID-19 pandemic. In other words, commercial real estate prices are already failing to keep up with inflation. Is this an indication that the commercial real estate bubble is already deflating? With nominal commercial real estate prices remaining elevated, most of the nominal price correction is likely still to come. Since small banks are heavily exposed to commercial real estate, the enduring problems at small banks and the fragility of commercial real estate could provide a dangerous mix that could explode during a recession. For more details, we refer to The commercial real estate-small bank nexus.
I noticed that The Administration has handed propaganda duties off to John Kirby and relegated KJP to relief pitching away from Peter Doocey!
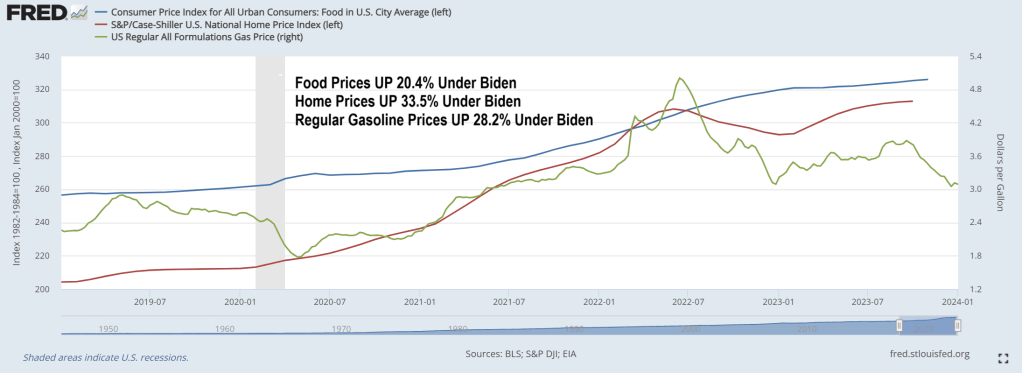
Bidenomics has taken the US economy to the underworld. Where households have to run up credit cards to ridiculous levels to cope with inflation under Bidenomics. Under Bidenomics, food prices are up 20.4%, home prices are up 33.5% and regular gasoline prices are up 28.2%. Whip out those credit cards!!!!!
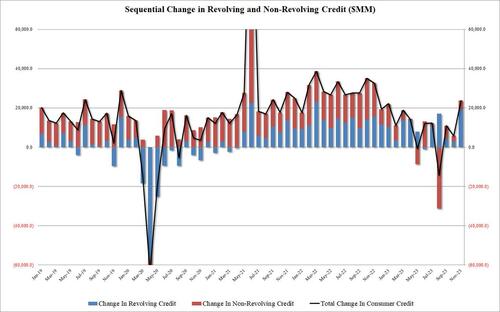
According to the latest monthly consumer credit report from the Fed, in November, consumer credit exploded higher by $24.75BN, blowing away expectations of a “modest” $9BN increase after the surprisingly subdued $5.8BN (upward revised from $.5.1BN) in October and the $4.3BN average of the past 6 months. This was the biggest monthly increase since last November, and was the first $20BN+ print since Jan 2023.
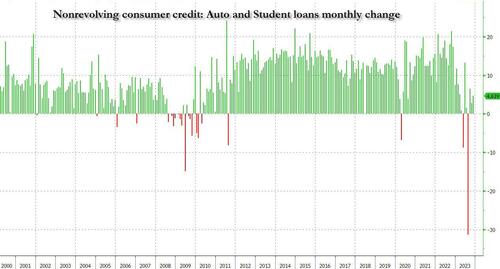
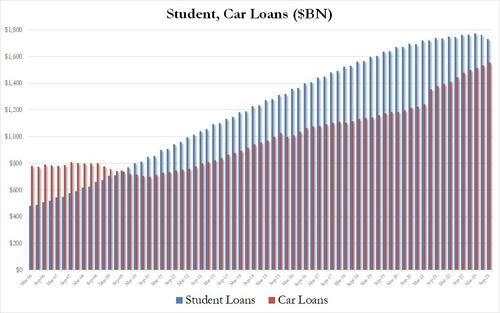
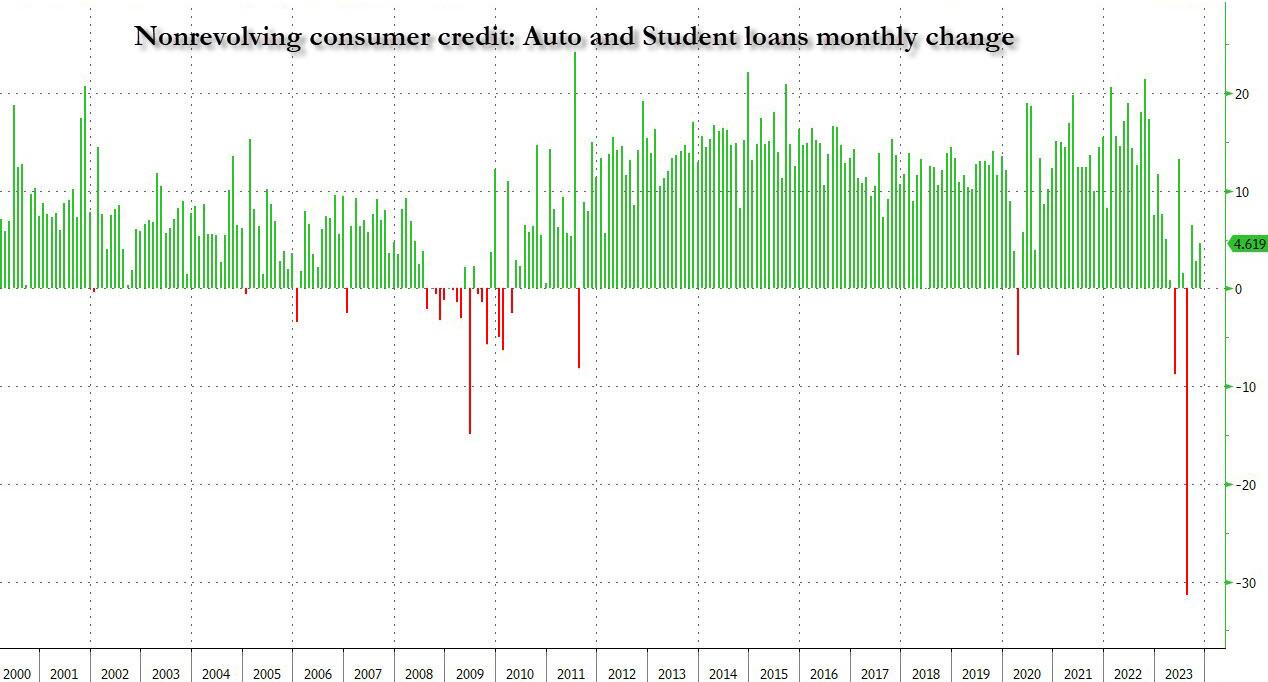
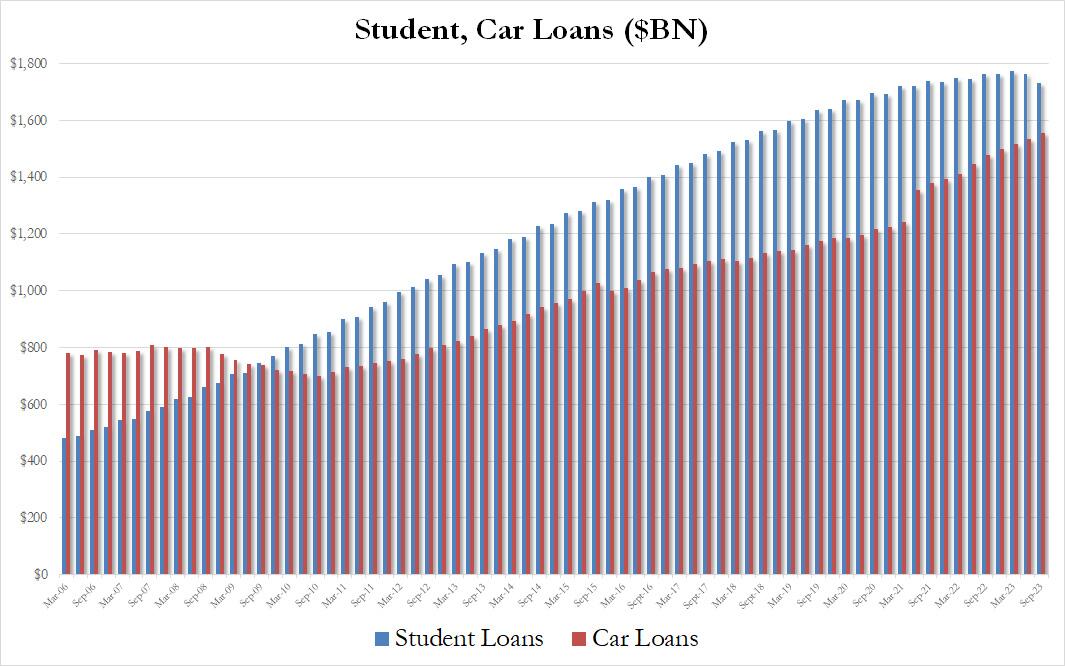
When looking into the details we find something remarkable: while non-revolving credit rose a modest $4.6BN…
… in keeping with the subdued increase in recent months as rates on auto loans make them prohibitive for most consumers while student loans are actually shrinking for the 2nd quarter in a row…
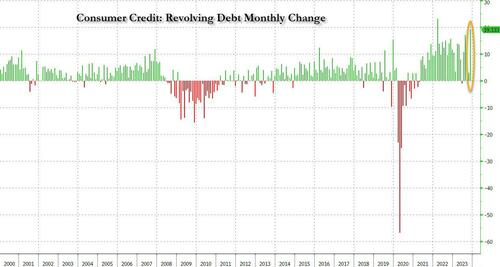
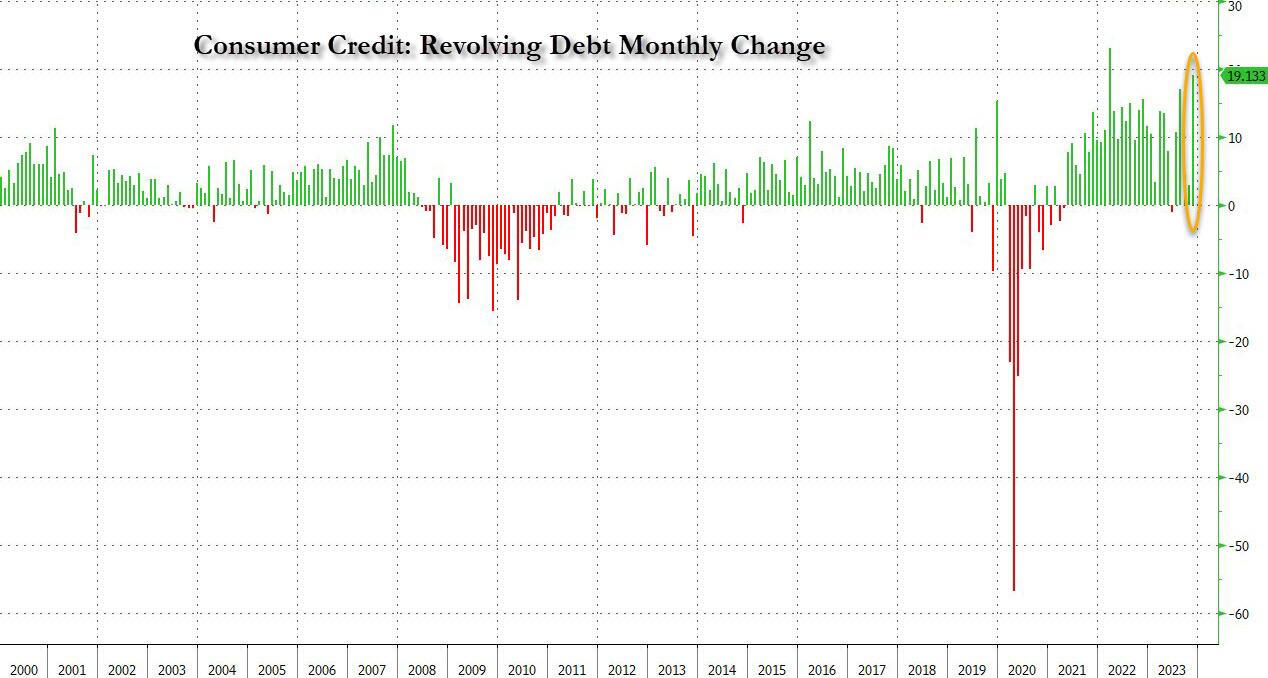
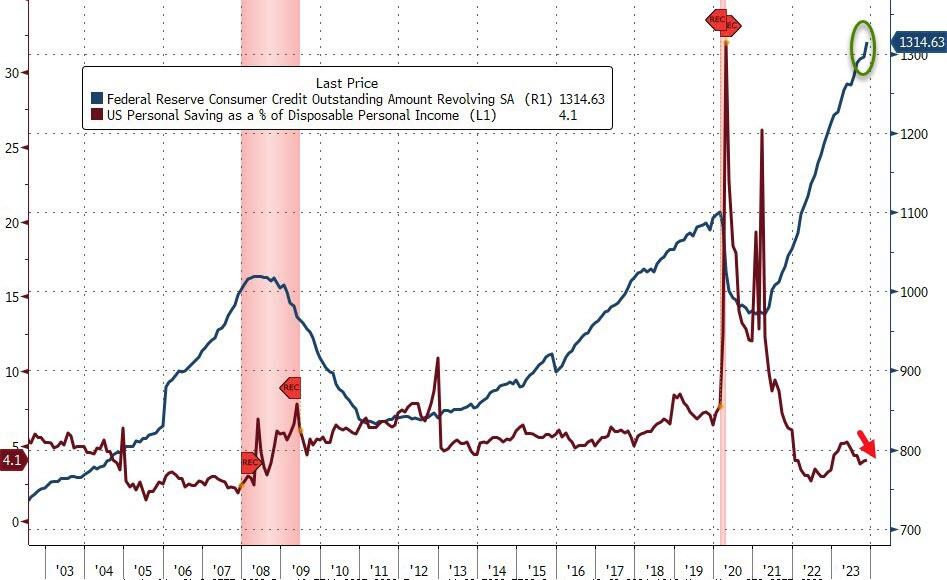
… what was the big shock in today’s data was the blowout surge in revolving credit, which in November exploded by a whopping $19.133BN, a record surge from the $2.9BN in October, and the second biggest monthly increase in credit card debt on record!
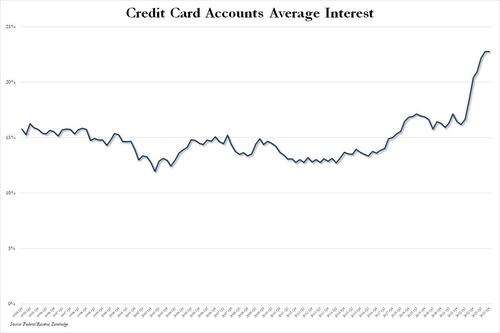
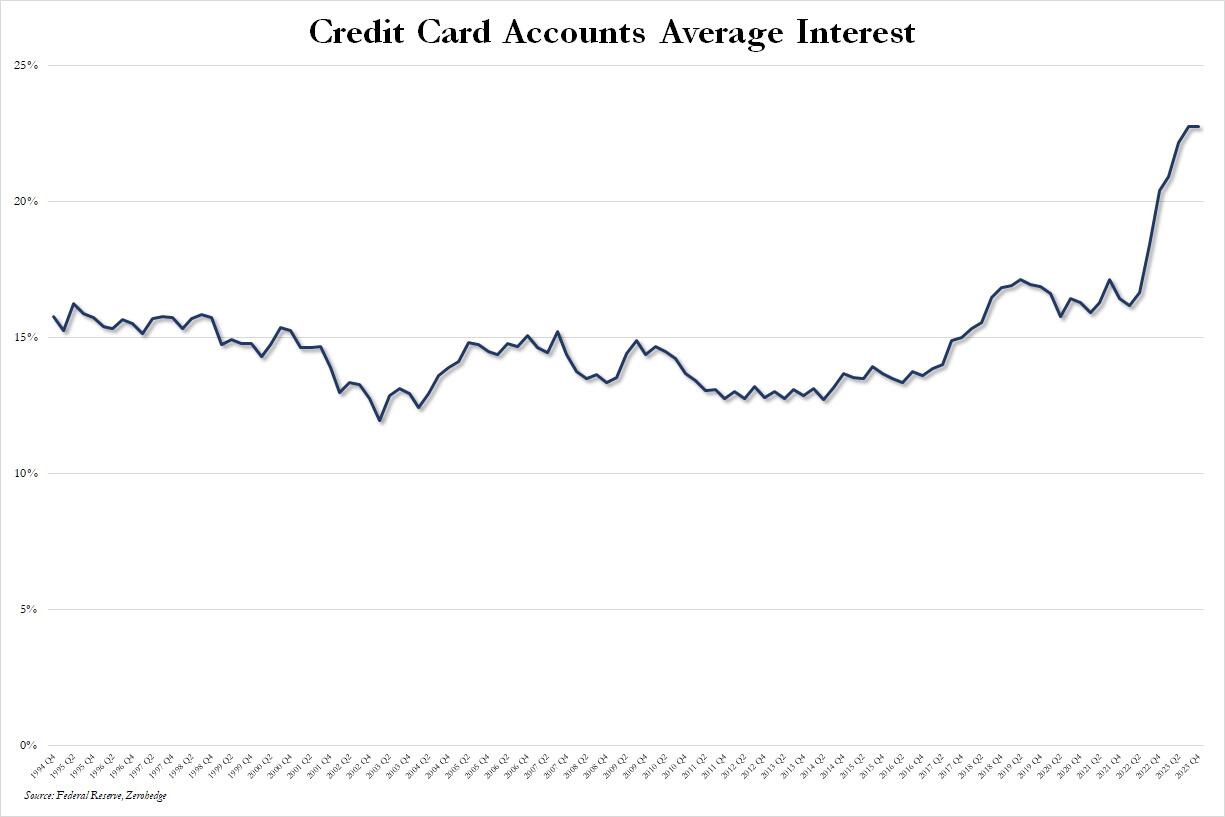
This, despite the average interest rate on credit card accounts in Q4 flat at a record high 22.75% for the second quarter in a row.
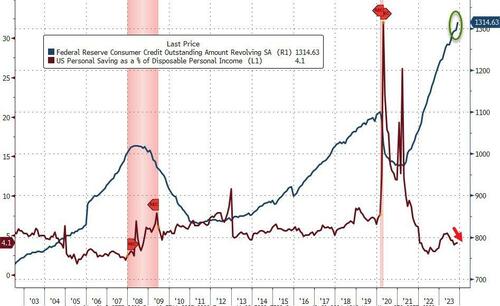
What is especially surprising about this conirmation that the bulk of holiday spending was on credit is that it takes place after several months of relative return to normaly, when consumers appeared increasingly reluctant to max out their credit cards due to record high rates, and at a time when the personal savings rate in the US has collapsed back near multi-decade lows in recent months.
Well, it now appears that Americans have once again done what they do so well: follow in the footsteps of their government and throw all caution to the wind, charging everything they can (and whatever they can’t put on installment plans which also hit a record late last year) including groceries, on their credit card, and praying for the best… or not even bothering to worry about what comes next.
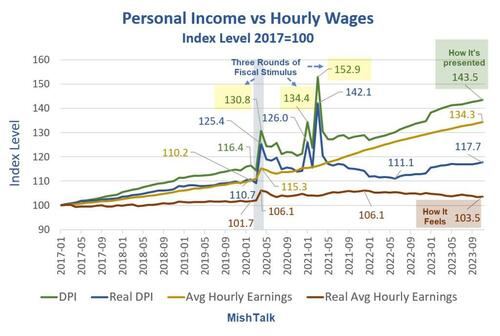
Income is rising and so are wages. Even real income is up. But real wages are another matter.
Personal income data from the BEA, hourly wages from the BLS, real hourly earnings and chart by Mish.
Personal Income vs Hourly Wages Notes
DPI means Disposable Personal Income. Disposable means after taxes.
Real DPI means inflation adjusted using the Personal Consumption Expenditures (PCE) deflator. Real DPI is a BEA calculation.
Average hourly earning are for production and nonsupervisory workers.
Real wages are deflated by the Consumer Price Index (CPI) not the PCE.
The BLS does not report a real hourly wage. I used the CPI-W index for production and nonsupervisory workers, produced by the BLS, as the deflator.
Personal Income Definition
The BEA defines personal income as “Income that people get from wages and salaries, Social Security and other government benefits, dividends and interest, business ownership, and other sources.”
Rental income is a part of other sources.
Three Rounds of Fiscal Stimulus
Round 1, March 2020: $1,200 per income tax filer, $500 per child(CARES Act) – Trump
Round 2, December 2020: $600 per income tax filer, $600 per child (Consolidated Appropriations Act, 2021) – Trump
Round 3, March 2021: $1,400 per income tax filer, $1,400 per child (American Rescue Plan Act) – Biden
The three rounds of free money fiscal stimulus (literally a helicopter drop), plus eviction moratoriums put an unprecedented amount of money in people’s hands. In addition, unemployment insurance paid people more to not work than they received working.
The third round of stimulus under Biden was totally unwarranted. However, it is also worth noting that Trump wanted a much bigger second stimulus package than the Republican Congress gave him. Trump is no fiscal hero.
The three stimulus packages, on top of supply chain disruptions, energy disruptions due to the war in Ukraine, and Bidenomics in general, set in motion the biggest wave of inflation in over 30 years.
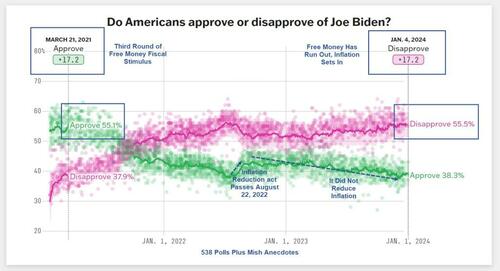
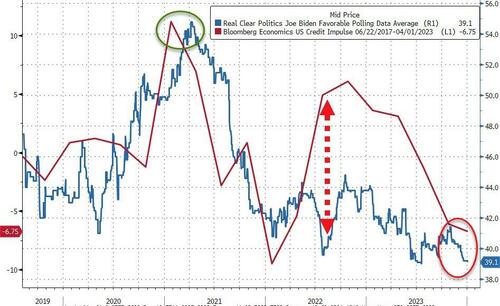
Biden went from an approval rating of 17.2 percent to a disapproval rating of 17.2 percent.
Peak Free Money
In addition to declining real wages, perhaps Biden’s big problem is the free money has run out.
Biden’s popularity peaked in March of 2021 along with stimulus. Was that a honeymoon impact or peak free money?
[ZH: While not a perfect indicator, the lagged US credit impulse perhaps provides a proxy for US fiscal excess and when overlaid with Biden’s approval rating, it is clear that 2022’s re-acceleration did nothing for people’s faith in him… and it’s only got worse…]
I suspect a bit of each coupled with hope of more free money, especially student loan forgiveness.
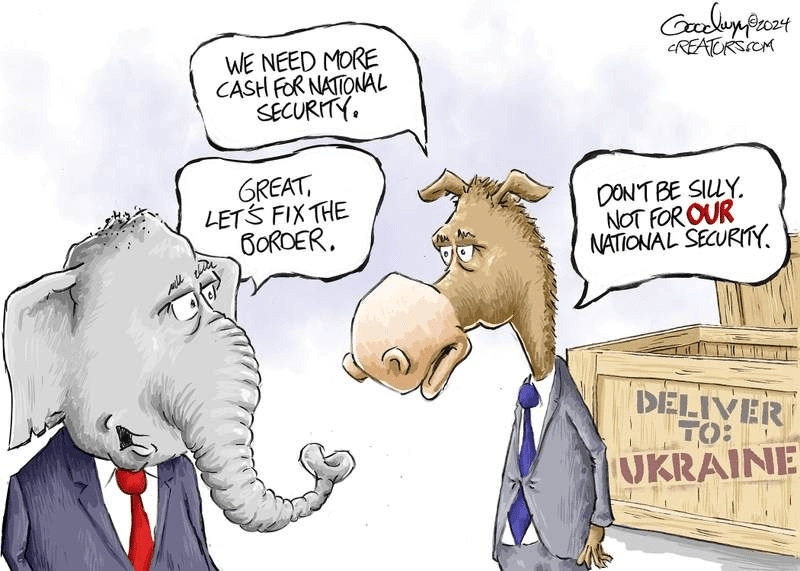
Sending free money to Israel and Ukraine does not help perceptions of how Biden is doing. And neither does the border or ridiculous energy regulations that cost people money.
Biden keeps telling people what a great job he has done.
I don’t believe it and most don’t either. And that shows up in the polls no matter what reason you assign.
Can Biden scrounge up some more stimulus? Because the private sector is not doing well under “Open Borders Biden.”
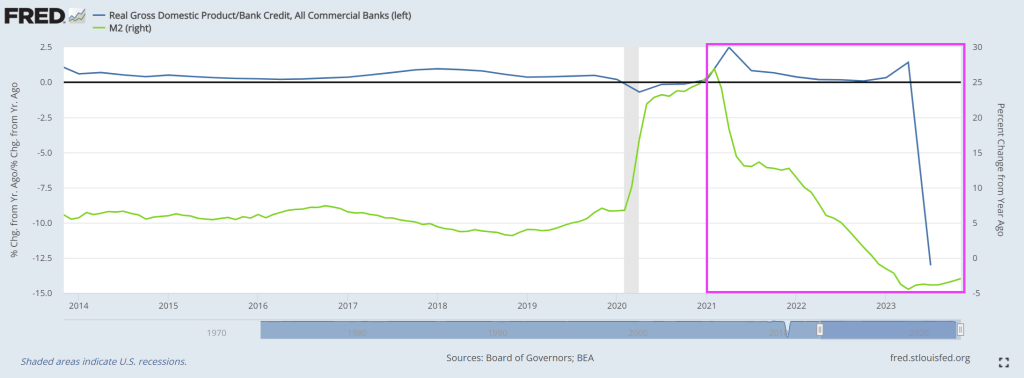
Take a look at this chart of real GDP YoY / Bank Credit YoY on the left axis and M2 Money growth on the right axis. I call this the velocity of bank credit. And it is sucking wind! Crashing to -13 in Q3.
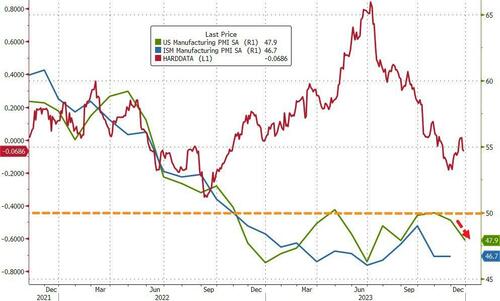
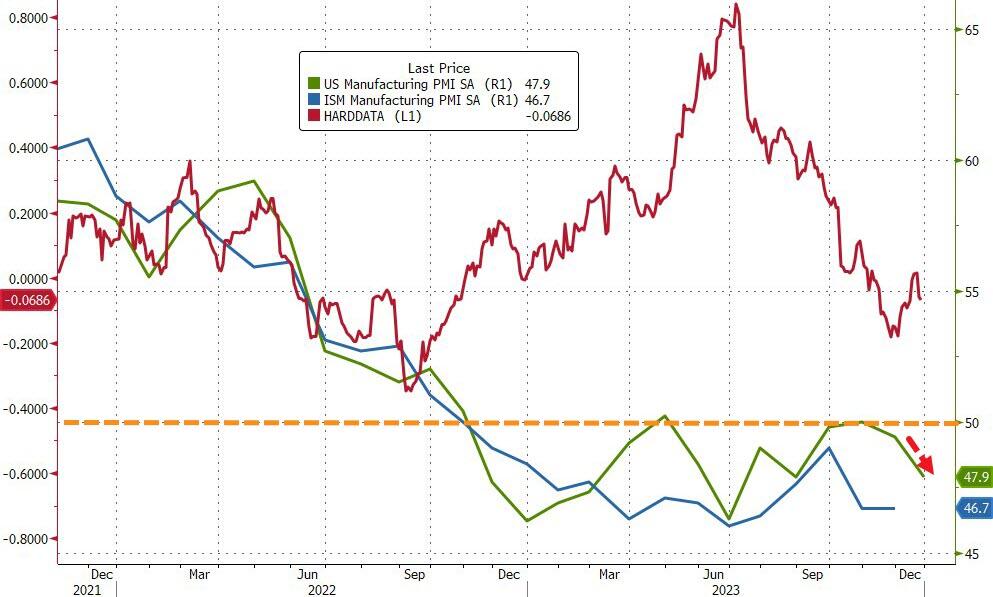
Then we have US manufacturing PMI saw only two months in 2023 that were not in contraction and ended on a decidedly poor note with the final December print dropping to 47.9 (from 48.2 flash and 49.4 prior).
Source: Bloomberg
Across the board it was ugly with:
Renewed contraction in output as orders fall at sharper pace
Rates of inflation pick up
Joint-fastest drop in employment since June 2020
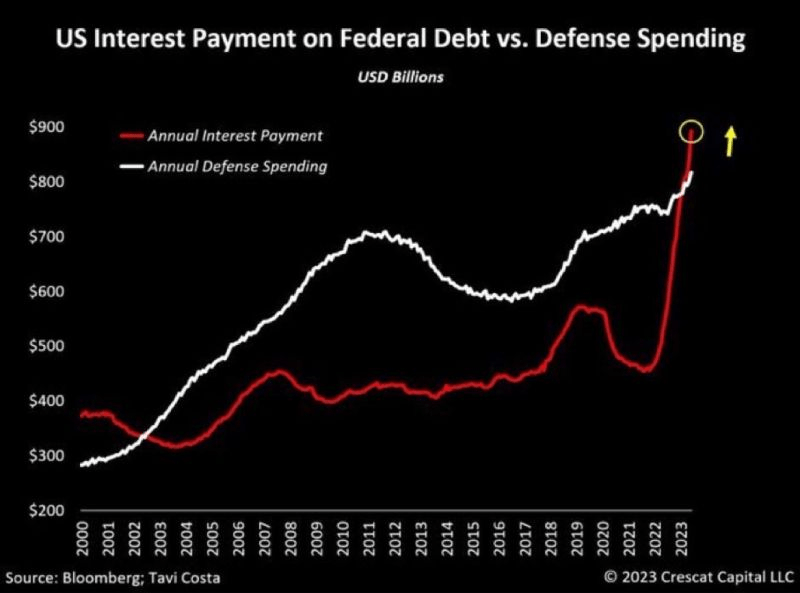
How bad is Biden’s fiscal policy? US interest payments on our bloated Federal debt is now higher than defense spending. Biden isn’t tuff enough to moderate spending or the border invasion.
C’mon Joe. The media has always reported bad news. Warm and fuzzy doesn’t anger people, but bad news does! And under Bidenomics, there has been a lot of bad news.
President Biden railed against corporate media before he and several family members headed by helicopter to Camp David, the presidential retreat in the mountains of western Maryland.
Before boarding the presidential helicopter, Biden was asked by one reporter: “What’s your outlook on the economy next year?”
The president responded: “All good,” adding, “Take a look. Start reporting it the right way.”
Sounds like Biden watched the Travola/Jackson flick “Basic” where the infamous line was uttered “Tell the story right.”
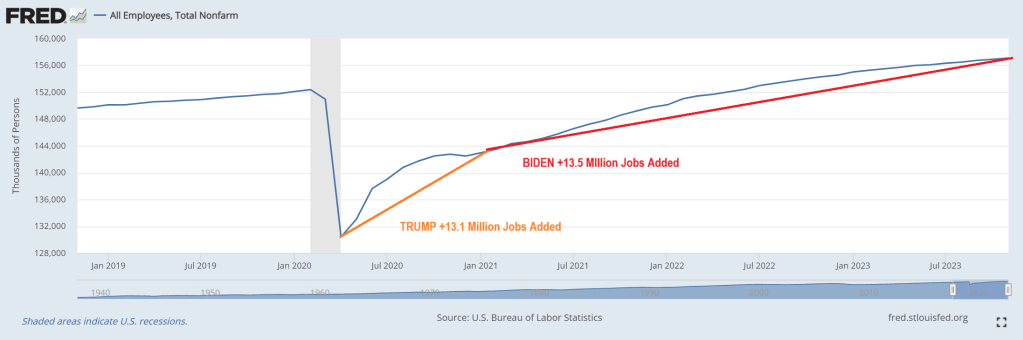
OK Joey, let’s tell the story right. After the horrendous economic shutdowns of local economics and schools in 2020, 15.1 million jobs were added after the shutdowns ended in just 10 months. Wow, that was simple! But under Biden’s Reign of Economic Error, only 15.5 million jobs were added over the next 34 months.
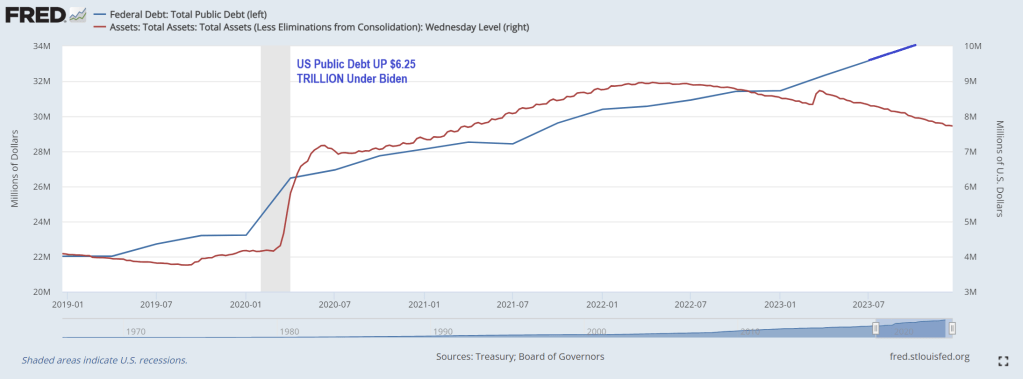
But Biden’s record on jobs comes at the expense of an additional $6.25 TRILLION IN PUBLIC DEBT.
With $34 trillion and rapdily growing debt and budget deficits, it is hard to find good news about Bidenomics.
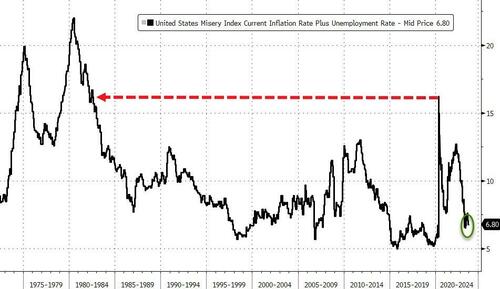
The ‘Misery Index’ is near its lowest level since pre-COVID, but Misery Index masks the true horrors of Bidennomics: 20% higher food prices, 19% higher rents and 61% higher gasoline prices under Bidenomics.
The sum of U.S. unemployment and inflation – known as the “misery index” – fell to 6.8% in November from 7.5% the previous month. That’s the lowest since the summer and fast approaching pre-Covid levels.
The misery index is calculated by adding up the current unemployment rate (3.7%) and the inflation rate (3.1%). The formula provides a simple way to gauge whether the well-being of Americans is improving or not.
Misery peaked in April 2020 when the index spiked to 15%, the highest since 1982. Conditions have improved since the early onset of Covid, but it hasn’t been smooth sailing.
After falling back to 7.7% in January 2021, the index re-accelerated over the next two years as inflation surged. The misery index was 12.5% in June 2022—the same month that annual inflation hit 9.1%.
The unemployment component of the index has been faring well since Covid emergency measures were lifted back in 2021. The unemployment rate has remained below 4% for nearly two years—even as the economy begins to slow.
But economists warn that the misery index doesn’t offer a complete picture of how the average American is doing.
You can tell just by asking them how they feel about the economy and personal finances.
How do Americans really feel?
Economist Greg Ip, who heads economic commentary at The Wall Street Journal, compared the misery index to the University of Michigan’s consumer sentiment index—one of the most closely-watched consumer surveys.
“Based on historic correlations, sentiment has been more depressed this year than you would expect given the level of economic misery,” Ip wrote, arguing that consumers are more pessimistic than the misery index would suggest.
A deeper dive into the sentiment data reveals that Americans are still frustrated about inflation and the impact of high interest rates on their finances. And while the consumer sentiment index rose in December—breaking a four-month skid—some economists attributed it to a temporary holiday boost ahead of Christmas.
“Consumer spirits are perking up for the holiday season which is a sign Christmas is still coming this year,” said Christopher Rupkey, chief economist at FWDBONDS, a New York-based financial research company.
A separate sentiment survey from LSEG/Ipsos paints an even less enthusiastic picture of the average consumer.
The December primary consumer sentiment index—which measures Americans’ attitudes toward jobs, investments, the economy, and personal finances—declined from November and was only up slightly compared to 12 months earlier.
According to the survey, attitudes toward the current situation, investments, and jobs “showed significant declines this month.”
The impact of cumulative inflation
As Creditnews Research reported in a recent study, Americans aren’t celebrating the slowdown in inflation because they’re still reeling from the cumulative price increases of the past three years.
While inflation has fallen to 3.1%, consumer prices have increased by a cumulative 19% since the start of 2020. Food prices are up a whopping 25% over that period.
Americans spent the better part of two years—April 2021 to January 2023—seeing inflation grow faster than their paychecks. That trend reversed in February of this year.
But even with stronger purchasing power this year, the vast majority of Americans (92%) said they reduced their spending in the six months through September, according to a Morning Consult survey for CNBC.
A majority of respondents across all wage brackets said current economic conditions negatively impacted their finances.
So, while the Misery Index indicates that the inflation RATE has slowed, it masks the fact that Americans are far worse off under Bidenomics.
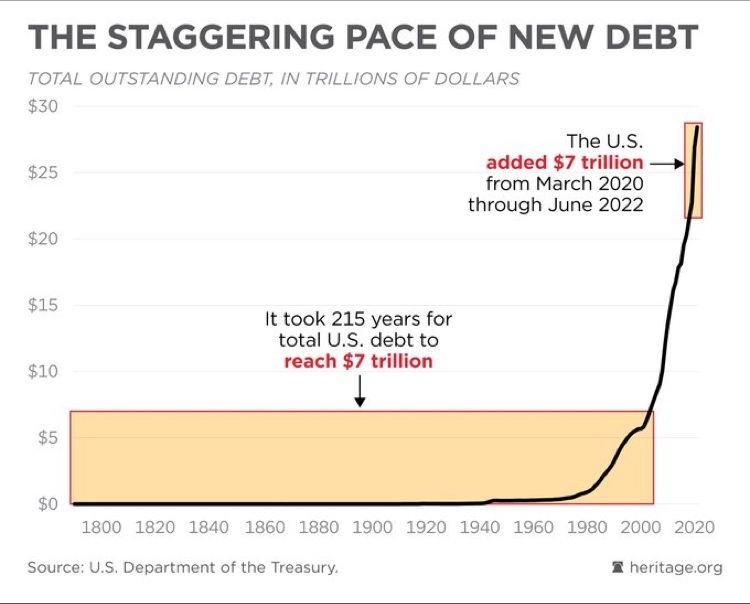
The Federal government added $7 trillion in debt since 2020 while it took 215 years to get to $7 trillion before Covid and Bidenomics.
In what can simply be called fiscal insanity, The Federal government is borrowing like there is no tomorrow (given that Biden is 81 years old, this isn’t far off) displacing businesses and households. Heaven help us if the Federal government has to borrow more money to fight a real war like World War II.
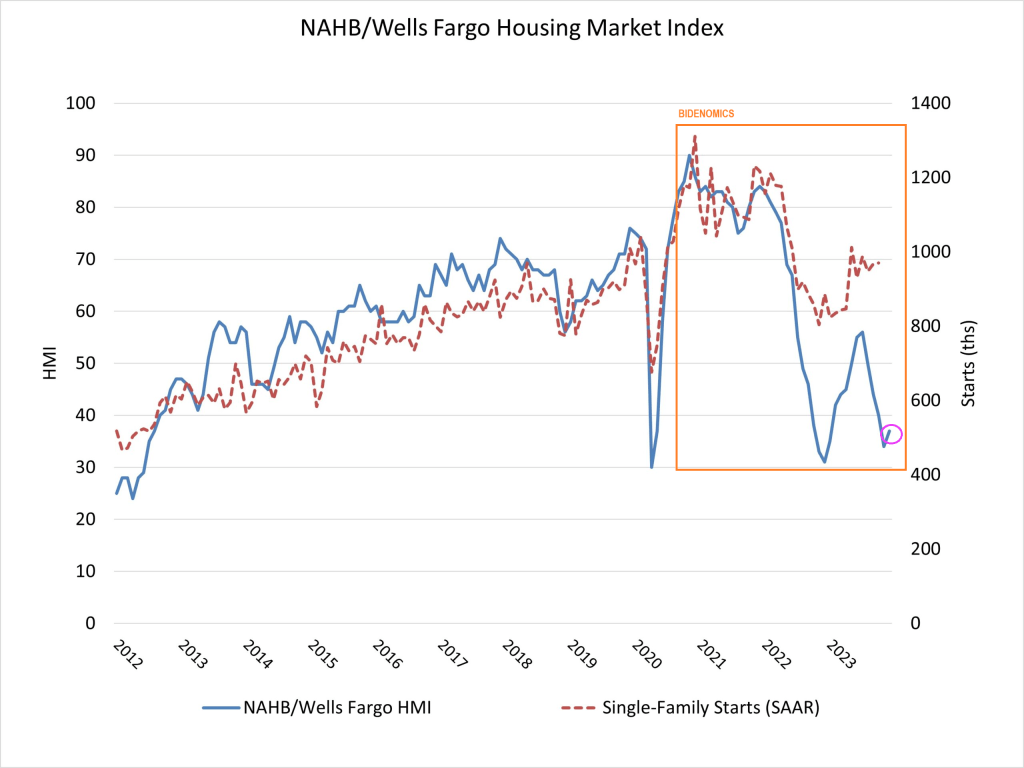
So, the massive Federal debt gorging isn’t helping the housing market.
Both the US Federal government and California’s government are facing a fiscal inferno. Thanks to a softening economy and inane fiscal policies.
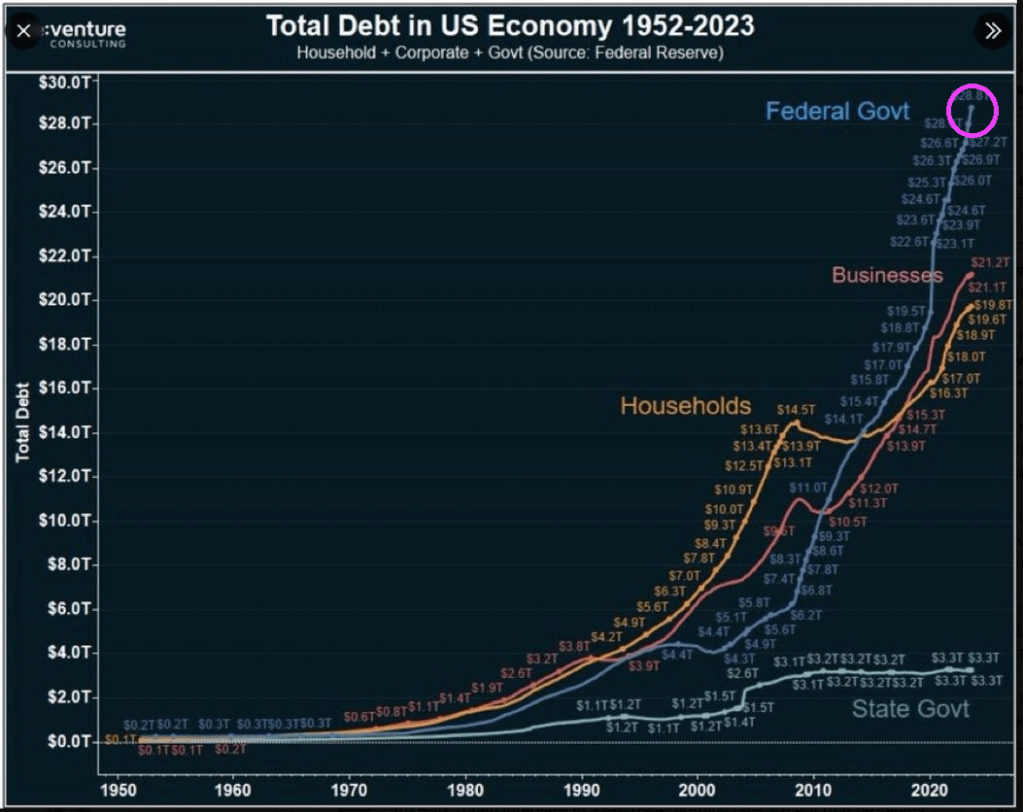
At the macro level, we see that The Federal government has gone wild spending money and borrowing it. Much more than businesses and households. Biden’s wild spending reduces the degrees of freedom that Treasury has if the US slips into another recession or depression.
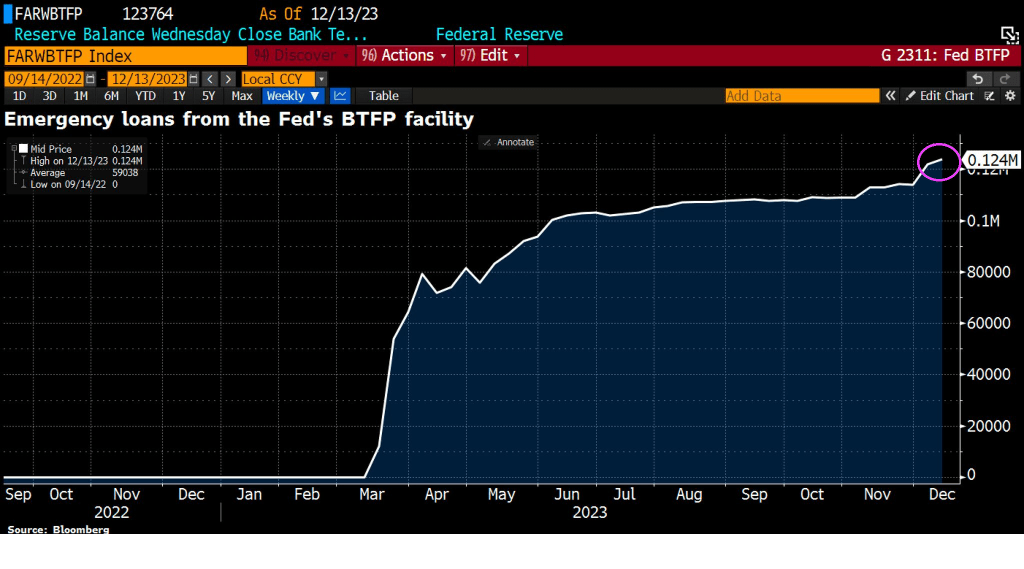
First, let’s begin with banks to illustrate the worsening condition of the economy. Emergency loans from The Fed’s Bank Term Funding Program (BTFP) is on the rise, signaling perceived trouble in the economy.
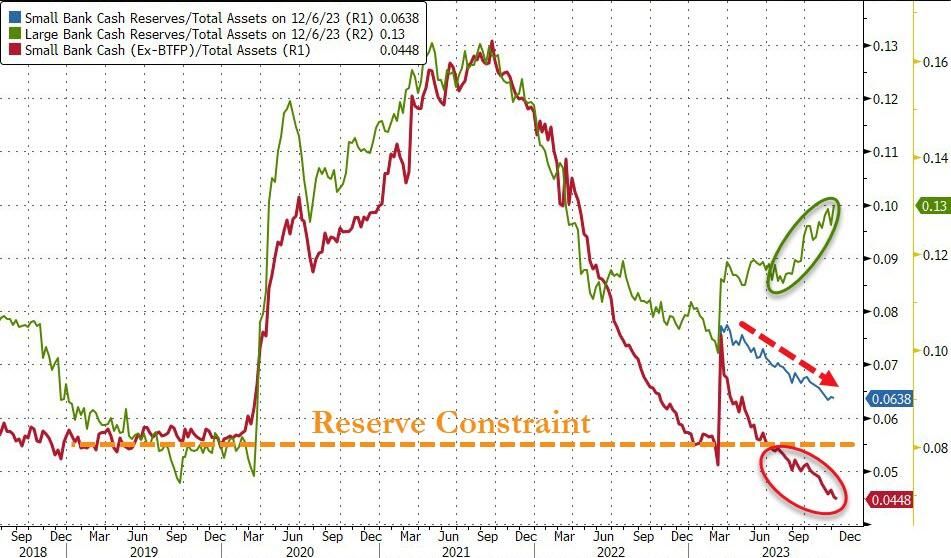
Small banks are suffering more than big banks.
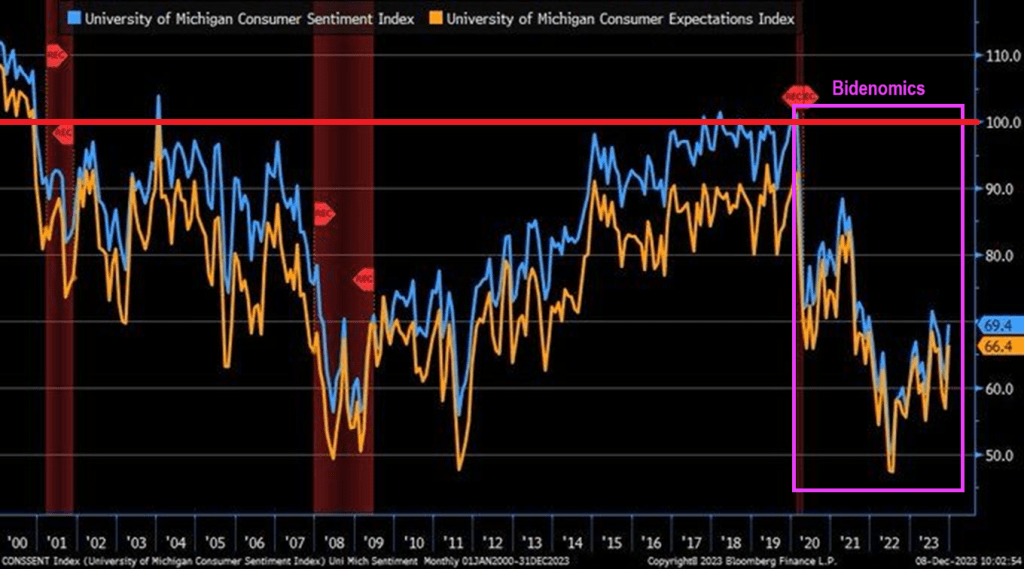
Consumer sentiment is below 70 (100 baseline) under Biden and Bidenomics.
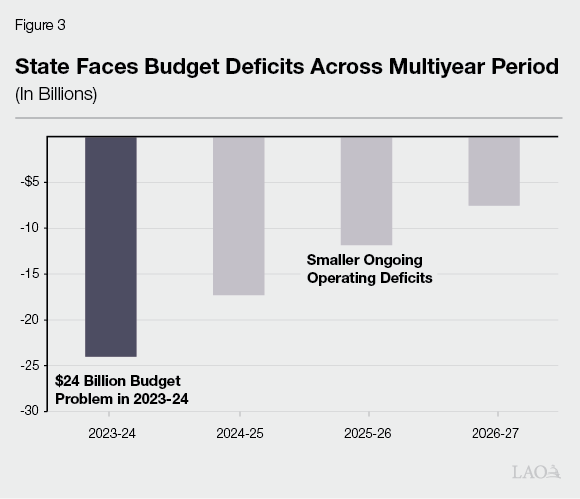
And then we have Gavin “Gruesome” Newsom and California. California is now facing a $68 billion deficit. It has also defaulted on a $20 billion loan from the federal government. The situation is so dire the state is telling agencies not to replace broken printers or re-stock office supplies. Workers are being stripped of benefits and could face furloughs. This is all happening as the state has spent billions funding High-Speed Rail and expanding Medi-Cal to all undocumented immigrants, while losing billions in tax revenue from people leaving the state.
$68 billion is over twice this forecast deficit of $24 billion.
But never fear. “Billions Biden” will make sure California is okay, ar least until the 2024 Presidential election.
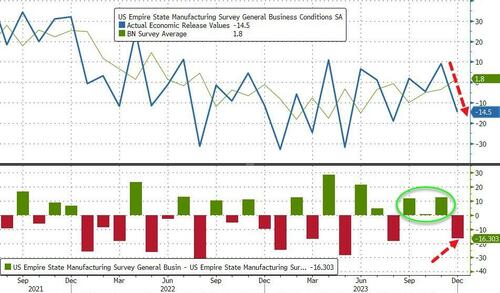
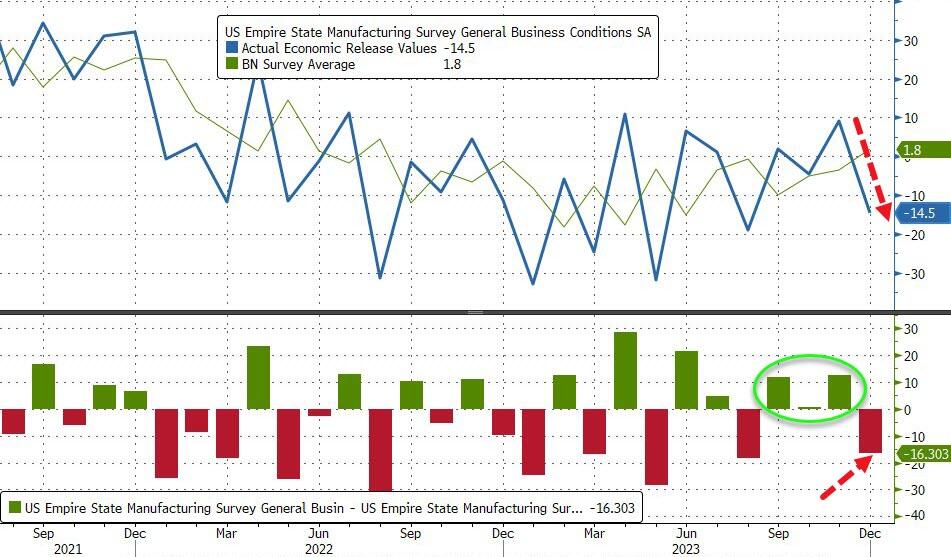
The drop takes the measure from ‘expansion’ at 7-month-highs to ‘contraction’ at 4-month-lows…
Source: Bloomberg
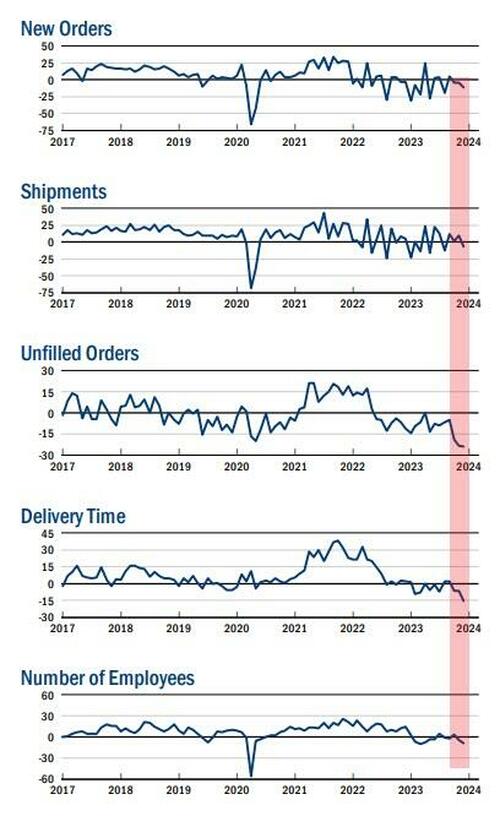
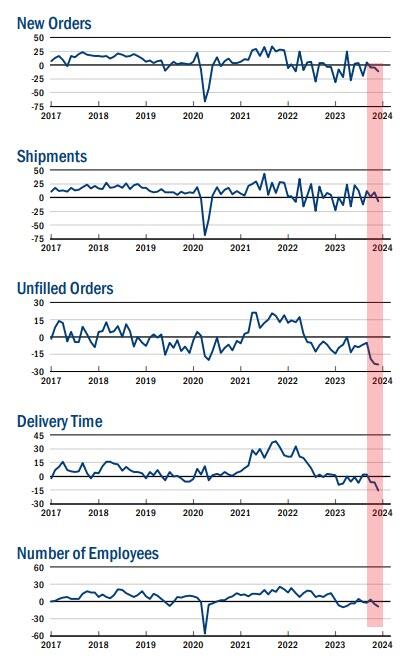
The new orders fell six points to -11.3, pointing to a decline in orders for a third consecutive month, and the shipments index fell sixteen points to -6.4, indicating that shipments fell.
The unfilled orders index held steady at -24.0, a sign that unfilled orders continued to fall significantly.
After rising into positive territory last month, the inventories index retreated fourteen points to -5.2, suggesting that inventories moved lower.
The delivery times index dropped ten points to -15.6, its lowest reading in several years, a sign that delivery times shortened.
The index for number of employees fell four points to -8.4, its lowest level in several months, pointing to a modest decline in employment levels.
On the bright side, the prices paid index moved down six points to 16.7, suggesting an ongoing moderation in input price increases, while the prices received index held steady at 11.5, a sign that selling price increases remained modest.
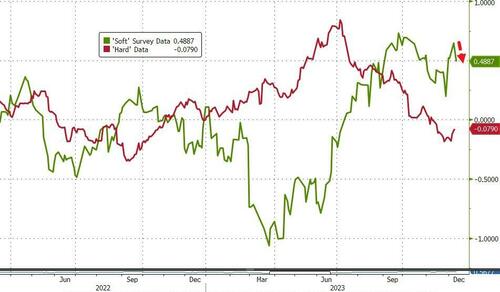
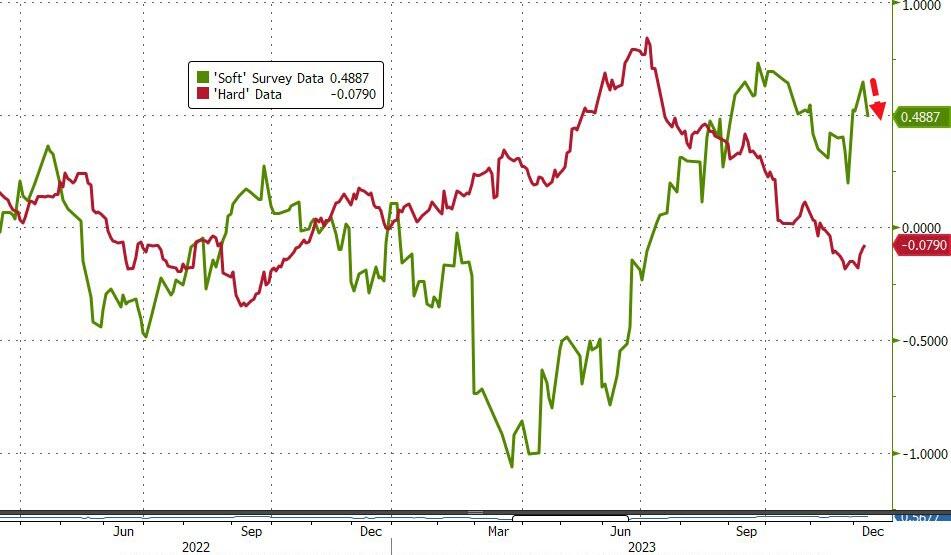
Is this the start of ‘soft’ data’s reversion to ‘hard’ reality?
The Fed – with its six rate-cuts – better hope so.


You must be logged in to post a comment.