Escape From LA! US Home Prices “Cool” To 15.77% YoY In July As Fed Tightens (Miami And Tampa FL Only Metro Areas Over 30% YoY) 12 Of 20 Metro Areas Experienced NEGATIVE Growth From June To July

Welcome to DeSantisville! Miami and Tampa Florida are the only metro areas in the nation (at least of the top 20 metro areas) growing at >30% growth in home prices.

But at the national level, the Case-Shiller National home price index “cooled” to 15.77% growth YoY as The Fed continues to tighten.

My former home, Phoenix AZ, finally is no longer the fastest growing metro area in terms of home prices, relinquishing the crown to Miami and Tampa FL.

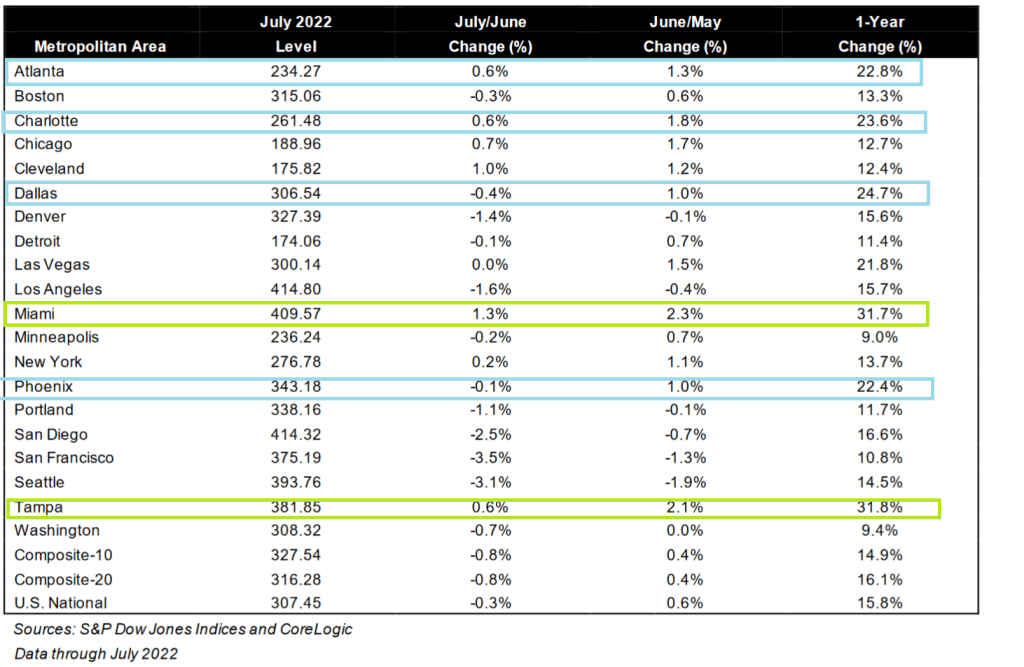
It almost seems that people are trying to escape the mess Gavin Newsome made in California and are escaping to Arizona, Nevada, Florida and Texas. But note that all 20 metro areas are positive in growth YoY, but 12 of the top 20 metro areas experienced NEGATIVE growth from June to July.

Any questions as to whether The Fed is killing the housing and mortgage markets??

On a different note, we see all hell breaking out in Great Britain. Like the US, Great Britain’s inflation is off the charts and the Bank of England is scared about the Pound getting pounded with BofE tightening.

Is FLA governor Ron DeSantis actually Snake Pliskin??

More On Worst Bond Bubble Burst Since 1949! US Yield Curve Inverts To Lowest Since 2000 (US Mortgage Rate Climbs To 6.59%, UP 129% Under Biden)

And I thought the Washington Commanders QB Carson Wentz getting sacked nine times in a game against his former team was bad!

We start the week with another chapter of “The Worst Bond Bubble Burst Since 1949.” This time its the US Treasury 10yr-2yr yield curve inverted to its lowest level since 2000.

Then across the pond, the UK sovereign yield curve is also inverted. But this curve is only inverted to 2008 levels of The Great Recession. The UK 2-year sovereign yield is up over 50 basis points this morning.

Then we have the US Dollar Swaps curve (green line), steeply UPWARD sloping until 6 months, then declining. The same goes for the US Treasury Actives curve (blue line), except that is it steeply upward sloping out to 1 year then begins declining.

And then we have the Bankrate 30-year mortgage rate rising to 6.59%, up 129% since Biden was sworn-in as President.

Also declining since Powell unleashed his monetary Panzers on the economy and financial markets are 1) agency MBS and 2) S&P 500 index.

The stock market’s value is down $7.6 trillion since Biden took office.

When I saw Carson Wentz of the Washington Commanders getting sacked 9 times, I thought maybe Prince Harry was playing instead. Or maybe Meghan Markle.

Price Harry is on the left, Commanders QB Carson Wentz is on the right.

US Mortgage Payments Up 45.5% YoY Thanks To Fed Tightening Caused By Bidenflation

Biden’s green energy policies (limiting supply) caused a tremendous surge in energy prices and food prices (one has to pay to get food shipped!). But in order for The Fed to cool inflation, they are in the process of tightening their loose monetary policy since late 2008.

One of the consequences (intended or unintended) is that as mortgage rose, homebuyer mortgage payments rose 45.5% YoY.

Fed Raises Target Rate By 75 BPS As Recession Looms, DOT Plots Signals Rates Rising To 4.625% In 2023 Then Reverting Back To 2.5% (Mortgage Rate Rises To 6.38%)

As expected, The Federal Reserve raise their target rate by 75 basis points today. While that sounds like an inflation (blue line)-crushing rate hike, look at the slowly shrinking Fed Balance Sheet (gold line).

Of course, the risk of a recession (dark blue line) is on the increase.

Given the increasing likelihood of a recession, The FOMC’s Dots Project shows The Fed’s target rate increasing to 4.625% in 2023, then gradually declining to 2.5% in the long run.

Fed Funds Futures data points to a peak in May 2023.

And with The Fed’s tighten-up, Bankrate’s 30yr mortgage rate rose to 6.38%.

Why is The Fed so slow to reduce its prodigious balance sheet if they REALLY wanted to fight inflation? So we can’t really say that The Fed has been turned loose to fight inflation.

US Existing Home Sales Plunge -19.87% In August As Fed Tightens Monetary Noose (US Existing Home Sales Sink For 7th Straight Month)

Well, The Federal Reserve is doing what they wanted … crushing the housing market as they fight inflation.

Today we get our first glimpse of the carnage in the housing market from August. With mortgage rates having soared and homebuilder sentiment tumbling (and permits plunging), it should be no surprise that existing home sales were expected to fall for the 7th straight month (-2.3% MoM vs -5.9% MoM in July).

Somewhat surprisingly, existing home sales ‘only’ fell 0.4% MoM in August (from a revised 5.7% MoM drop in July), but that is still 7 consecutive drops. This left existing home sales down 19.87% YoY.

Look at existing home sales YoY as M2 Money Yoy crashes.

Median prices YoY for existing home sales plunged to 7.63% while inventory for sale (yellow line) remains depressed.

Yikes! German PPI Soars To 45.8% YoY (The New Russian Front?)

The war in Ukraine is still going on and Russia is punishing Germany in terms of energy supply.

It is almost as if the Ukraine war is the NEW Russian front for Germany. The German Producer Price Index YoY surged to 45.8% YoY.

German buyers on Monday briefly reserved capacity to receive Russian gas via the Nord Stream 1 pipeline for the first time since the line was shut down three weeks ago, German data showed, but this was later revised and no gas has been flowing.

It was not immediately clear why buyers had submitted requests for capacity when Russia has given no indication since it shut the line that it would restart any time soon.

Russia, which had supplied about 40% of the European Union’s gas before the Ukraine conflict, has said it closed the pipeline because Western sanctions hindered operations. European politicians say that is a pretext and accuse Moscow of using energy as a weapon.

But German inflation, using CPI, is only 7.9%. Something has to give!

On the western front (US), the US Treasury 10yr yield is up +10.2 bps. And sovereign yields in Europe are all above 10 bps.

Fed Tilts Toward Third 75 Basis-Point Hike on Stubborn Inflation (Fed’s Target Rate Expected To Hit 4.395% By March ’23 Then Fall, Mortgage Rates Rising)

Inflation is stubborn because “goin’ green!” by 1) restricting US fossil fuel production and exploration and 2) Biden/Congress endless spending splurge since Covid. So, The Federal Reserve has a tough problem: cooling inflation while US energy prices are up 54% under Biden. And those higher energy prices have percolated through the entire economy in terms of food prices and heating prices.

Where do we sit? The US Treasury 10yr-2yr yield curve remains inverted (a sign of impending recession). Mortgage rates are the highest in 14 years as The Fed tightens.

If we look at Fed Funds Futures data, we can see that traders expect The Fed’s target rate to rise to 4.395% by March 2023’s FOMC meeting. Then traders expect The Fed to take their enormous foot off the tightening pedal.

Yes, inflation is crushing the middle class and low-wage workers. Average hourly earnings YoY after we subtract inflation are negative.

Taylor Rule? Currently, the Taylor Rule based on Core inflation of 4.56% YoY suggests a Fed target rate of 9.14%. Since traders anticipate the target rate to peak at 4.395%, The Fed will almost be halfway towards cooling inflation.

The problem is … Fed Chair Powell and Treasury Secretary Yellen don’t like rules limiting their “power.” Powell and Yellen think the Taylor Rule is a New Jersey ham product.

Weekend Update! Goldman Cuts US Growth Forecast for 2023 After Rate Path Change, FedEx Drops -44 Pts, US Treasury Yield Curve Further Inverts To -42.3 BPS (As Biden Drains The Strategic Petroleum Reserve)

Its a beautiful morning here in Columbus Ohio! Unfortunately, things are not so beautiful for the US economy.

Let’s begin with the US Treasury 10yr-2yr yield curve slope. Historically, the yield curve inverts prior to a recession. As of this sunny morning, the US Treasury yield curve is inverted and sinking further into inversion. Notice that headline inflation (blue line) has increased declined slightly after hitting 40-year highs as The Federal Reserve begins SLOWLY trimming their balance sheet (orange line). The green line is the expectation of Fed rate hikes by the December 2022 FOMC meeting indicating further monetary tightening.

Goldman Sachs Group Inc. cut its US economic growth estimates for 2023 after recently boosting its predictions for Federal Reserve interest rate hikes.

US gross domestic product will increase 1.1% in 2023, economists including Jan Hatzius wrote in a note Friday, compared with a forecast of 1.5% previously. The projection for 2022 was left unchanged at 0%. 

Goldman raised its federal funds rate forecast by 75 basis points over the last two weeks for a terminal rate forecast of 4% to 4.25% by the end of 2022.

Then we have Federal Express which plunged -43.85 points on Friday. I use this an example on how inflation begat Fed tightening that begat an economic slowdown.

The Biden Administration is cheering the “Inflation Reduction Act” and the recent decline in the rate of inflation to a gut-wrenching 8.3% YoY. Bear in mind that since Biden was sworn-in as President, WTI Crude Oil is UP 75%, gasoline prices UP 54%, food prices are UP 48% and the Strategic Petroleum Reserve is DOWN -32%.

Then we have Gold and Bitcoin relative to the INVERSE of the US Dollar since Biden was installed as President.

But I still get to look out my window and see a beautiful day in the neighborhood.

Philly Fed Business Outlook Plunges -10% In September As Fed Tightens Rates (It’s NOT Always Sunny In Philadelphia)

It’s NOT always sunny in Philadelphia.

The Philadelphia Fed Business Outlook fell almost -10% in September as The Federal Reserve tightens monetary policy.

On a related note, the share of total net worth held by the bottom 50% in the US (red line) was always higher than the share of total net worth held by the top 1% (blue line) … until The Federal Reserve began QE in late 2008. Under Obama, the top 1% surpassed the bottom 50% in terms of share of total net worth. it equalized under Trump and before Covid. Then the massive QE (and surge in Federal spending) to battle Covid seemingly made the rich even richer and the bottom 50% even poorer. This is Biden’s America … massive Federal subsidies to the wealthy, crumbs for the bottom 50%.

Green energy anyone??

NASAQ Index Plunges 4% On Fed’s Inability To Cool Inflation (Gimme Some Quantitative Tightening!)

That’s the way The Fed likes it!

On today’s inflation report for August, it is clear that The Fed has failed to cool off US inflation, meaning that MOAR QT is on the way.

The NASDAQ composite index plunged -3.85% after The Fed’s failure was released.

The Dow was down “just” -2.70% today. But things are red all over in Europe where they too are failing to tame inflation.

The Fed is probably singing “Give me some quantitative tightening!”

The likelihood of further rate increases just rose to over 4% for the December FOMC meeting.

Jay and The Statists At The Fed!

Pain is coming!