Overheated Labor Market? US Capacity Utilization Rises To Near 80% (Fed Too Slow To Remove Stimulus As Supply-Chain Strain Increases)

The good news is that US industrial production rose 0.9% in March. The bad news? US capacity utilization rose to 78.3% indicating that the labor market is overheating.

Notice that prior to Covid, The Fed began rising raising its target rate as capacity utilization was increasing towards 80%. But once The Fed Funds Target rate (upper bound) hit 2.50%, capacity utilization started to cool off. Then Covid stuck.

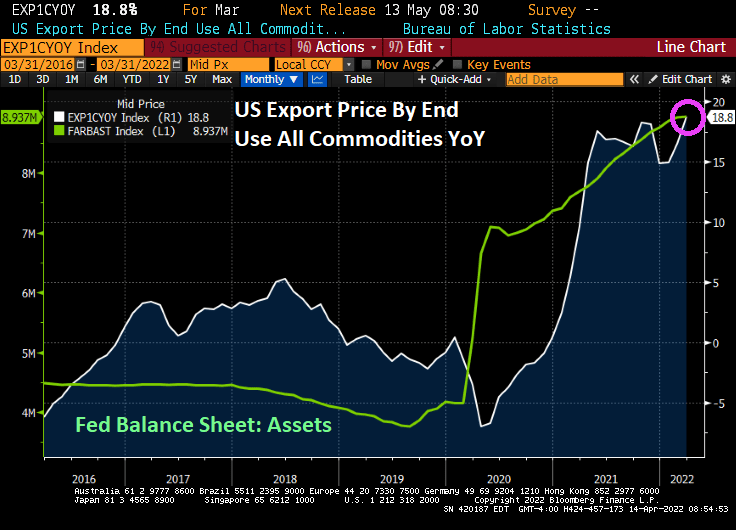
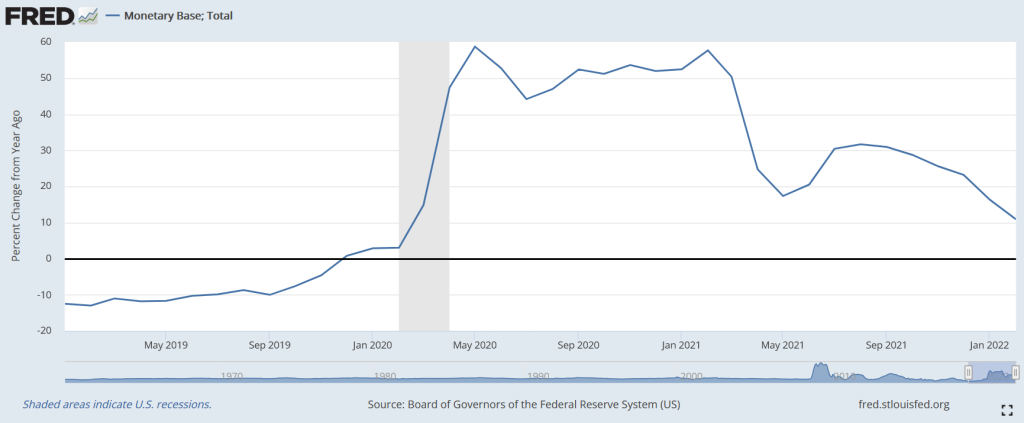
Since Covid struck and The Fed massively expanded its balance sheet, capacity utilization has increased. But this time around, The Fed has been sloth-like in its removal of monetary stimulus.

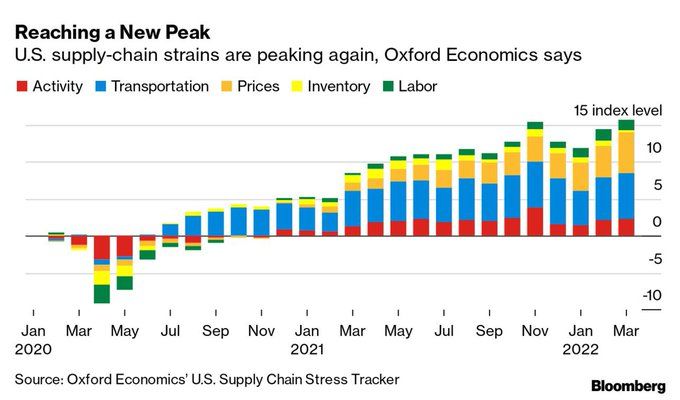
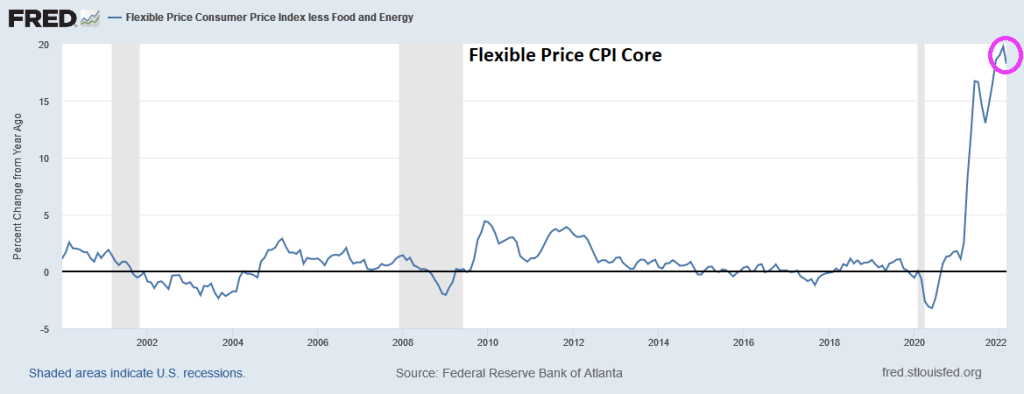
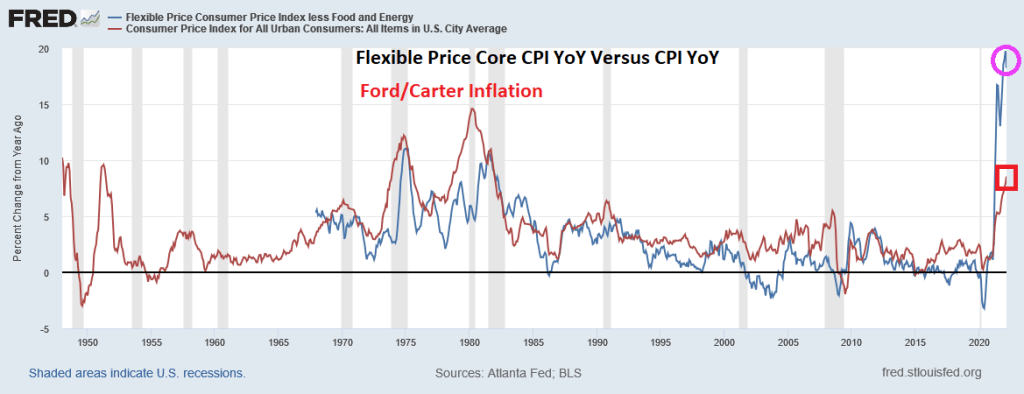
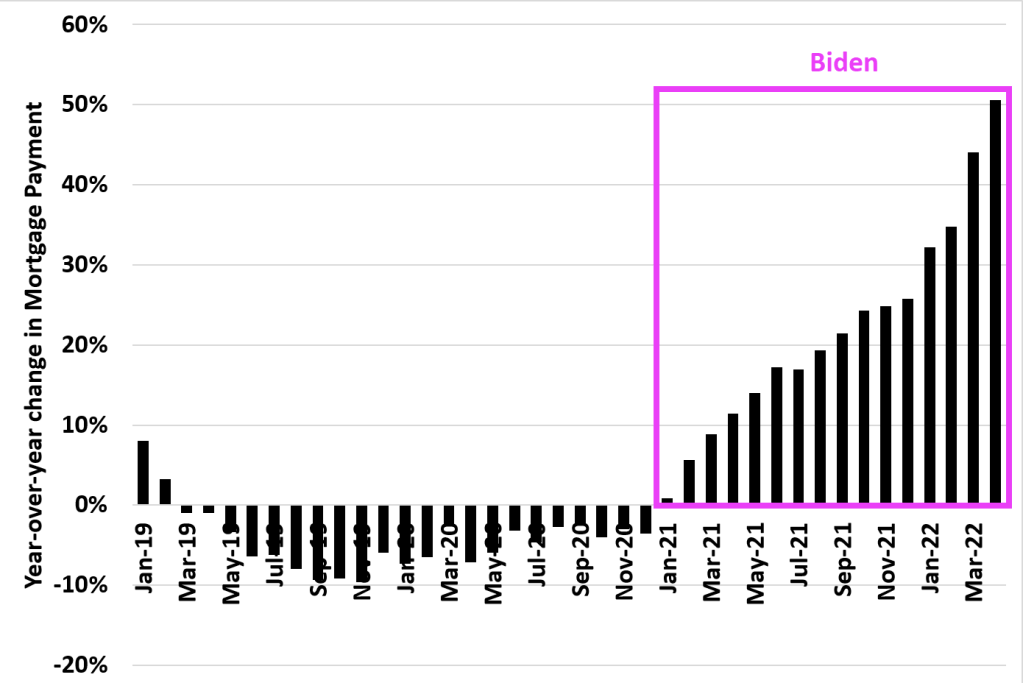
Of course, The Fed has been slow to cool inflation which is the highest in 40 years. And supply-chain strains are peaking again (isn’t Mayor Pete in charge of infrastructure?) This is helping to drive prices up.

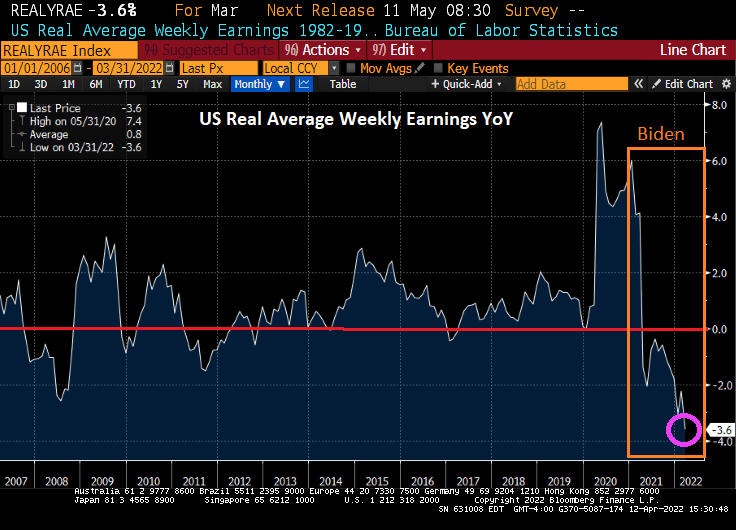
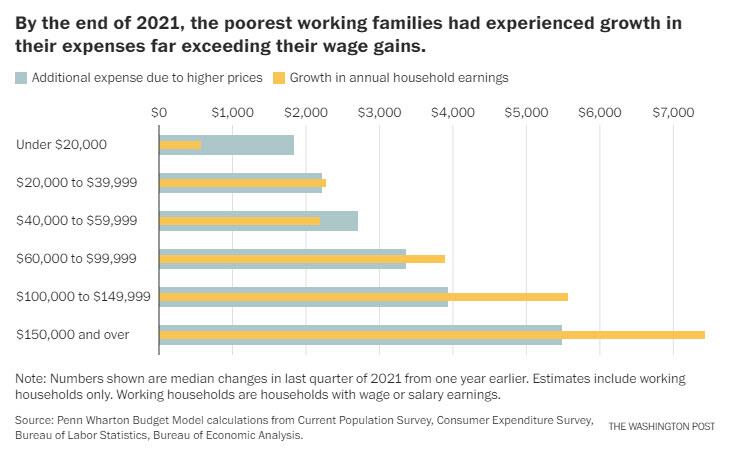
And don’t forget that REAL average weekly earnings YoY are falling.

Here is Fed Chair Powell explaining how The Fed will withdraw its historic monetary stimulus.

Stimulypto! How The Federal Reserve Helped Drive Property Taxes Above $10,000 In New York City (NYC Home Prices UP 26.3% Since February 2020, Chicago UP 21.7%, LA UP 32.5%)

As we are all aware, The Federal Reserve launched its monetary “stimulypto” in March 2020 to combat the Covid virus. Coupled with the surge in Federal stimulus, we have seen home prices rise over 20% since February 2020.

Specifically, New York City home prices are up 26.3% since February 2020, Chicago home prices are up 21.7%, and Los Angeles home prices are up 32.5%. Fed monetary stimulypto is up 113% since February 2020.

Of course, this has resulted in soaring PROPERTY TAXES as well. According to Attom Data Services,Among 1,481 U.S. counties with at least 10,000 single-family homes in 2021, 16 had an average single-family-home tax of more than $10,000, including 12 in the New York City metro area. The top five were Kings County (Brooklyn), NY ($13,734); Marin County, CA (outside San Francisco) ($13,719); Westchester County, NY ($13,674); Essex County, NJ ($13,116) and Nassau County, NY ($13,095).”

Of course, not all metro areas raised their property taxes. Major markets with the largest decreases in average property taxes included Pittsburgh, PA (down 35.1 percent); New Orleans, LA (down 20.2 percent); Houston, TX (down 18.7 percent); Dallas, TX (down 12.2 percent) and Austin, TX (down 7.7 percent).

States with the highest effective property tax rates in 2021 were Illinois (1.86 percent), New Jersey (1.73 percent), Connecticut (1.67 percent), Vermont (1.55 percent) and Pennsylvania (1.37 percent).

Even if The Federal Reserve removes its massive monetary stimulypto (MMS), property taxes will remain elevated unless cities reduces their property tax rates. But Democrat-controlled cities tend to be addicted to spending much like The Federal government.

You might as well face it, they’re addicted to gov.

Going Down! Export Prices Rise To 18.8% YoY (Highest In History) While Import Prices Rise To 12.5% YoY (Mortgage Credit Availability Plunge With Covid)

Like what Freddie King sang (Going down), we are going down the drain.

Export prices by end us YoY is up to 18.8%, the highest in recorded history (or since 1983 when they started recording export prices).

Import prices by end use rose to 12.5% YoY.

Unrelated to US export and import prices, the MBA’s mortgage credit availability index slumped with the Covid outbreak and the explosion of The Fed’s Balance Sheet. As I have said before, nothing has been the same since Covid.

Like Freddie King, “I’m Feeling Torn Down” by rising prices.

PPI Final Demand Prices Highest In History As 2Y Treasury Yield Declines, Mortgage Rates Steady At 5.14% (All Roads Lead To … Joe And Jay)

Harry Truman once uttered the phrase “The buck stops here.” Joe Biden’s catchphrase should be “It’s Russia’s fault!”

Well, all roads led to Joe and Jay. Here is a chart of Producer Price Index (Final Goods) prices YoY, now the highest in history. At least, gasoline prices are declining to $4.083 (they were $2.40 when Biden was installed as President). But inflation is out of control and the 30-year mortgage rate is now 5.14% (mortgage rates were 2.82% in February 2021 just after Biden took control).

Just in case you wonder why I follow Fed Funds Futures data so closely.

Equity markets are up strongly today as markets sense a weakening in resolve by The Federal Reserve (number of expected rate hikes dropped at 10AM EST).

It appears that we have a “Powell in the headlights” problem.

Fed’s Dual Mandate Derby! Misery Index Hits All-time High (Flexible Price Core Inflation Losses At 21.82% Overwhelming Employment Gains)

The Federal Reserve’s two goals of price stability and maximum sustainable employment are known collectively as the “dual mandate.” Unfortunately, inflation is running away (bad) from employment gains (good). Sort of like “The Good, The Bad and The Ugly.” But just the Good and The Ugly combine to create the Misery Index.

Here is the Atlanta Fed’s CORE flexible CPI YoY for March. The good news? Flexible Core CPI YoY was a little lower than the historic high reading in February. The bad news? We are still talking about 21.82%+ rise in prices (down from 23.56% in February).

If I use the Atlanta Fed’s flexible consumer price CORE index combined with the U-3 unemployment rate, we see that March’s inflation report plus U-3 unemployment is generating a misery index that was last seen in July 2008 during The Great Recession. Unless we consider the July 2021 reading of 31.3%, so we have seen two horrible misery index readings under Biden.

If we look at the Misery Index since 1967, we now have the GOAT (Greatest of All-time) Misery.

Now, inflation under Presidents Ford and Carter (red line) were higher than the flexible core price index (blue line) in the 1970s and 1980. But flexible core price CPI YoY is substantially higher than March’s CPI growth of 8.5%.

The bottom line is that inflation losses are far outweighing the employment gains, resulting in elevated misery.

Misery. We are all feeling it.

Inflation Nation! Real Average Weekly Earnings Growth Lowest Since 2007 (-3.6%) While Mortgage Payments UP 50% (US Treasury 2Y Yield Dumps 12 Basis Points)

Feeling hot, hot, hot! Inflation, that is.

US real average weekly earnings growth YoY is down to -3.60%. That is the lowest since 2007 and is worse than The Great Recession and financial crisis of 2008.

And look at this chart of mortgage payments under Biden. The US was actually experiencing DECLINING mortgage payments YoY in 2019 and 2020. But under Biden’s leadership, mortgage payments have increased by 50% making housing even MORE unaffordable for the middle class and lower-income households.

And now for something kind of scary. The US today suffered a 12 basis point decline in the 2-year Treasury yield, generally a bad sign for the economy. As if we needed more bad news for today.

Highest inflation in 40 years, worst wage growth since 2007 and rising mortgage payments. We will need all the luck we can get.

T-Dazzle! Inflation Crushing Households Under $60k, Russian CDS Indicating 99% Probability Of Russia Debt Default Over Next Year (WTI Crude UP 2%+, Wheat UP 3%+)

As we are painfully aware, The Fed’s exaggerated monetary flood combined with Federal stimulus spending has led to horrible inflation.

Yes, despite what government talking heads say, Federal stimulus increases demand for goods, the supply is generally slow to respond resulting in rising prices. Then government policies driving up energy prices also leads to highers prices. Throw in Federal Reserve monetary stimulypto and we have this chart from hell from Penn-Wharton. The chart shows that households earning less that $60,000 experience higher expenses due to rising prices than their gain in earnings.

Speaking of the government push to “go green” I saw an ad for a Mercedes Benz EQ sedan that I admit looked really cool, but no price given. I went to Car and Driver’s website and it said “Starting at $103,360.” I’ll take a hard pass, but you can see why households making over $150,000 per year have rising additional expenses due to price increases. To paraphrase April Ludgate, “Thanks for nothing President Biden and Fed Chair Powell.”

Another chart from hell is the Russian USD Credit Default Swap (CDS) curve. It is spiking at over 20,000.

The one-year Russian CDS is currently at a whopping 20,336 indicating that there is about a 99% of a Russian default over the coming year. As someone who lived through the 1998 Russian credit default scare on Wall Street, this will send a shock wave through credit and Treasury markets.

On the US Treasury front, this chart shows how steeply sloped the US Treasury actives curve has become. Steep until 3 years, then flat. I call this chart “T-Dazzle!” T-Dazzle because I can’t believe how badly the Biden Administration and The Federal Reserve are screwing up the country.

Crude oil? WTI Crude is back to almost $100 per barrel while Brent Crude is at $102.78 per barrel. Wheat is up 3.22% thanks largely to problems related to Russia invading Ukraine (Europe’s bread basket) and a dismal Chinese wheat harvest.

Cryptocurrencies, the alternatives to the US fiat dollar, are rising (in particular, Bitcoin and Ethereum).

Of course, I have to finish up with the soaring 30-year mortgage rate.

Here are Treasury Secretary Janet Yellen and Transportation Secretary Pete Buttigieg trying to convince people that Treasuries are fantastic and to avoid alternatives to fiat currency like Bitcoin, Ethereum, Stablecoin or anything else.

Biden’s Fastest Economic Recovery In History? Or Recession? Flexible Inflation Rate Hits 20% And Q1 GDP Stalled At <1% (Real Average Hourly Earnings Dive To -2.72% YoY) As Fed Drive Rates Up

Government response to COVID in the form of business shutdowns resulted in massive job losses, then as governments opened the economy up again, job gains were incredible. The Hill had an article discussing the whipsaw in jobs entitled “Biden is delivering the fastest economic recovery in history. Why hasn’t anyone noticed?”

Well, the US have gone from “fastest economic recovery in history” to real GDP growth of less than 1% (Atlanta Fed GDPNow for Q1). In addition, the flexible price CPI less food and energy is a whopping 20%.

You can see “The Biden Miracle!” in the following chart. Hires (red line) dropped with Covid shutdowns, then spiked when governments opened economies again. Throw in the trillions of Federal government Covid stimulus and trillions in Fed monetary support, the Biden Miracle sees less like a miracle and more like an extremely expensive way to add jobs. But the interesting problem facing the Administration is the massive spike in job openings relative to hires (again, governments opening-up plus Federal Stimulypto).

Now for a real downer of a chart. Inflation is so toxic that REAL average hourly earnings YoY is down -2.72%. Hardly the best economic growth in history.

Now we have Jerome Powell and The Blackhearts threatening quantitative tightening starting in May. Here is The Fed’s theme song “We love printing money.”

But The Fed is already slowing the growth of monetary base, although this Fed Stimulypto is still growing much faster than pre-Covid.

At least the 10Y-2Y Treasury curve is back above 0 bps as the Atlanta Fed’s GDPNow Q1 forecast falls to under 1%.

Remember, The Fed is planning on shrinking the balance sheet by $95 billion. The Fed’s balance sheet is just shy of $9 trillion. Which is around 1% per month.

With rising expectations of Fed quantitative tightening (QT), residential mortgage rates keep climbing.

Despite a slowing economy teetering on recession and a war raging in Europe, The Fed is tightening monetary policy. Allegedly to fight red-hot inflation.

Alarm! Treasury 10Y Term Premium Remains Deeply Negative As Fed Plans Its Attack On Mortgage Rates And Treasury Yields (3M TBill/OIS Spread Crashes As 30Y Mortgage Rate Is -3%) Venezuela 2Y Yield At … 436.77%

Alarm!

The 10-year Treasury term premium, the amount by which the yield on a long-term bond is greater than the yield on shorter-term bonds, remains steeply negative (white line) as The Federal Reserve steps up its attack (aka, monetary tightening). Meanwhile, the 10Y-2Y curve actually rose into positive territory.

Historically, the 10-year Treasury Term Premium declines before a recession.

Meanwhile, 3 month Treasury bill to Overnight Indexed Swaps spread is crashing to the lowest level since 2017.

But with inflation raging at the fastest pace in 40 years, the REAL 10-year Treasury yield remains negative at -5.236% while the REAL 30-year mortgage rate is -3.01%. Both were in positive territory when Biden was installed as President.

Speaking of interest rates, the infamous PIGS (Portugal, Italy, Greece, Spain) are all seeing surges in their 10-year sovereign yields. Sweden, while not a PIG has the largest spike today at 13.8 BPS.

Actually, the biggest spike in sovereign yields occurred in Ukraine where their 2-year yield popped +205.8 BPS. But Lebanon has the highest 2-year yield at 162.29%. Turkey is in third place in the sovereign demolition derby at 23.52%. Sadly, Poland’s 2-year yield is up 16 bps today.

But the winner of the sovereign debt demolition derby is …. drumroll … VENEZUELA! At 436.77%.

I am really surprised that Biden hasn’t adopted Maduro’s fashion sense.

When Fed Gov Brainard Talks, Markets Listen! Brainard Says Fed Will Shrink The Balance Sheet At A Rapid Rate (10Y Treasury Yield Rises 16 BPS As Nasdaq Falls 300 PTS) Mortgage Rates Will SOAR!!

When Federal Reserve Governor Lael Brainard speaks, markets listen

Federal Reserve Governor Lael Brainard said the U.S. central bank will continue to tighten policy methodically and shrink its balance sheet at a rapid pace as soon as May. 

Brainard’s hawkish remarks sent bond prices crashing and 10Y bond yields up over 16 bps.

While Bankrate’s 30Y mortgage rate is down slightly today, the surge in the 10Y and 2Y Treasury yields could push mortgage rates above 5% by tomorrow,

Even Europe is feeling Brainard’s wrath. Italian 10Y sovereign yields are up almost 20 bps.

The NASDAQ index is down 300 points on Brainard’s utterance.

Gee thanks Lael from all us wanting to finance the purchase of a house.

Brainless and Brainard.