Joe Biden could barely eat his dinner at the White House Correspondents’ Dinner. And we think he is calling the shots in The White House?? Oh well. Perhaps it is Treasury Secretary Janet Yellen or Klaus Schwab of the World Economic Forum.
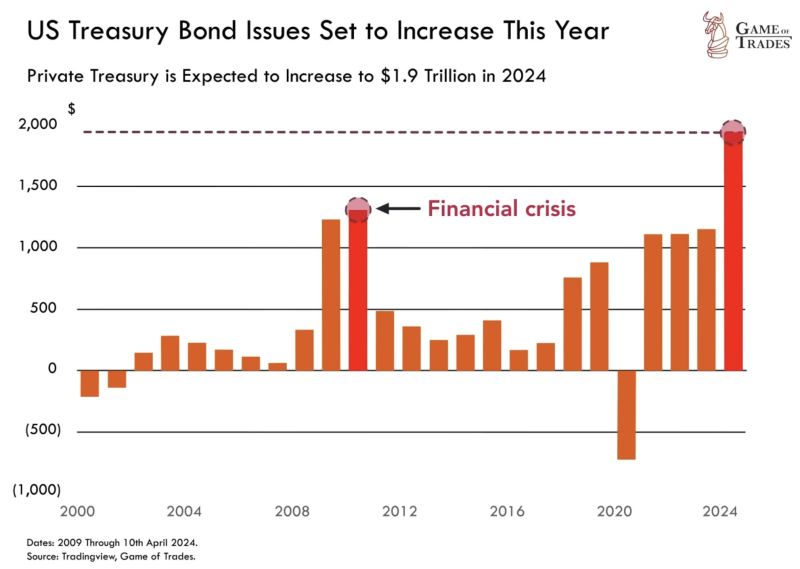
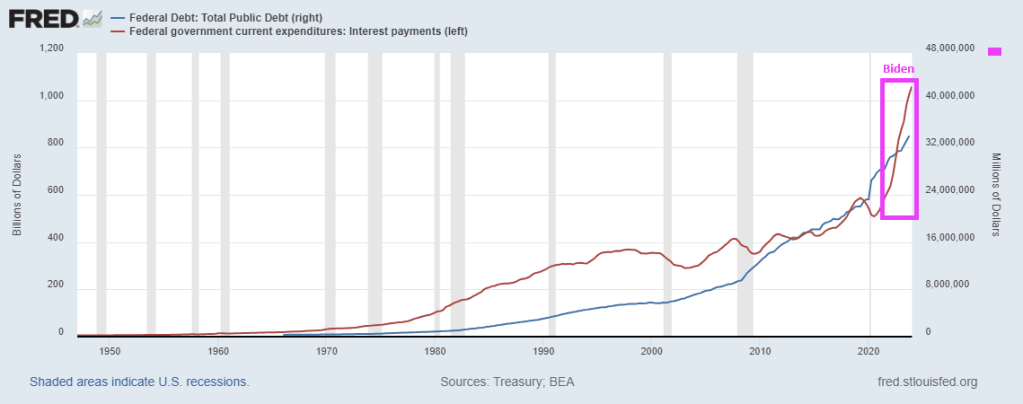
In any case, Treasury bond issuance in 2024 is expected to hit $1.9 TRILLION. Surpassing levels seen even during the 2008 financial crisis.
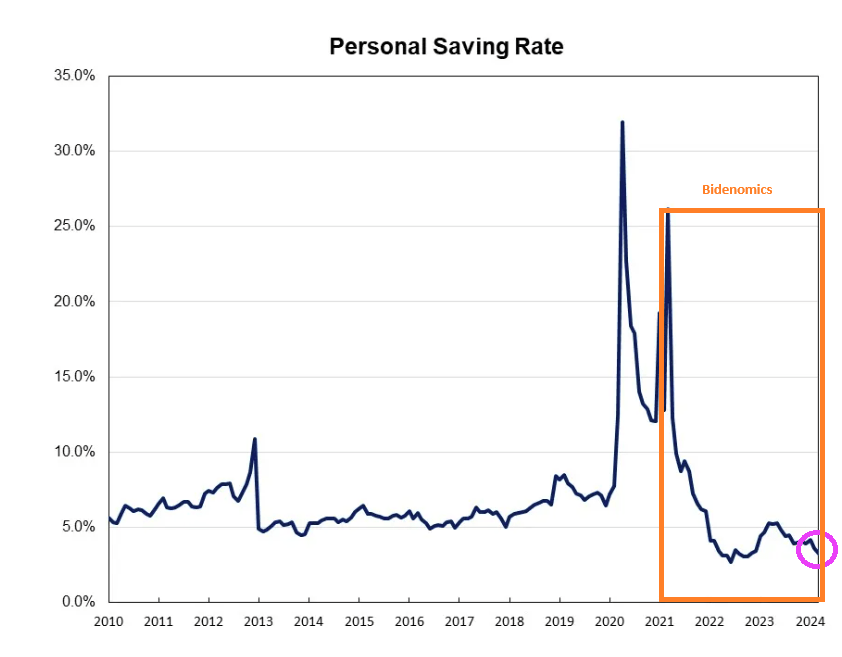
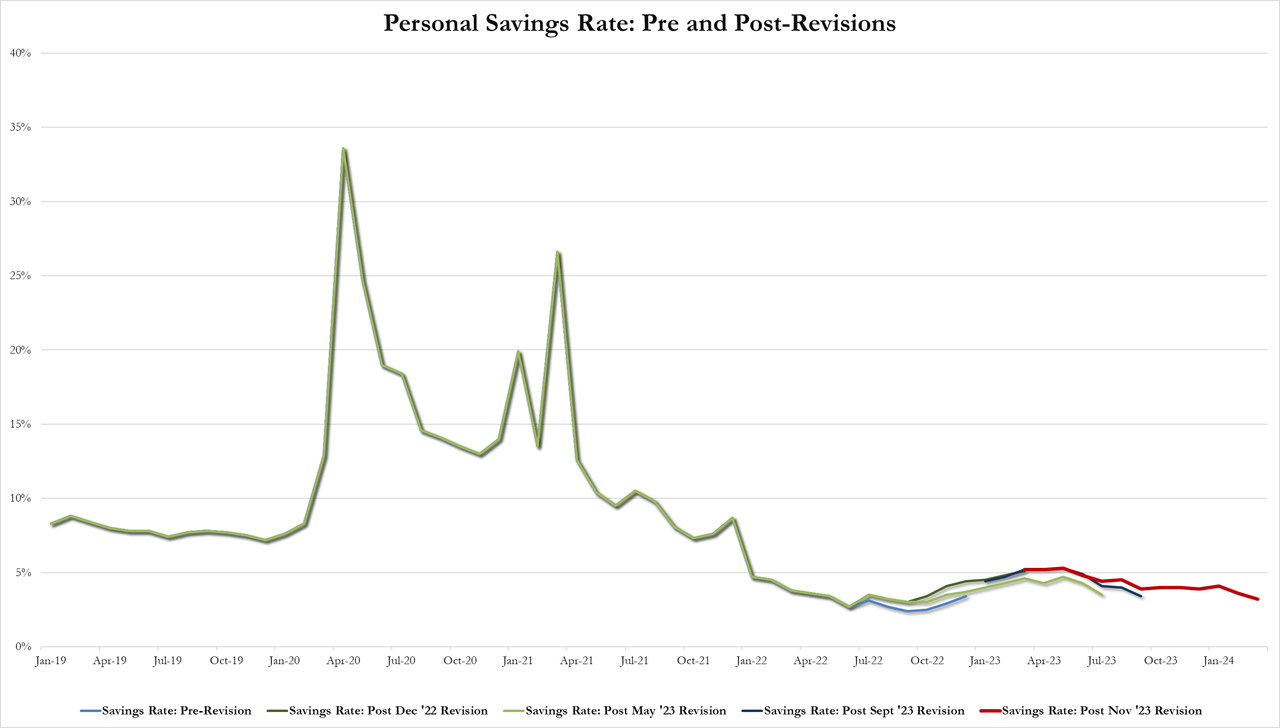
And with inflation, the US personal saving rate is near the lowest level since Obama (2010).
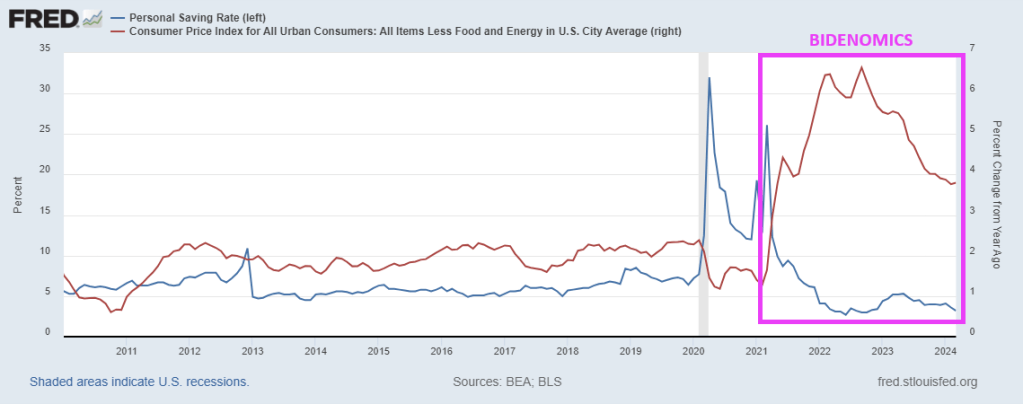
And with the core inflation rate still higher than anytime since 2010, households are paying more for … everything depleting their savings.
With Biden and Congress spending like drunken sailors on shore leave, and no end in sight, this will eventually explode. Ukraine, foreign aid, no border security, virtually no money for Maui fire, E. Palestine Ohio is still a wreck, etc. They always have money for someone else. And if Trump is elected in November, watch CNN and MSNBC and Biden/Congress blame Trump.
Commodities are a way to protect yourself against the government and their insane spending and debt.
My point? Gold keeps rising!
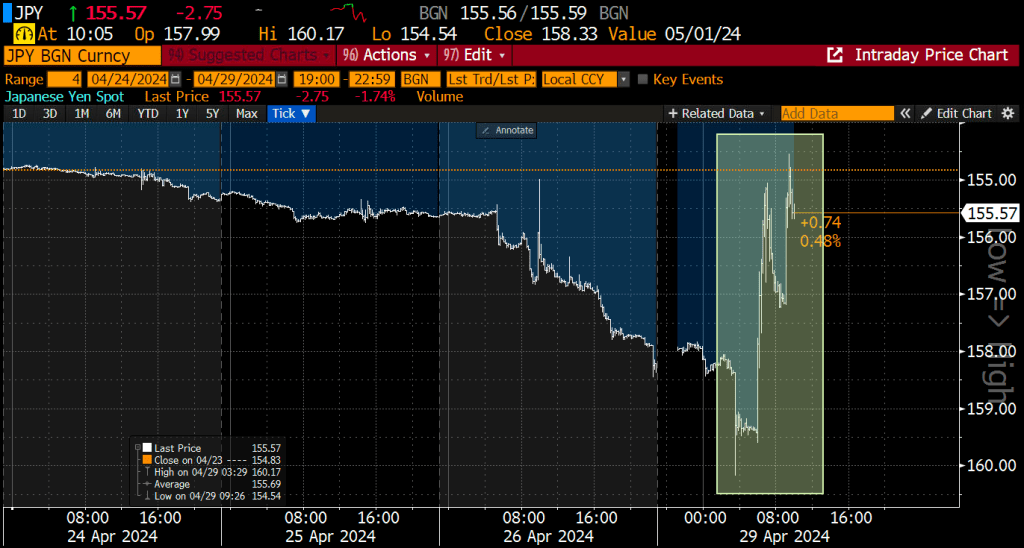
The leading foreign holder of US debt is Japan, which is following the insane path as the US and resembles a banana republic.
Former Fed chair under Obama and current Treasury Secretary Janet Yellen under Biden is Doctor Wonderful. NOT!!
I don’t know what Biden thinks is so funny. Maybe it is because House “Majority” Leader Mike Johnson (RINO-LA) gave Biden and Schumer everything they wanted (Ukraine, Israel funding but nada for security our borders). Life is good when you are stupid and mean-spiritied like Joe Biden!
Biden is so vain: capped teeth, hair plugs, constant tan, face lifts, etc.
Then the numbers spiraled out of control. Yet Biden/Congress keep shoveling money to Ukraine and leave our borders unsecured.
Washington’s fiscal situation has drastically changed since then; total debt has surpassed $34 trillion, the annual budget shortfall exceeds $1 trillion, and interest costs have topped $1 trillion.
David Walker, the former comptroller general of the United States and a Main Street Economics advisory board member, is unsurprised.
Seventeen years ago, Mr. Walker rang fiscal alarm bells. Like Ross Perot before him, he took his case to the American people and delivered the cold, hard truth: The government’s books are unsustainable, and interest charges on the mounting debt will swallow a significant portion of federal revenues.
During this time, the former head of the Government Accountability Office (GAO) appeared on a widely viewed episode of “60 Minutes,” toured the country to spotlight worrisome trends in the U.S. government’s budget (he did this again in 2012), and attempted to convince lawmakers of the unsustainable fiscal path.
He also penned a 2009 book titled “Comeback America: Turning the Country Around and Restoring Fiscal Responsibility.”
Given the treasure trove of budgetary numbers coming out of the nation’s capital almost daily, such as nearly half of income tax revenues being dedicated to interest payments, Mr. Walker’s warnings have not been heeded nearly two decades later.
According to the Congressional Budget Office’s long-term outlooks, the national debt will eye $50 trillion by 2034, fueled by around $17 trillion in cumulative deficits. As a percentage of GDP, debt held by the public and the deficit will reach 166 percent and 8.5 percent by 2054, respectively, the CBO forecasts.
“Washington has become addicted to spending, deficits, and debt, and they’re charging the credit card and planning to send the bill to younger and future generations of Americans,” Mr. Walker told The Epoch Times.
“That’s irresponsible. It’s unethical, and it’s immoral, and it needs to stop.”
Is the United States past the point of no return?
“Only God knows when the tipping point is going to occur, and God’s not telling us,” he said.
He combs through various metrics to gauge the situation.
One of these is the debt-to-GDP ratio, which is presently at about 122 percent. Outside of the coronavirus pandemic, this is a record high.
Mandatory spending as a percentage of the federal budget is another metric. It currently stands at around 73 percent.
Another one is interest as a percentage of the budget, which is close to 15 percent.
For Mr. Walker, it is not only raw numbers but what the trends are displaying, which requires a deep dive into demographics.
“We have an aging society with longer lifespans, relatively fewer workers, supporting more retirees, and a skills gap,” he noted.
Last year, two notable developments happened: a majority of Baby Boomers were at least 65, and the birth rate tumbled to the lowest in a century.
This will metastasize into a costly burden for the federal government, particularly Social Security.
The Peter G. Peterson Foundation estimates that the current worker-to-beneficiary ratio is 2.8-to-1, down from 5.1-to-1 in 1960. By 2035, the Social Security Administration projects the ratio will further slide to 2.3-to-1.
Republicans and Democrats
President Joe Biden has claimed that he has acted fiscally responsibly, telling a crowd at a North America’s Building Trades Unions event on April 24 that he cut the national debt. (Insert a TV laugh track here). President Biden has repeatedly touted this claim over the last 18 months, although he has added close to $7 trillion to the national debt since taking office in 2021.
While Republicans have griped over the current administration’s spending endeavors, experts assert that the GOP has also contributed trillions of dollars to the debt pile. One of the GOP-led expansionist initiatives was Medicare Part D under former President George W. Bush.
This program, which was designed to utilize private health care plans to offer drug coverage to Medicare beneficiaries, added $8 trillion in new unfunded obligations. Mr. Walker accepted that “the politicians were totally out of touch with fiscal reality,” considering that Medicare was already underfunded by $19 trillion.
Put simply, both parties have been fiscally irresponsible, and now the bills are coming due.
Mr. Walker purported that politicians suffer from myopia as they are too focused on the next election and, as a result, fearful of making tough decisions. They also experience tunnel vision, he says, meaning they only concentrate on one issue at a time “without understanding the interdependency” and “the collateral effect.”
Self-interest is another malady infecting both sides of the aisle as they aim to keep their jobs and ensure their party stays in power.
“We’ve lost our sense of stewardship,” he said.
“Stewardship is not just generating results today, not just leaving things better off when you leave them when you came, but better positioned for the future,” Mr. Walker explained. “We’ve lost that sense. We need to regain it if we want our future to be better than our past.”
He identified Rep. Jody Arrington (R-Texas), who chairs the House Budget Committee, as one of the few lawmakers to realize the fiscal issues by committing to the Fiscal Commission Act and supporting a constitutional amendment that would limit government growth and stabilize the debt-to-GDP ratio.
“There are others, but there’s not enough,” Mr. Walker said.
Earlier this year, the House Budget Committee advanced the Fiscal Commission Act of 2024 out of committee with bipartisan support.
The bill would establish a 16-member panel featuring six Republicans, six Democrats, and four outside experts without voting power. The group would explore strategies to balance the budget as soon as possible and assess mechanisms to enhance the long-term solvency of various entitlement programs, especially Social Security and Medicare.
Despite some consternation from several Democrats, the bipartisan push received applause, including from the Committee for a Responsible Federal Budget.
“The federal debt is on an unsustainable course, and lawmakers have been unable or unwilling to correct it,” the organization stated. “A fiscal commission would bring Members of both parties and chambers together to facilitate a conversation over how to solve these problems, without pre-prescribing any particular solution (or a solution at all).”
Hope and Change
Whether the United States can improve its fiscal trajectories remains to be seen.
Mr. Walker is hopeful about some of the legislative efforts coming out of the nation’s capital. The country is beginning to face the consequences of years of fiscal mismanagement, making it harder to sell its debt to the rest of the world.
In recent months, many Treasury auctions have led to lackluster demand among domestic and foreign investors. Market watchers have warned that global financial markets might share Fitch and Moody’s concerns about America’s fiscal deterioration.
But when discussing trillions of dollars, percentages, GDP, and servicing costs, how can the average person, worried about paying his mortgage or replacing a broken-down refrigerator, grasp or even be concerned with these trends?
According to Mr. Walker, you tap into their “head and heart.”
“You have to help them understand that we’re already seeing some of the implications of fiscal irresponsibility,” he said, adding that the causes of the Roman Empire’s demise are familiar to what is transpiring in the United States today: fiscal irresponsibility, a decline in moral values, an overextended military, and an inability to control its borders.
However, while it is vital to translate these gigantic numbers into terms the layman can understand, experts also need to “hit their heart.”
“Do they love their country? Do they love their kids, and do they love their grandkids?” he said. “We’re mortgaging their future at record rates.”
Ever worse, politicians have promised $215 TRILLION in unfunded entitlements to the bottom 99%. When this all explodes, who will be left standing to make good on these promises??
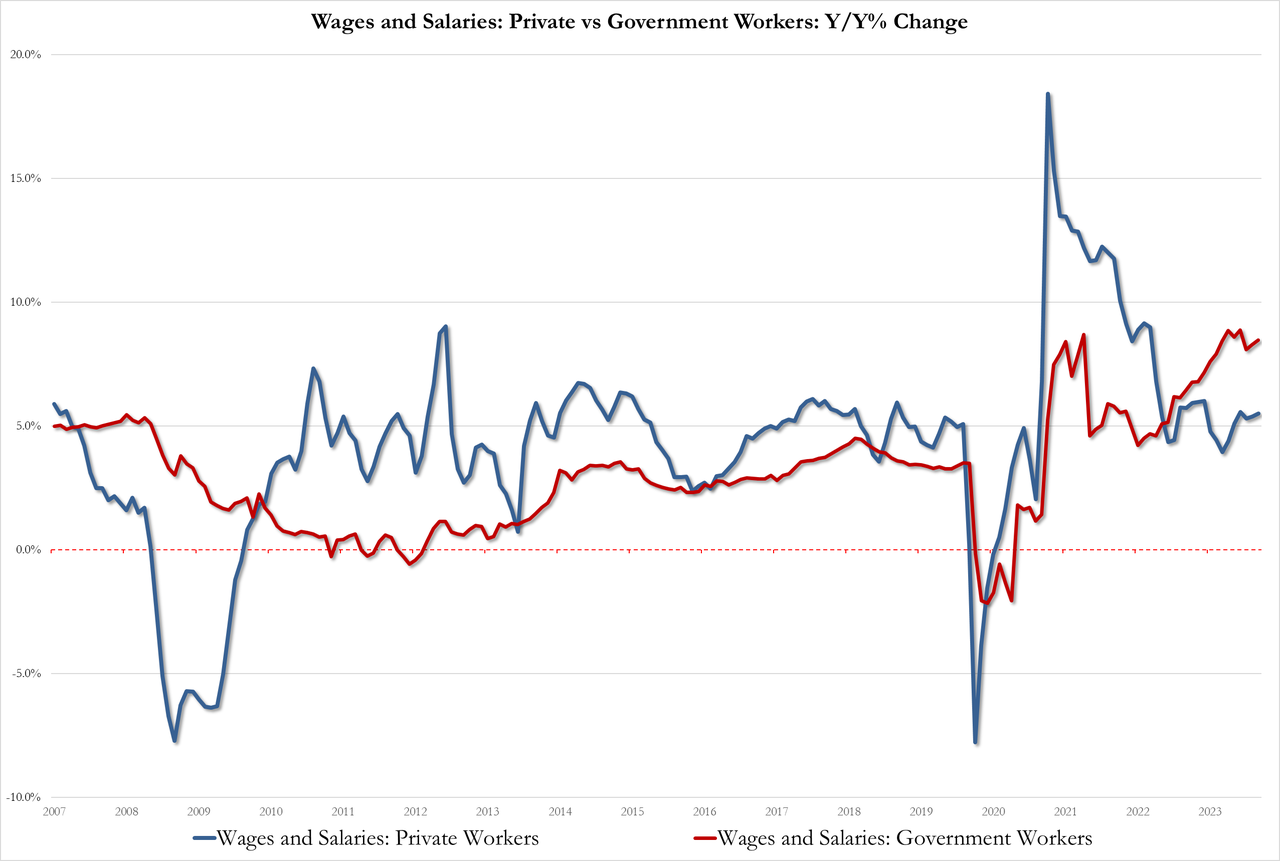
Today’s economic news highlights “Government Power.” Unproductive government jobs saw wages rise 8.5% YoY while productive private sector jobs saw wages rise by only 5.5% YoY. This is Bidenomics!!!
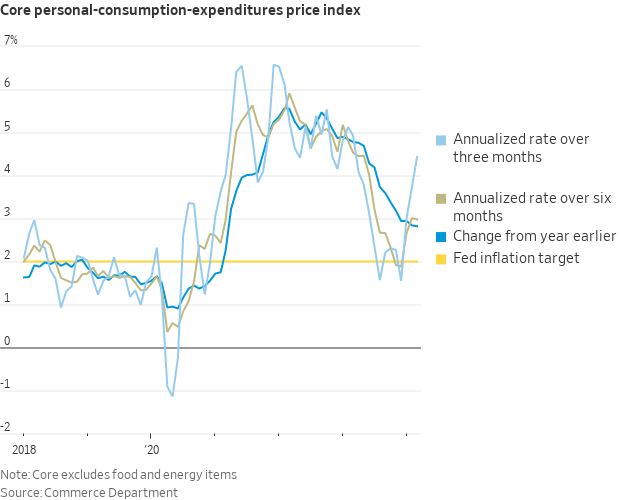
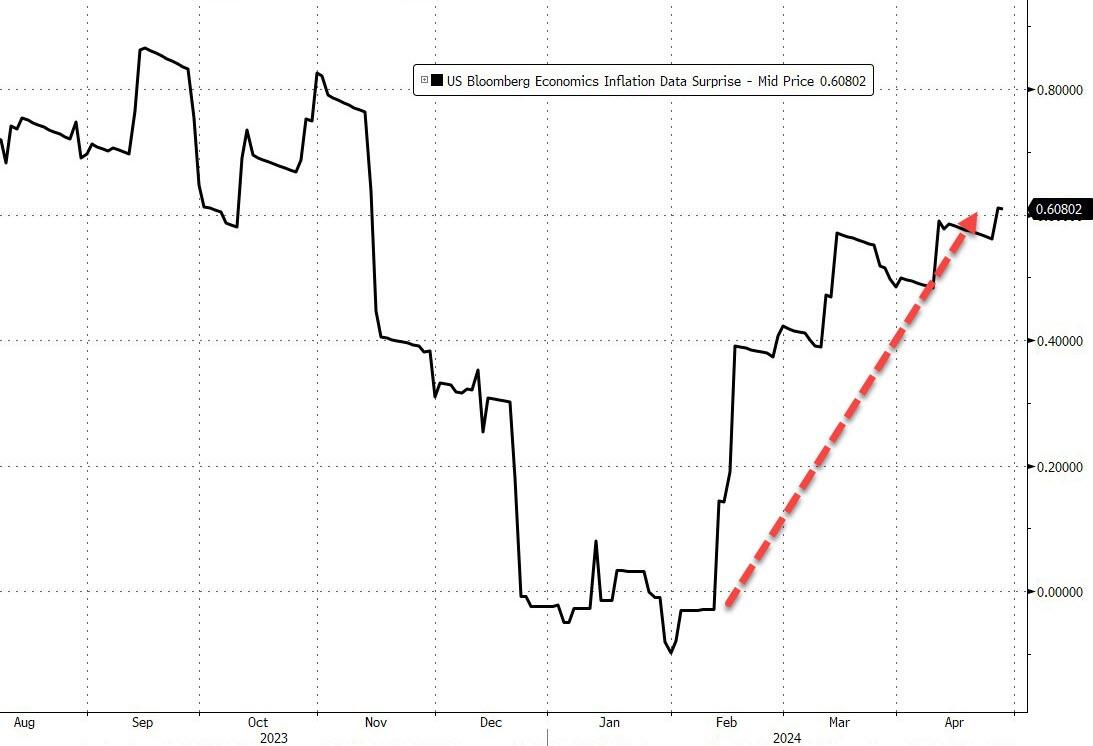
…the doves’ last chance for sooner than later rate-cuts is today’s Core PCE Deflator – often described as The Fed’s favorite inflation signal. Last month saw an uptick in the headline deflator and following yesterday’s core PCE rise for Q1, all eyes are on the March data released this morning.
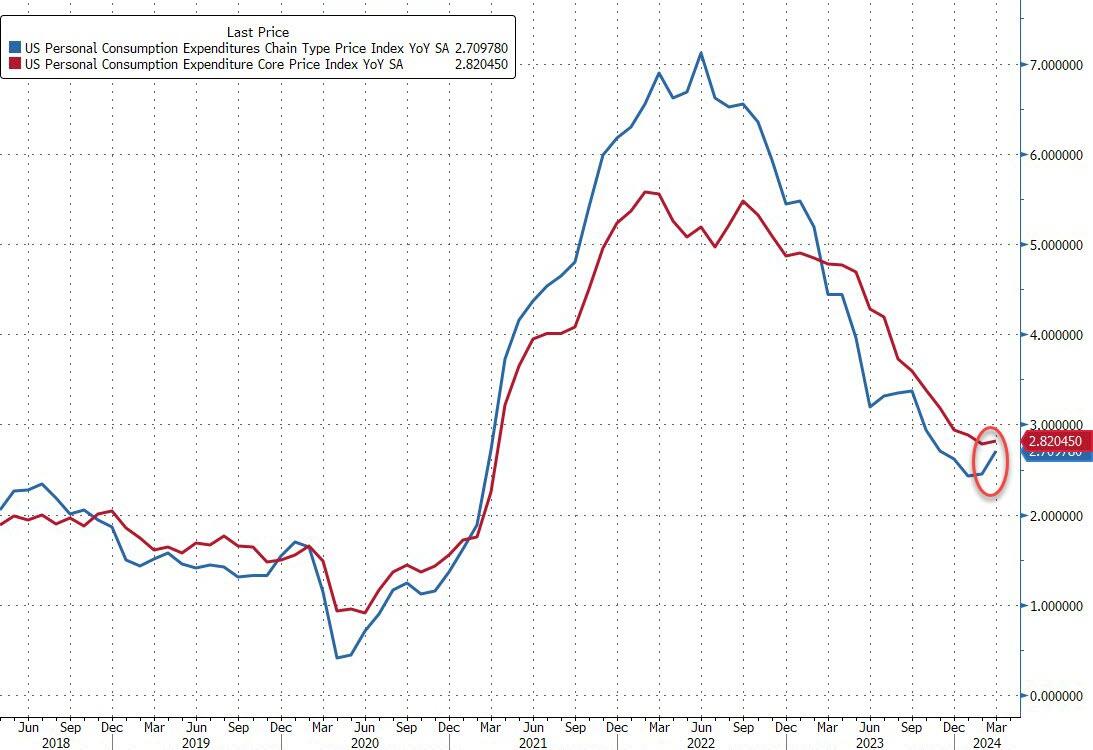
However, both the headline and core PCE Deflator data printed hotter than expected (+2.7% vs +2.6% exp vs +2.5% prior and +2.8% vs +2.7% exp vs +2.8% prior respectively)…
Source: Bloomberg
The silver lining is that this hot PCE print is ‘dovish’ relative to the GDP-based data we saw yesterday, with whisper numbers of +0.4 to +0.5% MoM (vs the +0.3% print).
But still – it’s not good for the doves.
As WSJ Fed Whisperer Nick Timiraos notes, the 3-Month annualized core PCE jumped to 4.4%…
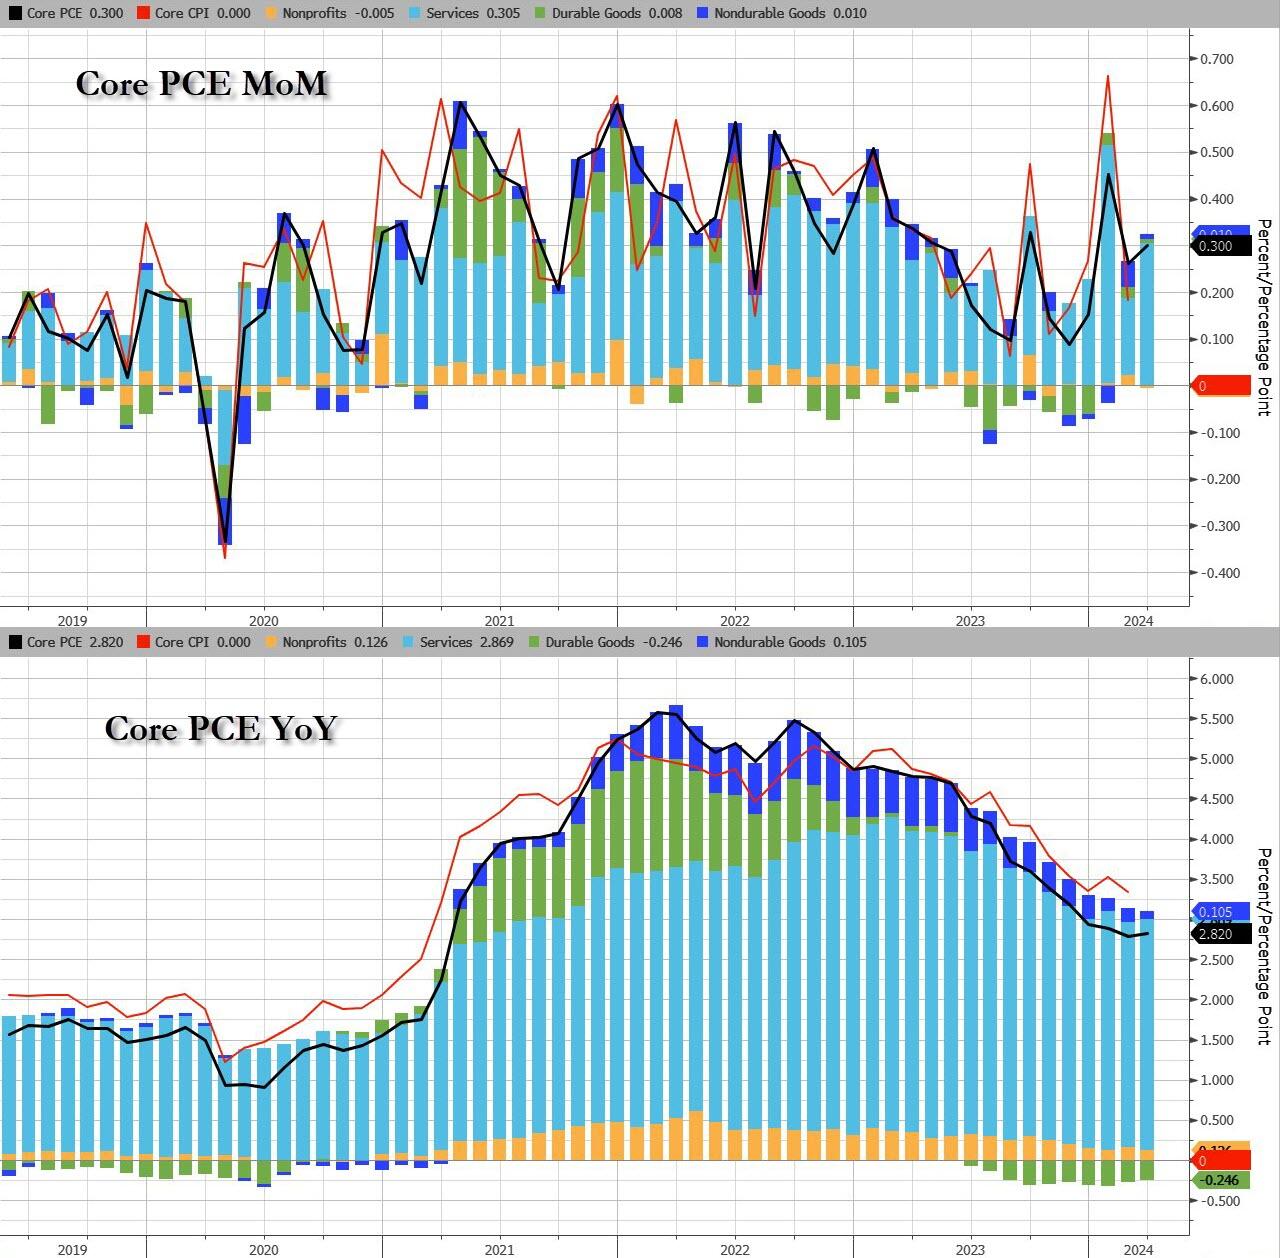
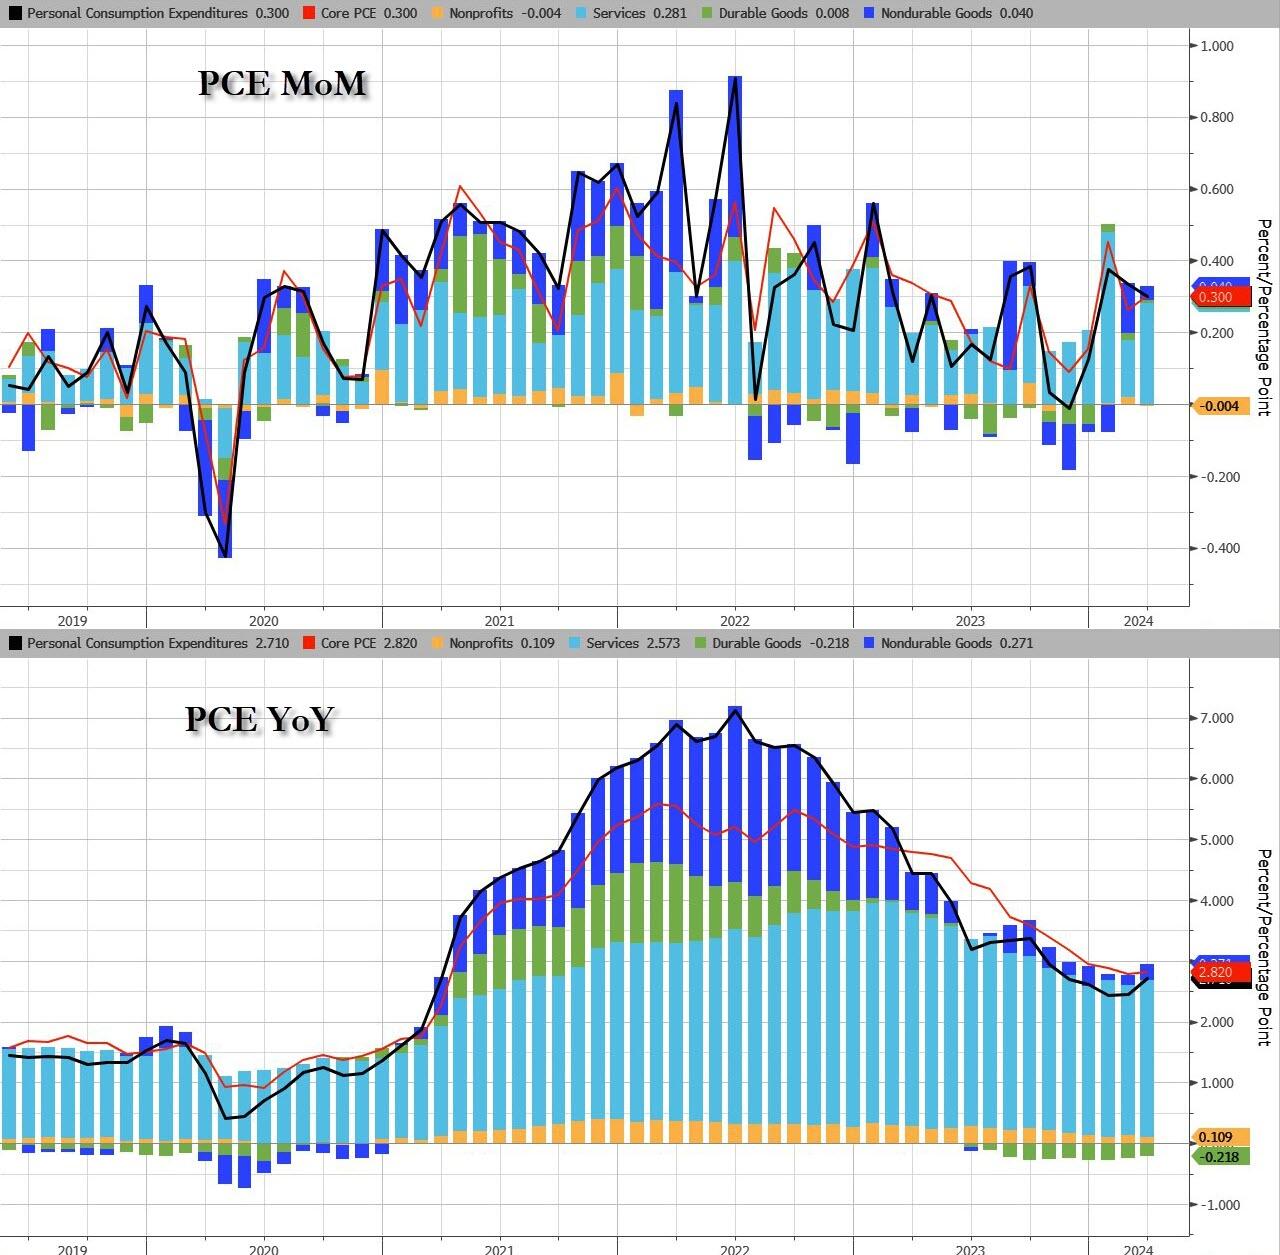
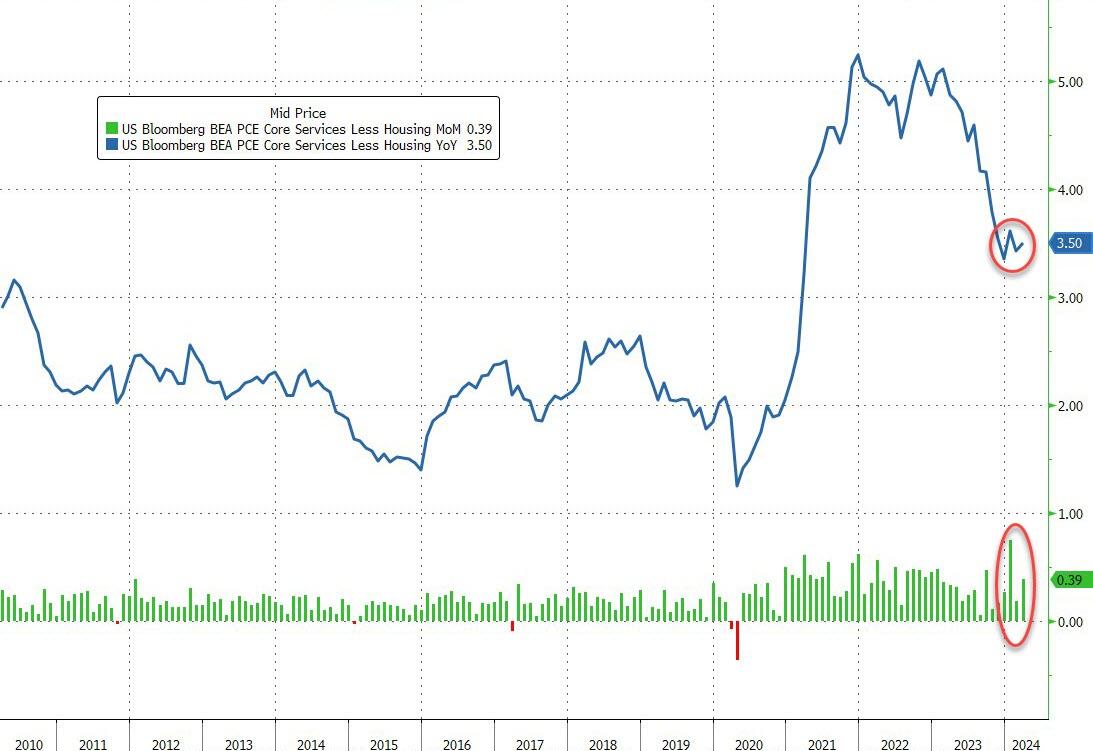
The Service sector led the MoM and YoY acceleration in headline PCE…
Source: Bloomberg
And for Core PCE, it was Services prices too that drove the acceleration…
Source: Bloomberg
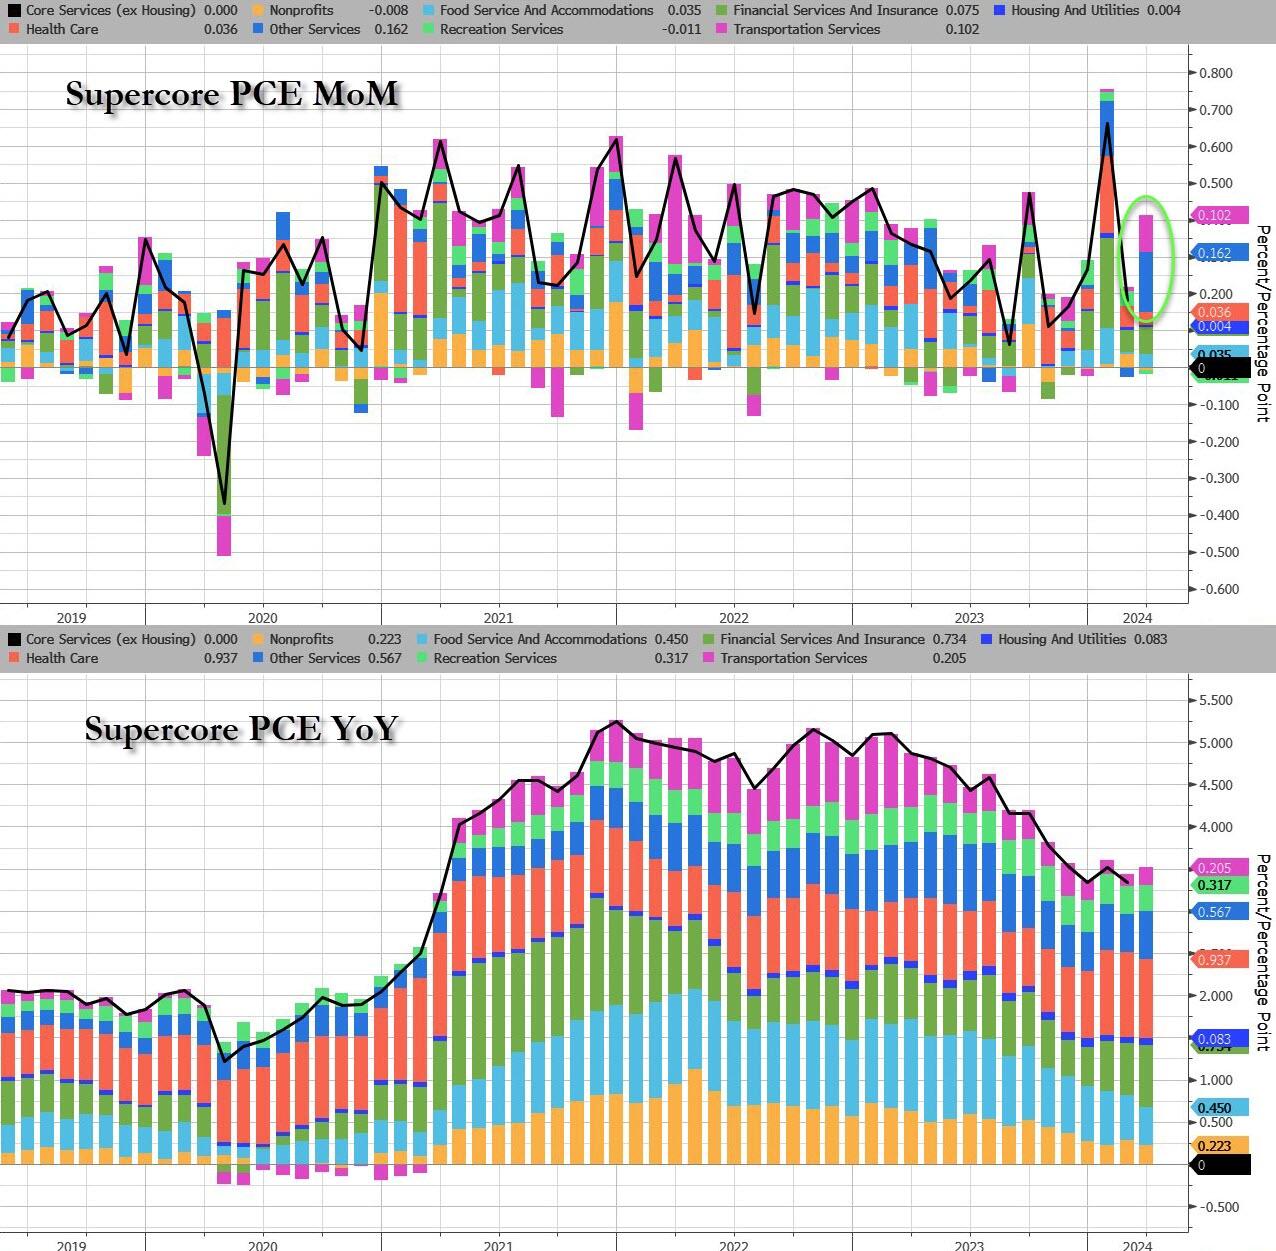
The so-called SuperCore – Services inflation ex-Shelter – rose once again, and was revised higher…
Source: Bloomberg
Stripping it back even further, Transportation Services and ‘Other Services’ were the biggest gainers in SuperCore…
Source: Bloomberg
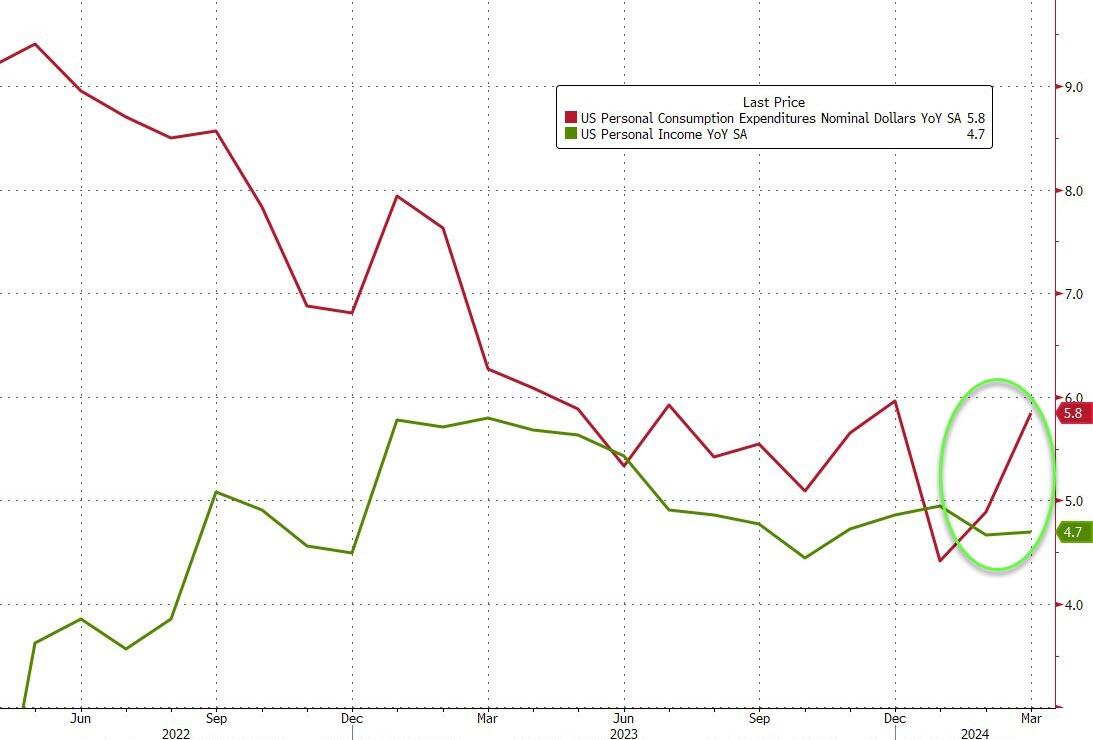
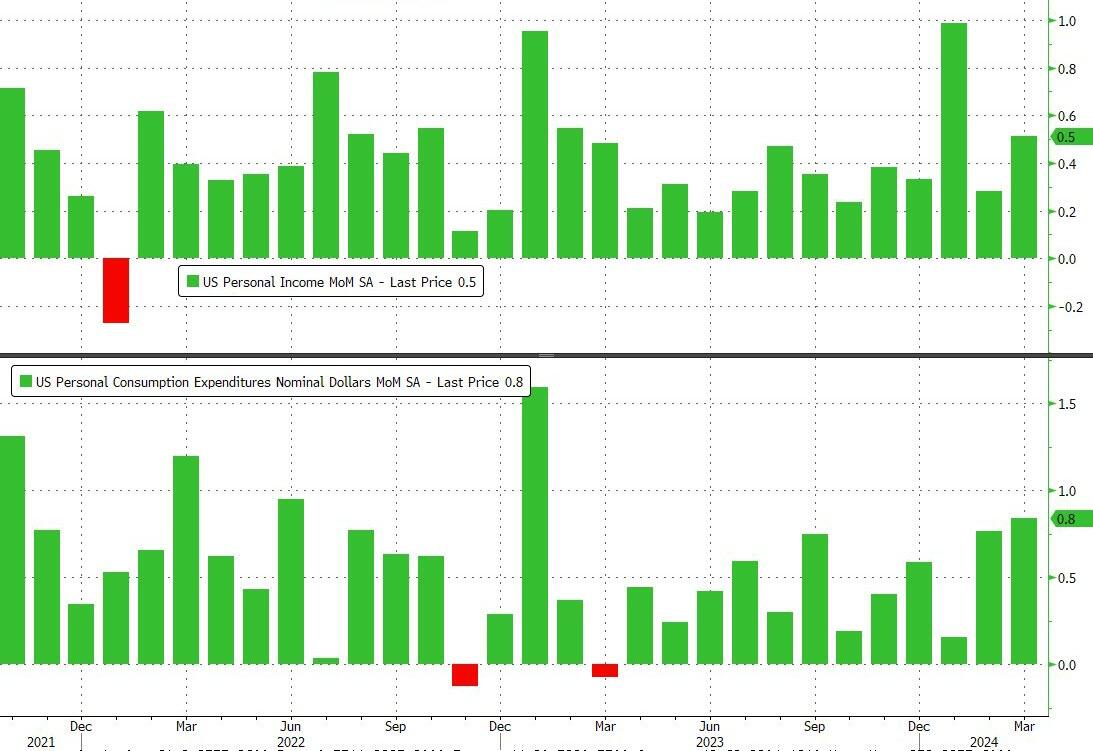
Income and Spending both rose again on a MoM basis with spending outpacing income (again). The 0.8% MoM rise in spending was the highest since Jan 2023…
Source: Bloomberg
Spending is accelerating fast relative to incomes (on a YoY basis) – and remember this is all nominal…
Source: Bloomberg
On the income side, government and private wage growth accelerated:
Govt wages rose to 8.5% YoY, from 8.3%, the highest Dec 22
Private wages rose to 5.5% YoY, from 5.4%, highest since Dec 22 as well
Source: Bloomberg
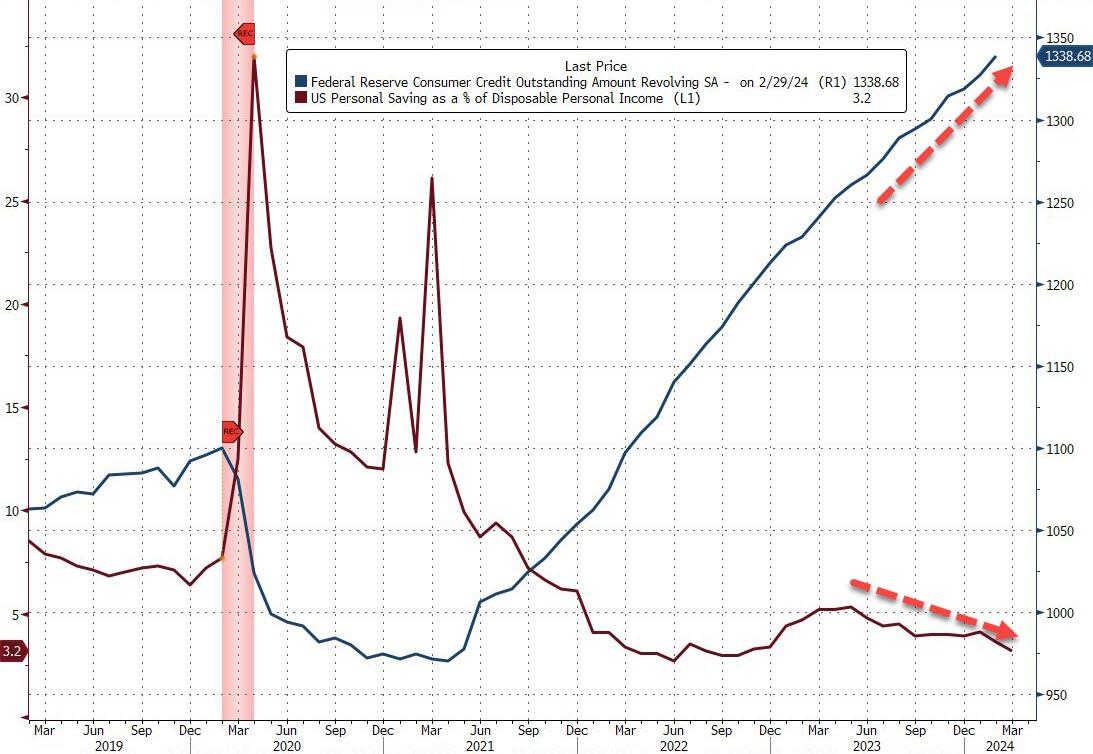
Which meant the personal savings rate plunged to 3.2% from 3.6% – its lowest since Nov 2022…
And the soaring credit card balance explains how people are getting by…
Source: Bloomberg
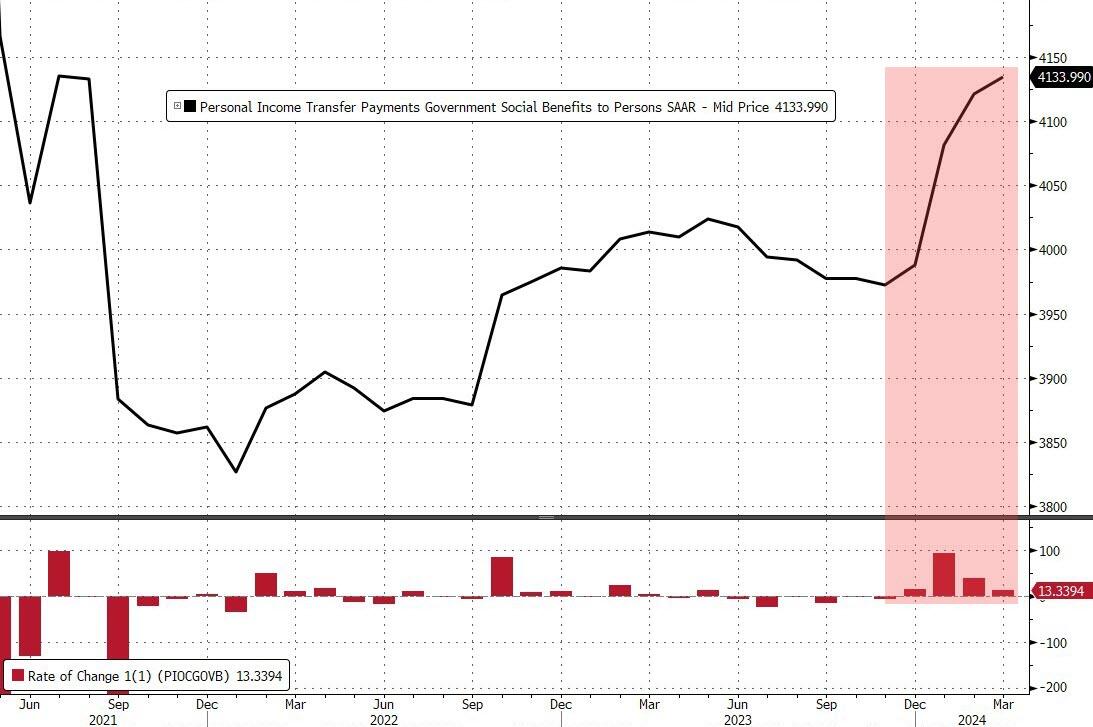
And all this amid the fourth straight month of government handouts…
Source: Bloomberg
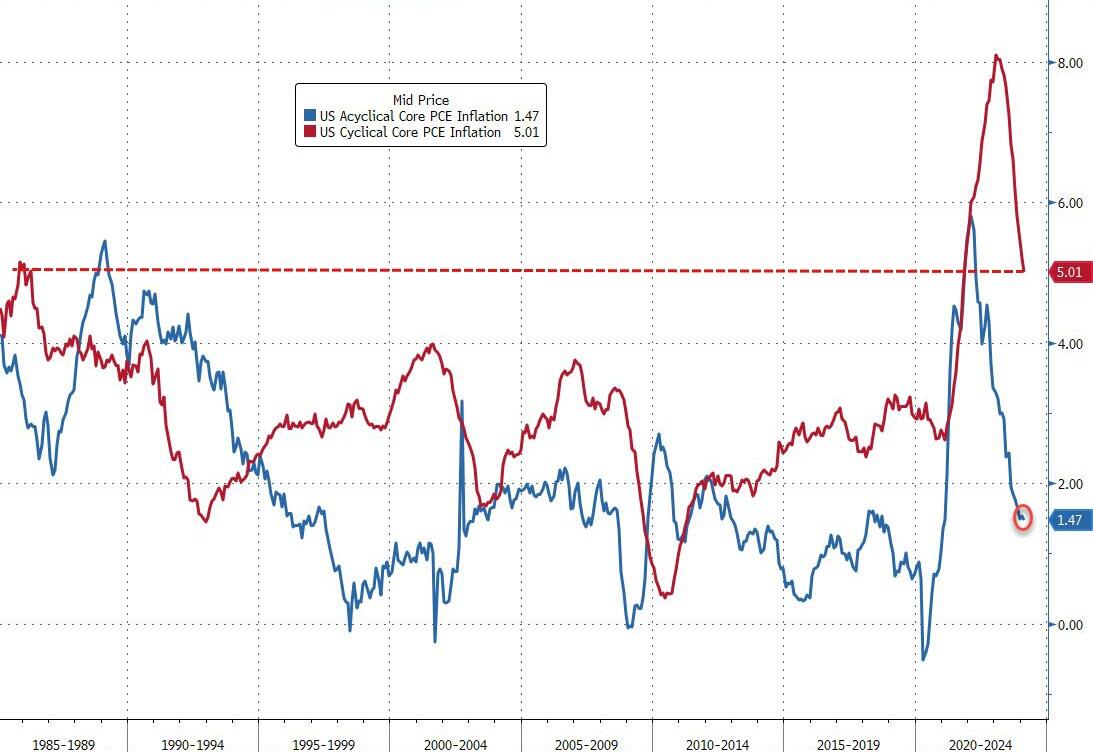
Finally, while the markets are exuberant at the survey-based disinflation, we do note that it’s not all sunshine and unicorns. The vast majority of the reduction in inflation has been ‘cyclical’…
Source: Bloomberg
Acyclical Core PCE inflation remains extremely high, although it has fallen from its highs.
Is The (apolitical) Fed going to be able to cut at all this year like Joe Biden said they would?
The Green Slime! The global movement towards Green Energy (or global Marxist movement) is really The Green Slime! Or maybe it should be renamed “The Red Slime.”
And then we have Hertz dumping its inventory of EVs. A slew of used Teslas have hit the Hertz car sales website after the company announced Thursday it planned to sell off 10,000 more electric vehicles from its fleet than originally planned, bringing the fire sale’s total to 30,000. Perhaps one of the reasons you can get such a good deal on a Tesla at Hertz right now is that the outlook for EV value retention is pretty grim at the moment.
Given the incidents of electric cars catching fire, perhaps saying its a fire sales is a bad choice of words. But what it says is that DESPITE massive incentives to buy EVs, consumer demand stinks. Although Transportation Secretary Pete Buttigieg will claim the market is booming.
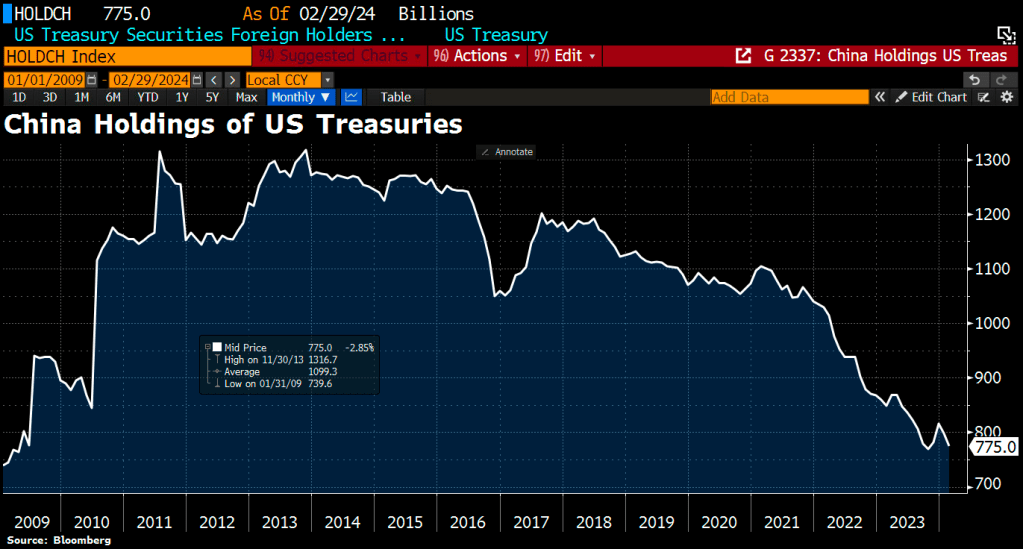
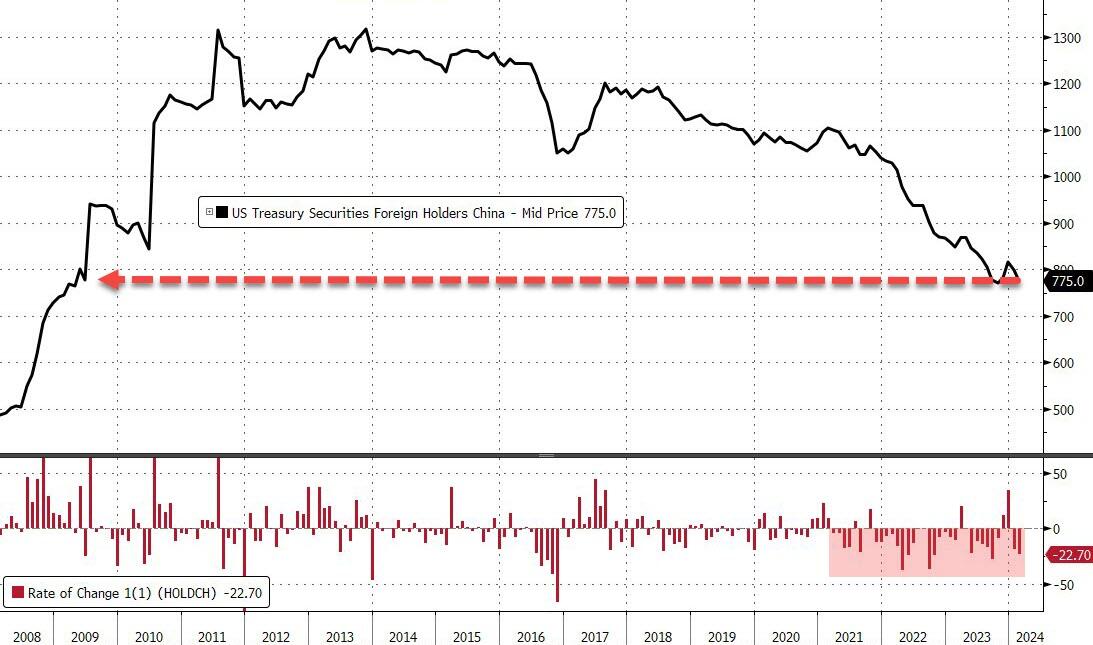
How bad is the trainwreck that is the Biden Regime? China is bailing on US Treasuries.
The Biden Regime is hereafter known as The Green Slime, given their horrible policies. Unfortunately, The Green Slime is here already … and Hertz knows customers don’t want them at least on a temporary basis.
The Federal Reserve is playing the song “Don’t rock the boat” ahead of the Presidential election. Despite the horrible economic news.
1) 4 months of hotter inflation (like today’s stagflationary GDP report)
2) Nearly 1.5 million full-time jobs decline with 1.9 part-time jobs created over a year
3) $2 trillion annual deficits
Leading traders to price in 1 rate cut in December 2024. AFTER THE PRESIDENTIAL ELECTION!
Under Biden, home prices are up 32.5% and conforming 30Y mortgage rates are UP 160%.
One of my colleagues at George Mason University in finance (an economics PhD) constantly quoted Lenin’s famous “You have to break a few eggs to make an omelet.” But why is it always OUR eggs that have to be cracked, never the wealthy elite.
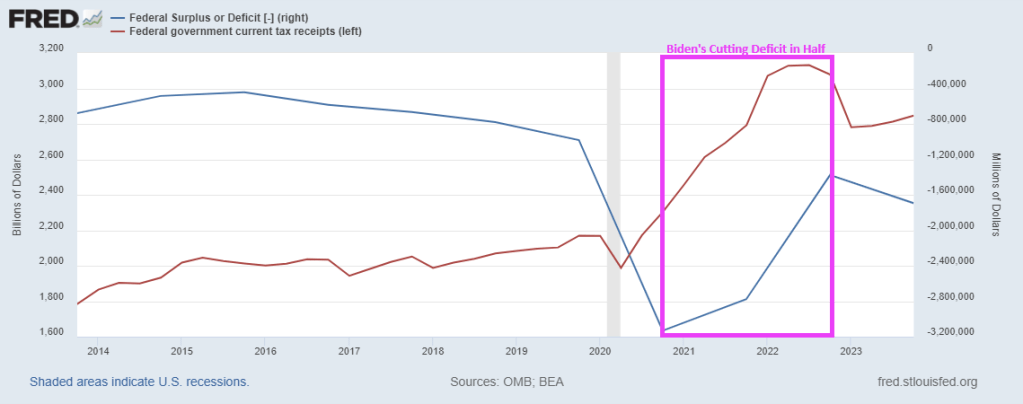
COVID was a gift to Biden. The furious Federal spending of Q2 2020 through Q1 2021 helped keep GDP growth above recession levels.
Ignore Biden’s demented rants/lies about cutting the debt in half. Biden has claimed he cut the $34+ trillion national debt by $7 billion, $1.4 trillion, $1.7 billion, $1.7 trillion, and “in half,” depending on the day he rants. He did no such thing. He is confused and is talking about the BUDGET DEFICIT (don’t look to Snopes to fact check “Trucker Joe”, they really only fact check Trump).
Not surprisingly, the Federal deficit spiked with the Covid lockdowns. But when the economy reopened, the budget deficit shrunk because … the economy was open and Federal tax receipts soared. But we are back to rising deficits again.
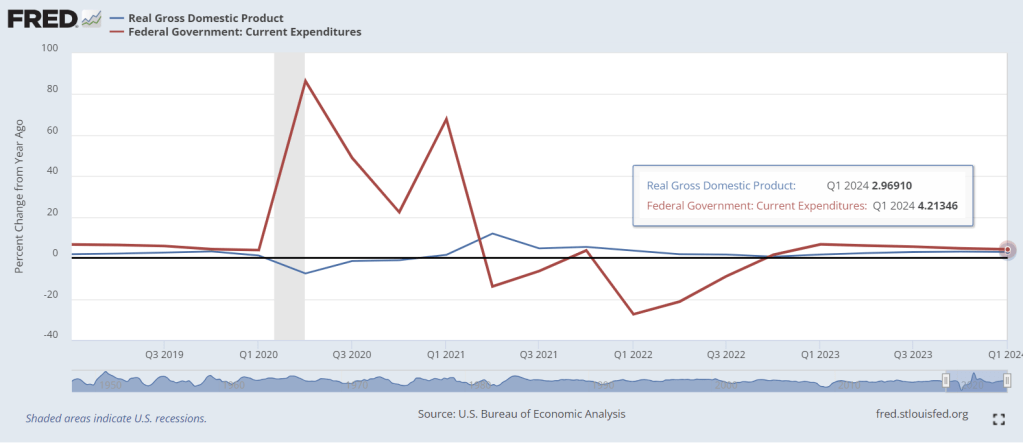
Today, Q1 GDP numbers were released and it looks great. Real GDP year-over-year was 2.97% while Federal government expenditures YoY were 4.21%. But the US is still processing the tidal wave of COVID-related spending out of Washington DC (red line). The YoY growth in Federal spending was 86.4% in Q2 2020, 48.9% in Q3 2020, 22.4% in Q4 2020, and 67.8% in Q1 2021. Like The Titanic trying to avoid the iceberg, it takes a while for massive Federal spending to work itself through the economic system.
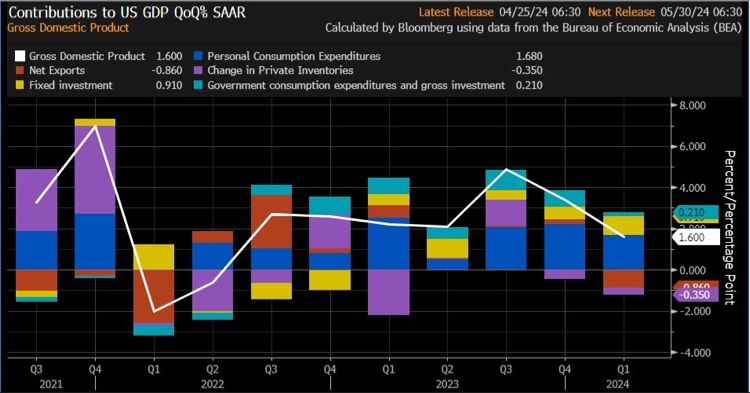
On a QoQ basis, US GDP increased by only 1.60%. Here are the contributions to GDP.
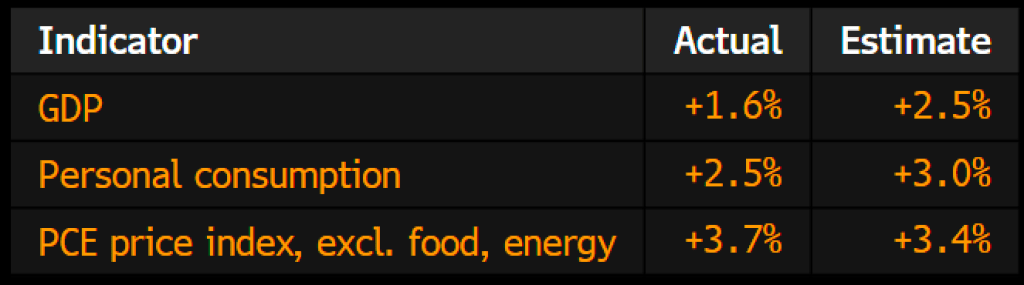
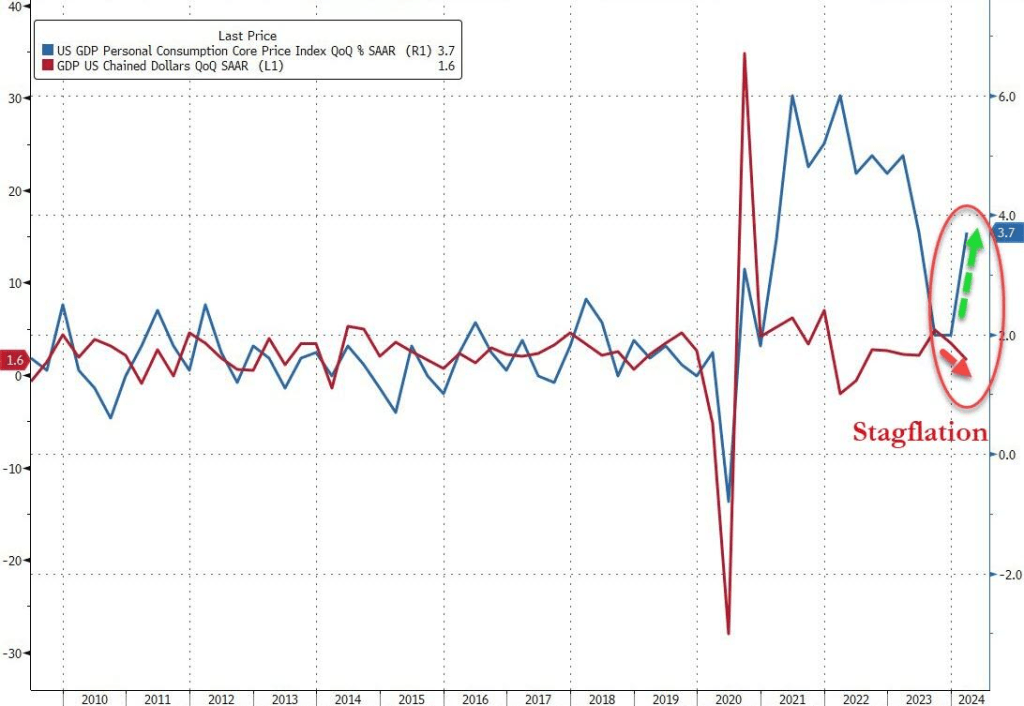
GDP QoQ was up 1.6% while Core PCE Price Index rose 3.7%. Yikes!
Are we entering Stagflation with the worst GDP print in 2 years as prices soar. As COVID stimulus seems to be wearing out.
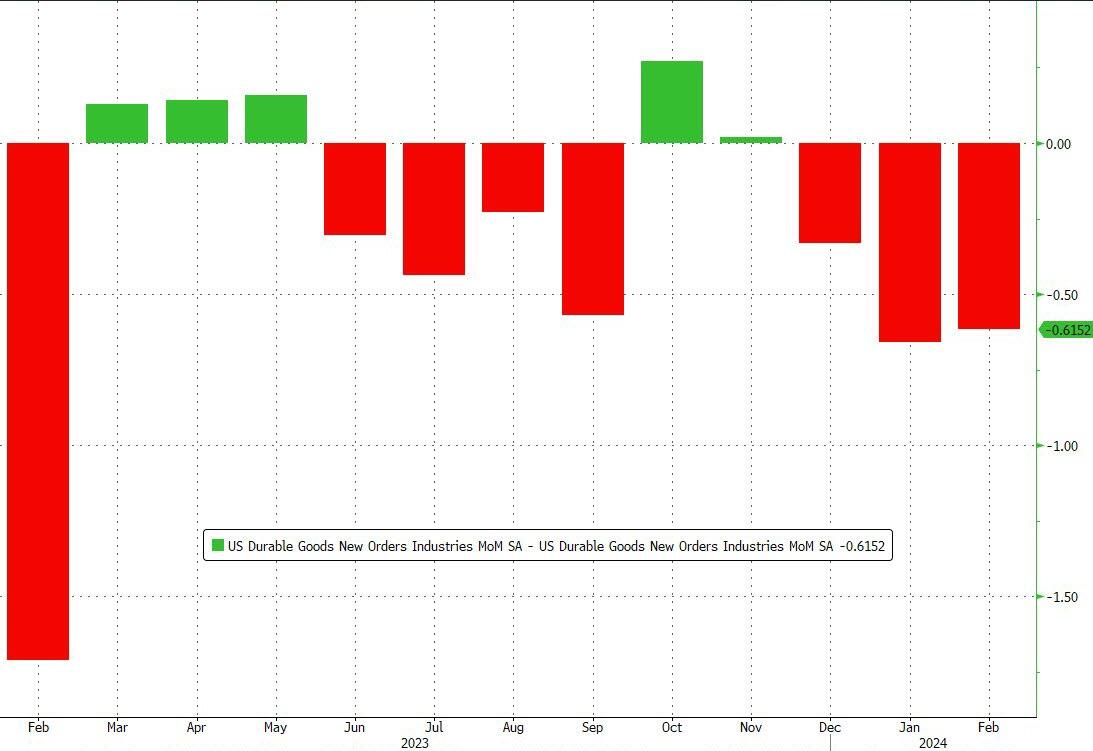
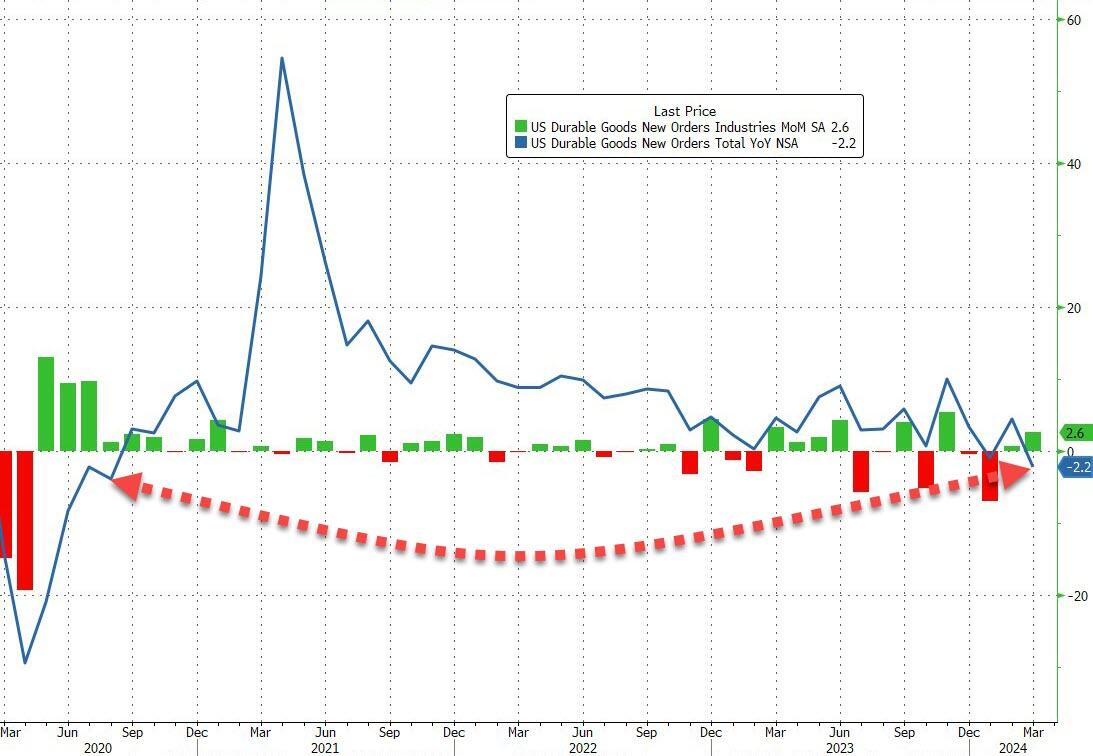
Manufacturer’s Durable Goods New Orders growth peaked in April 2021, thanks in part to M2 Money Growth peaking in February 2021. And its been all downhill since then.
This is the 8th downward revision of durable goods orders in the last year…
Source: Bloomberg
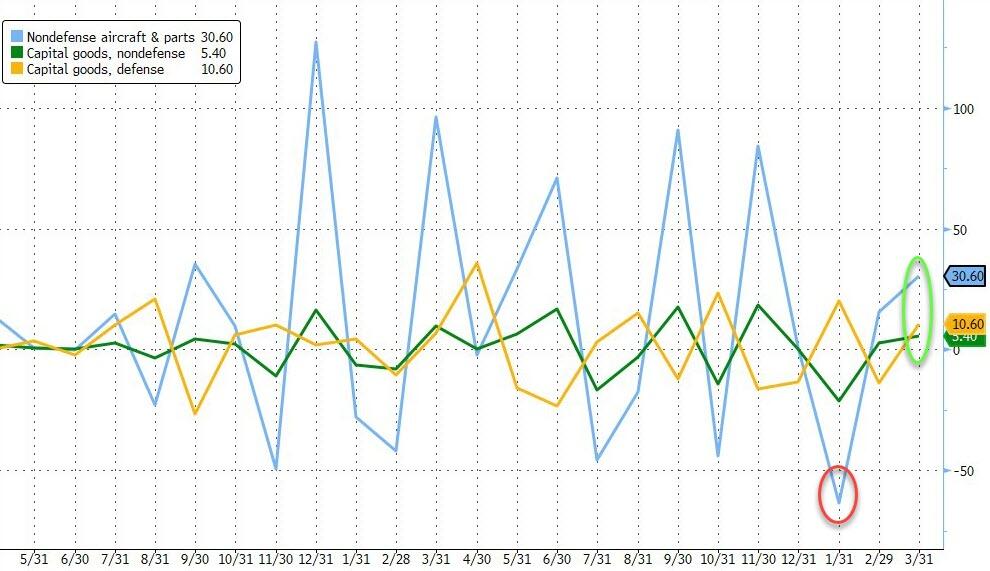
Under the hood, defense and non-defense capital goods orders rose with non-defense aircraft orders surging over 30% MoM…
Source: Bloomberg
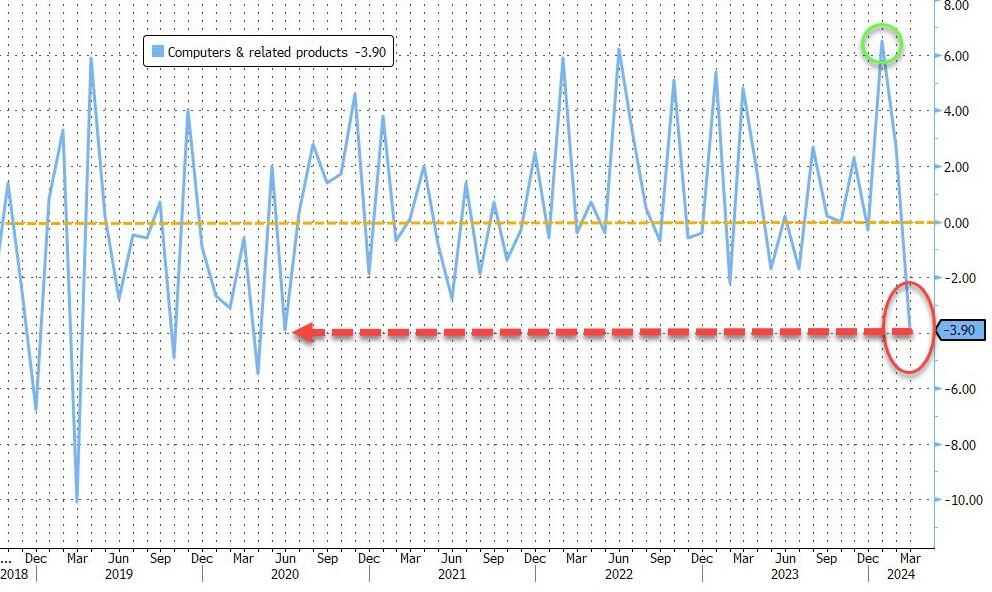
But… it looks like the AI bubble just burst as Computer & related Products orders plunged 3.9% MoM – the biggest drop since COVID lockdowns…
Source: Bloomberg
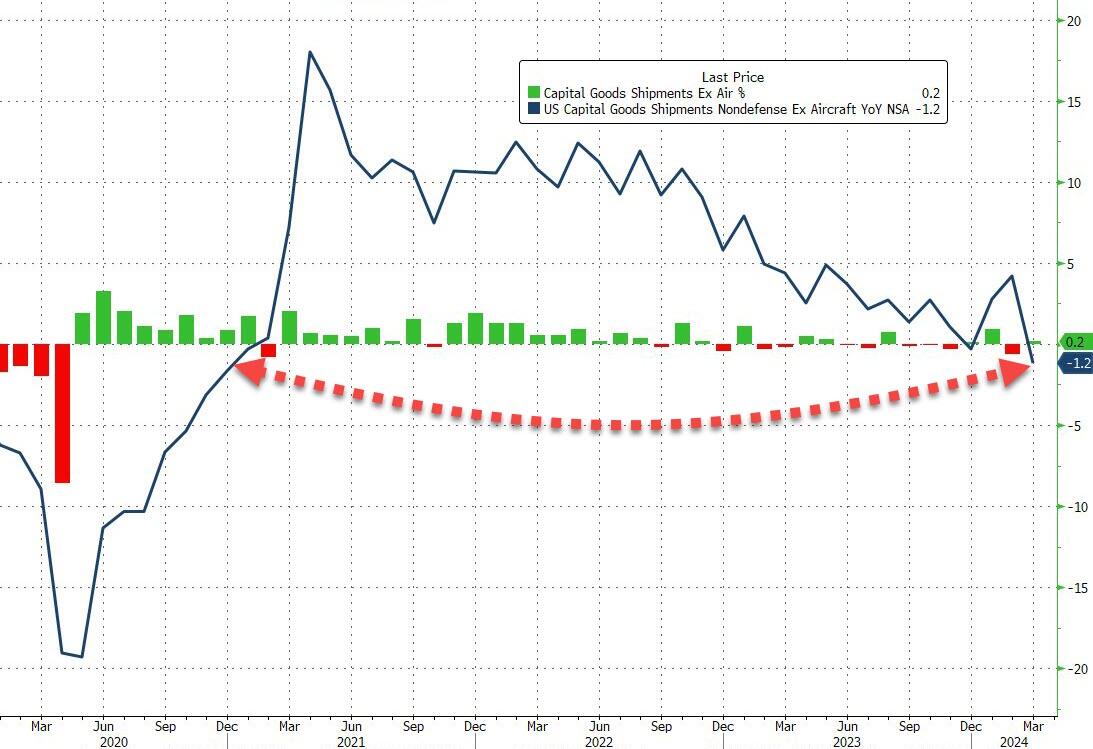
Finally, and more problematically, core capital goods shipments – a figure that is used to help calculate equipment investment in the government’s gross domestic product report – saw only a small 0.2% MoM rise, which left core shipments down 1.2% YoY – the biggest YoY drop since the COVID lockdowns…
Source: Bloomberg
Now that Biden is considering a NATIONAL CLIMATE EMERGENCY granting him 130 War-like powers, I shudder to think for much green spending he will initiate.
Biden: “How many times does Trump have to prove we can’t be trusted?”
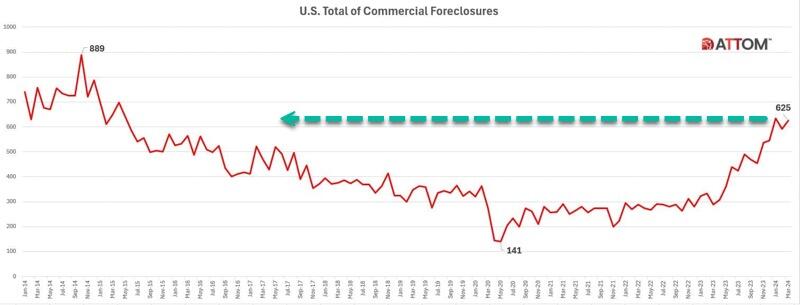
The latest report from real estate data provider ATTOM shows CRE foreclosures topped 625 in March, up 6% from February and 117% from the same period last year.
ATTOM has been tracking commercial foreclosures since 2014. The number of foreclosures is approaching the peak of 889 in October 2014.
“California began experiencing a notable rise in commercial foreclosures in November 2023, surpassing 100 cases and continuing to escalate thereafter,” the report said.
New York, Florida, Texas, and New Jersey also showed increases in CRE foreclosures last month.
Regional banks provide a bulk of the financing for the space. The ongoing mess in the lending space due to tighter conditions adds pressure to the CRE downturn. Banks are expected to set aside more money to cover potential CRE losses.
Last month, Federal Reserve Chair Jerome Powell testified on Capitol Hill, “We have identified the banks that have high commercial real estate concentrations, particularly office and retail and other ones that have been affected a lot,” adding, “This is a problem that we’ll be working on for years more, I’m sure. There will be bank failures, but not the big banks.”
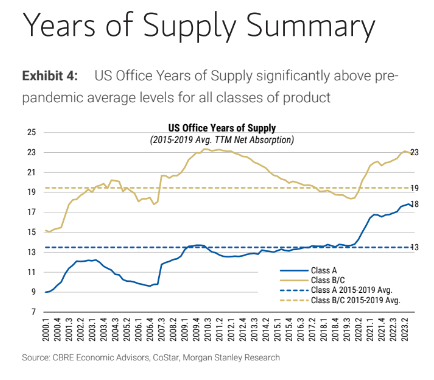
Data from a recent Treasury Department’s Financial Stability Oversight Council (FSOC) warned office vacancy rates have climbed sharply in recent years, reaching a record of 13.1% at the end of 2023.
CoStar analyst Phil Mobley recently noted the “reset in office demand has rocked US markets.”
Morgan Stanley warned earlier this year that office prices could plunge 30% due to sliding demand.
For those wondering why the excess supply of office towers can’t be converted into affordable housing, Goldman also noted that prices must drop 50% for housing conversions to make sense.
Powell has a rolling crisis on his hands. And the goal is to save the fireworks for after the election.
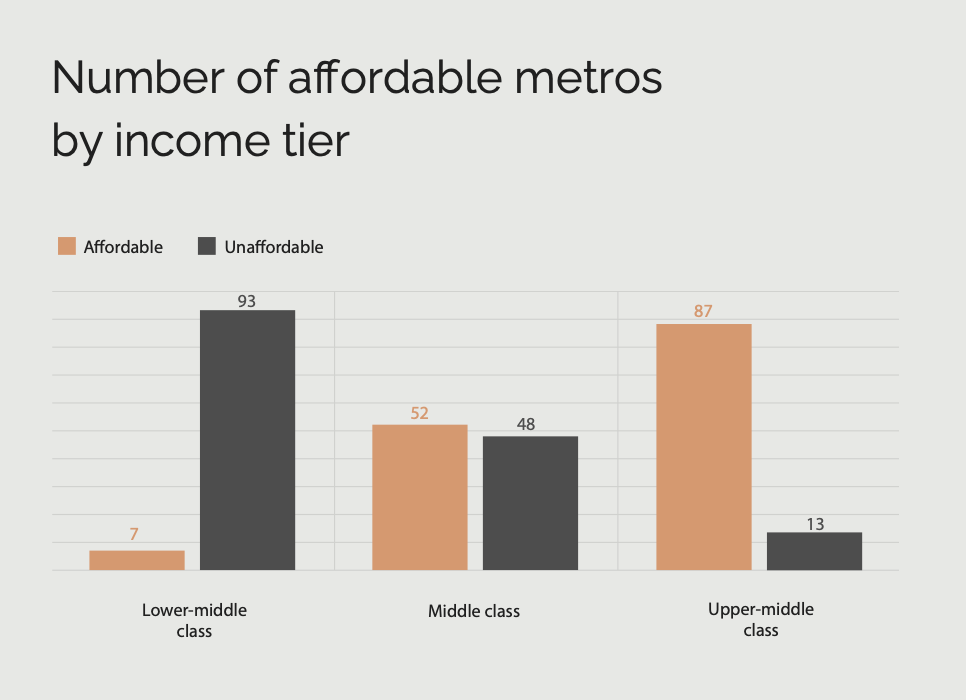
Housing is becoming an exclusively upper-class privilege in a growing number of cities.
According to a new study by Creditnews Research, in 2024, middle-class households could afford to buy an average home in just 52 of the country’s 100 largest metros.
Just five years earlier, they could afford a home in 91 of the top 100 metros.
The situation is far worse for lower middle-class households, as they can only afford a home in seven of the largest 100 metros.
In total, 41 out of the 100 metros require a gross annual income of $100,000 or more to qualify for an average home. In 13 metros, an average income of more than $155,000 is needed.
In those cities, even the upper-middle class doesn’t qualify for an average home.
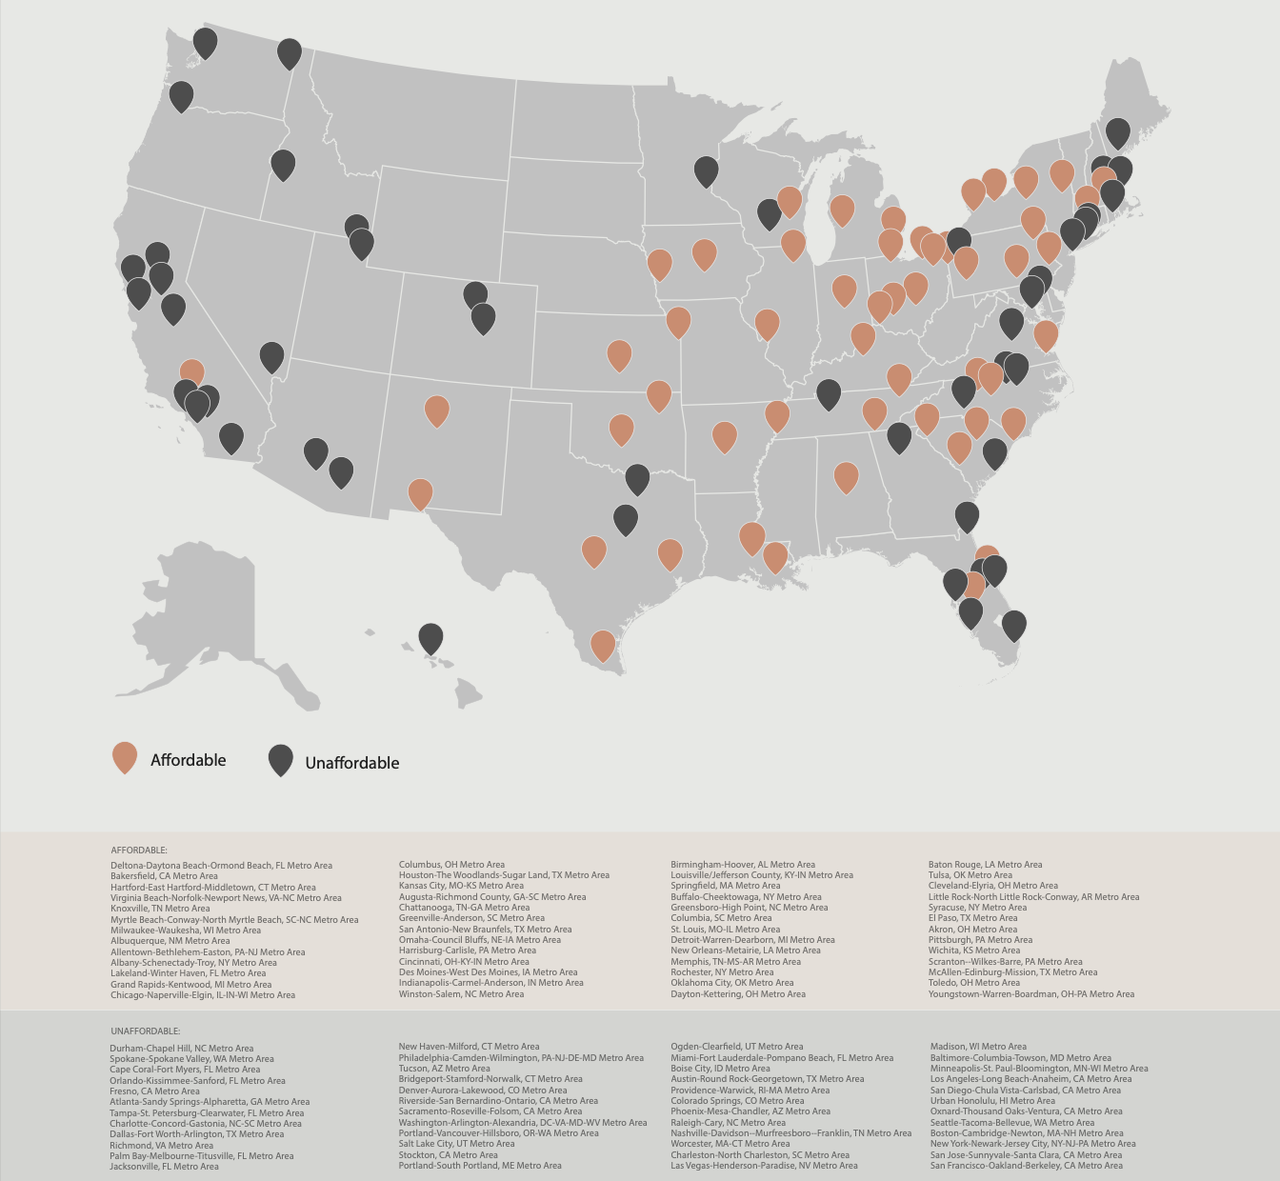
The study determined affordability by looking at how much income households need to earn to afford a down payment, mortgage payment, and related fees for an average home.
A home is considered affordable if monthly housing and mortgage costs don’t exceed 28% of a household’s gross income.
“There’s no two ways about it: Housing affordability has worsened significantly since Covid,” the report said. Since the pandemic, 39 of the most populous metros have fallen below the affordability threshold.
As expected, the most affordable areas for the middle class are located in the Midwest, Rust Belt, and parts of Texas, while the West Coast, Tri-State Area, and Hawaii are largely out of reach.
Affording a home is no longer a guarantee for the middle class
Being considered “middle class” doesn’t carry the same significance as it did just a few years ago.
“In the past, if you were middle class, it was almost assumed you would become a homeowner,” said Ali Wolf, chief economist of Zonda, a housing market research firm.
“Today, the aspiration is still there, but it is a lot more difficult. You have to be wealthy or lucky.”
That’s all thanks to a “perfect storm” of elevated mortgage rates, sky-high home prices, and a lack of inventory, making housing more unaffordable.
The result is that middle-income buyers, or those with an annual income of up to $75,000, could only afford about one-quarter of listings on the market last year.
According to Nadia Evangelou, the director of real estate research at the National Association of Realtors, “Middle-income buyers face the largest shortage of homes among all income groups, making it even harder for them to build wealth through homeownership.”
Mortgage rates (blue line) creep closer to 7%. Mortgage rates are UP 168% under Vacation Joe and home prices are up 32.5%.
After falling between November and January, mortgage rates are creeping back up.
According to Freddie Mac, 30-year fixed-rate mortgages reached 6.88% in the week of April 11 and at some point climbed well above 7%.
The reversal seems to be driven by a surprise spike in inflation, which has come out higher than expected for four consecutive months
“For homebuyers, the latest CPI report means mortgage rates will stay higher for longer because it makes the Fed unlikely to cut interest rates in the next few months,” said Chen Zaho, Redfin’s economic research lead.
“Housing costs are likely to continue going up for the near future, but persistently high mortgage rates and rising supply could cool home-price growth by the end of the year, taking some pressure off costs.”
President Obama selected Slow Joe Biden as his Vice President because 1) he was white and 2) an alleged foreign policy wizard in The Senate. Between Afghanistan, Ukraine, Israel, Taiwan and every other foreign policy disaster under his leadership, I am beginning to doubt Biden’s foreign policy acumen. For example …
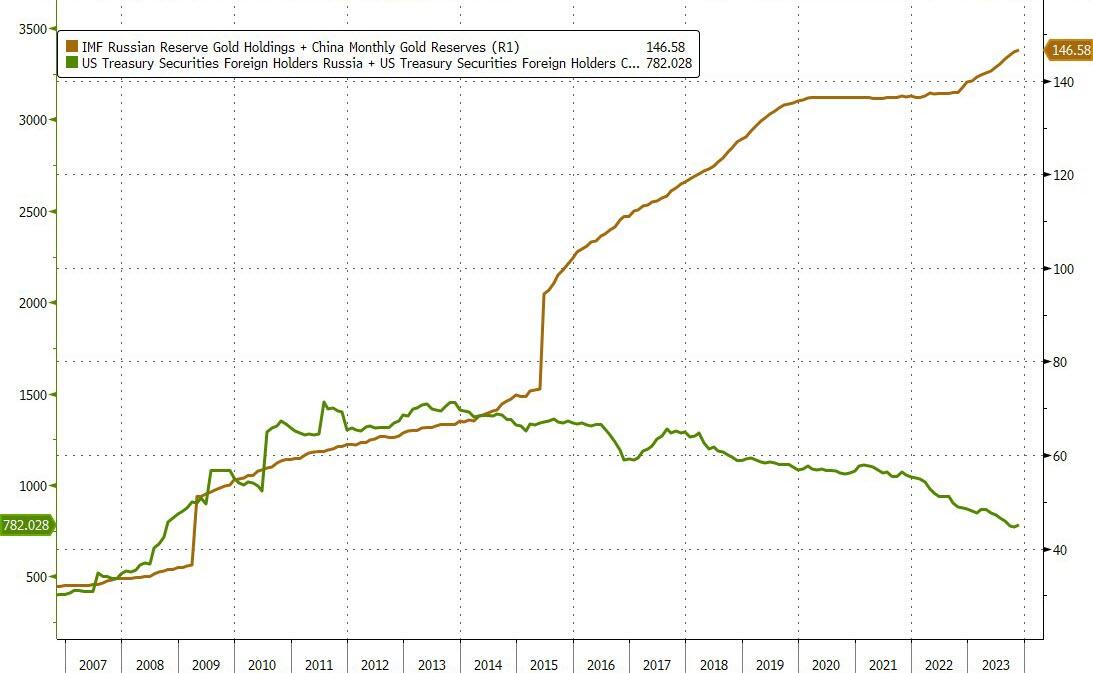
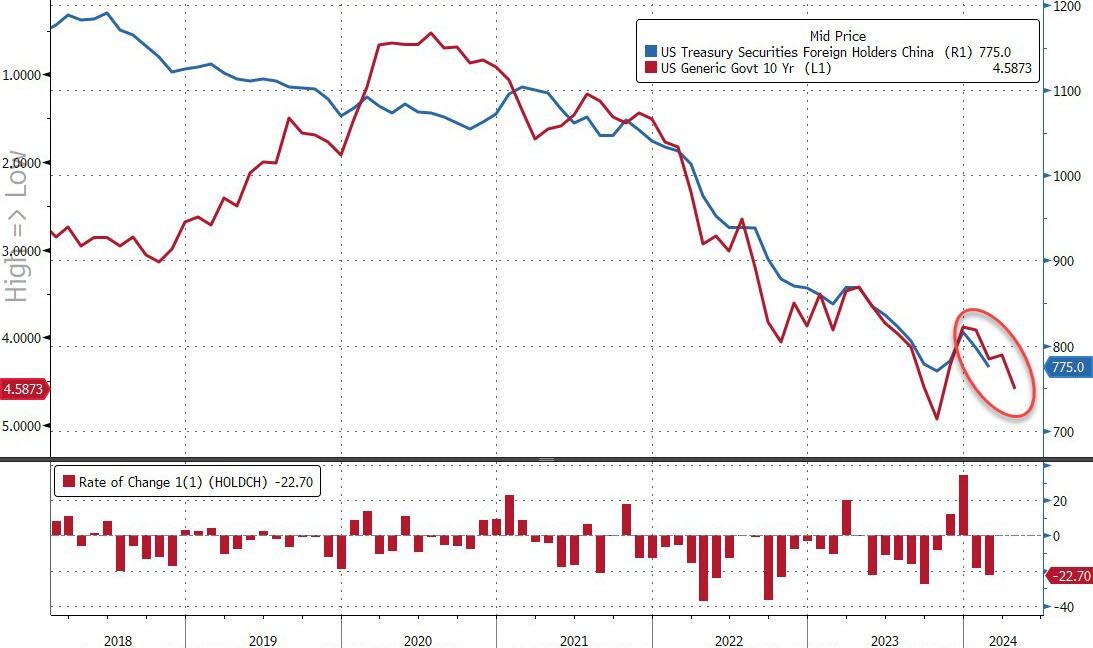
While we are acutely aware of the fact that ‘correlation is not causation’, one would find it hard to argue that the practically perfect concomitance of China’s Treasury holdings and the yield of the US 10Y Treasury note over the past three years makes us wonder (in our out-loud voices), if – away from The QT, The FedSpeak, the macro-economy, the geopolitical crises, the AI-hype, the growth scares – if it’s not just all a well-managed (slow and steady) liquidation of China’s (still massive) US Treasury holdings…
Source: Bloomberg
It’s hard to argue they don’t have an incentive to a) de-dollarize, and b) not liquidate it all at once, shooting themselves in the face.
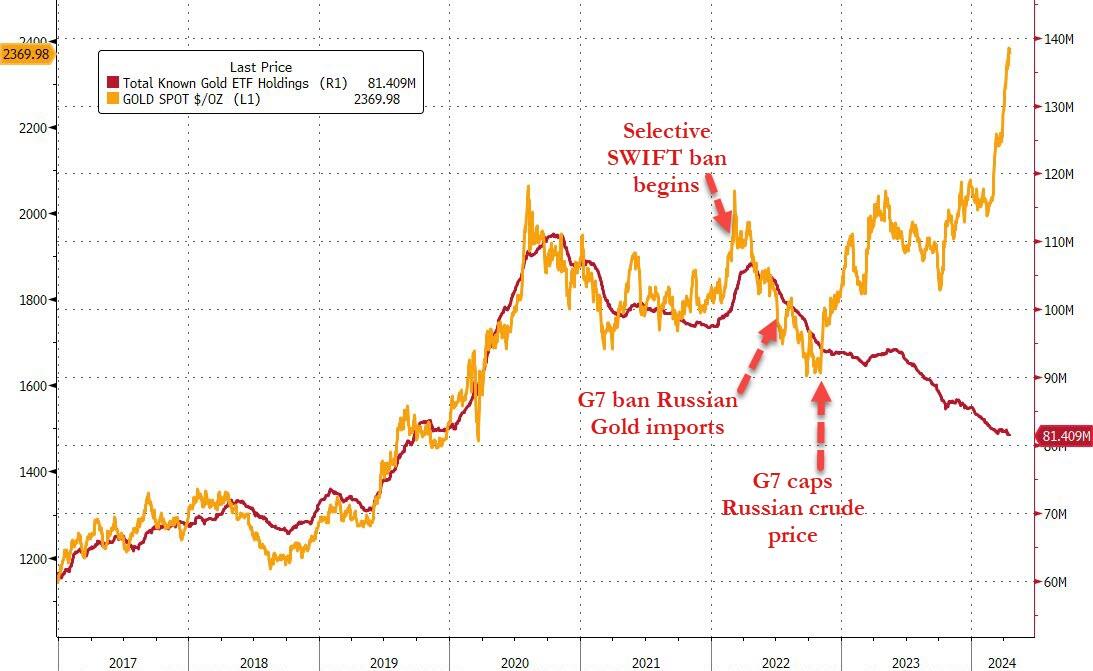
While the de-dollarizing has been steady in Treasury-land (enabled by a vast sea of liquid other players), things have been a little more ‘obvious’ in the alternative currency space – i.e gold.
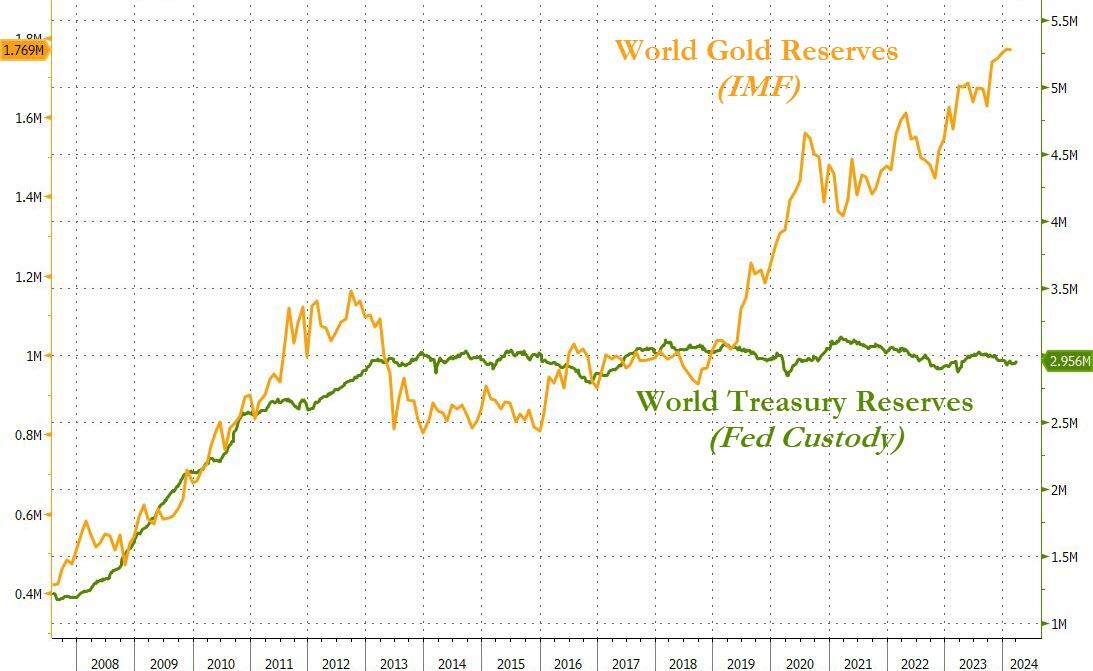
And in case you wondered, it’s not just China and Russia, world reserve Treasury holdings are ‘relatively’ flat (based on Fed’s custody data) while according to The IMF, the world’s sovereign nations have been buying gold with both hands and feet…
Source: Bloomberg
…happy to take whatever retail-ETF-sellers are offering into their physical vaults…
Source: Bloomberg
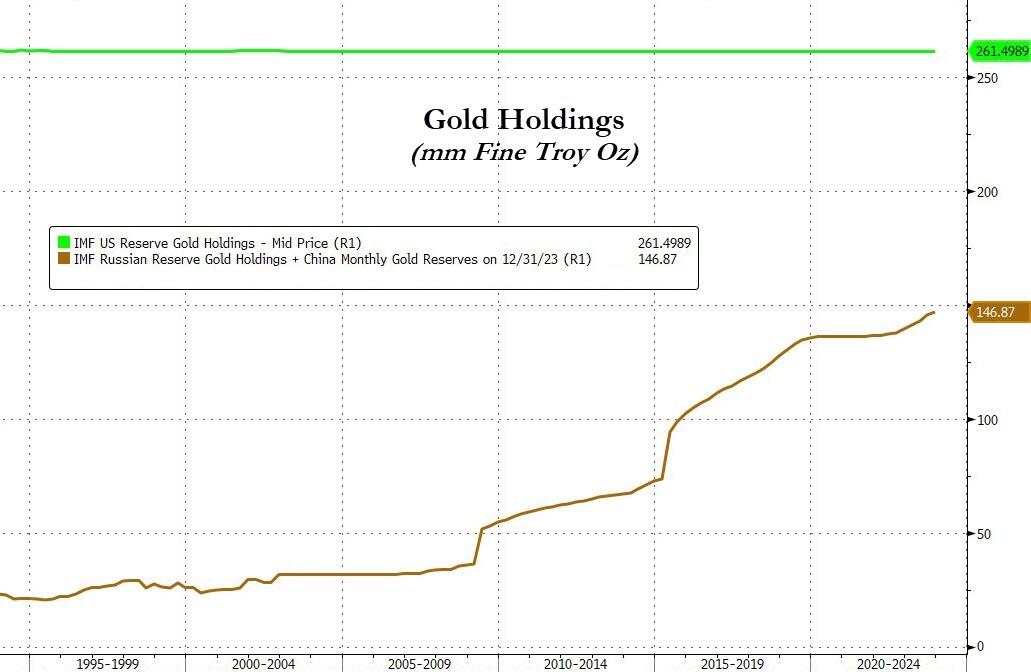
Finally, as we note in the chart, this all started to ‘escalate quickly’ when Washington really started to weaponize the dollar.
Assuming that all the US gold is still in Fort Knox (and assuming that China and Russia are honest about their holdings), the world’s ‘other superpowers’ are rapidly catching up to the US’ holdings…
Source: Bloomberg
Who could have seen that coming? With mortgage rates hitting 7.5%, the home price to median household income ratio just hit an all-time high.
The 10Y Treasury yield just hit 4.519%.
And we have The Federal Reserve posting record losses.
Did we REALLY elect this fool Biden as President??


You must be logged in to post a comment.