Funky cold Joe Biden is his reaction to inflation caused by his outragous spending. His legion of sycophants are now saying inflation is a good thing or don’t notice it. But Biden will never stop spending .
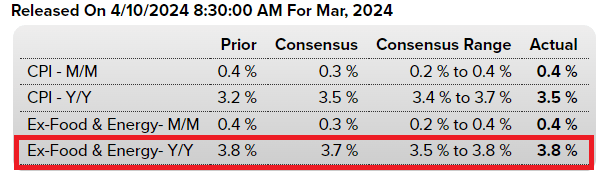
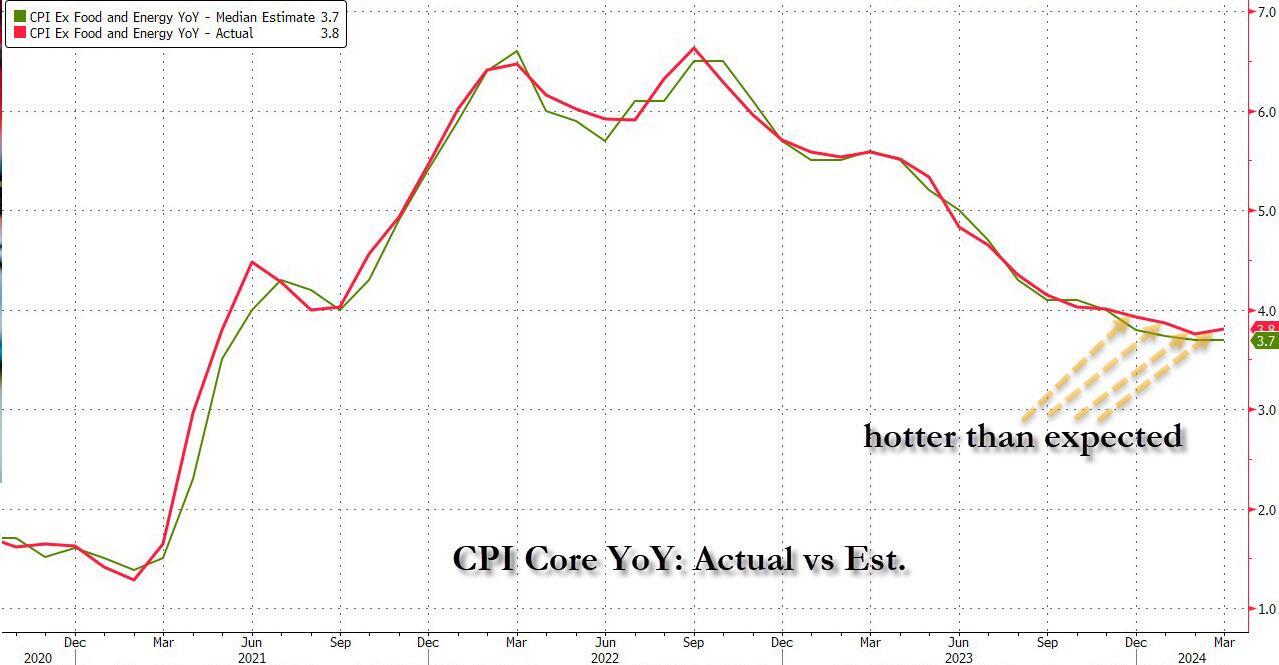
Coming into today’s CPI number, which followed three previous red-hot inflation prints, we said that it’s time for a “miss” (the first of 2024) not because the data demands it – on the contrary, prices continue to rise at a frightening pace – but because a dovish CPI print today would be the last opportunity for the Fed to set a timetable for a rate cut calendar ahead of November’s election.
Well, you can wave goodbye to all that, because we just got the 4th consecutive “inflation beat” in a row…
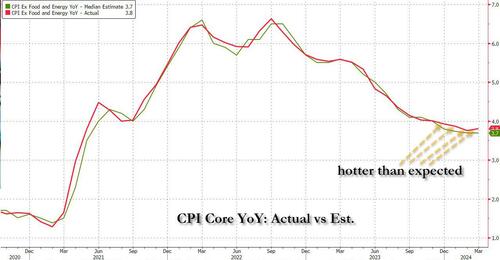
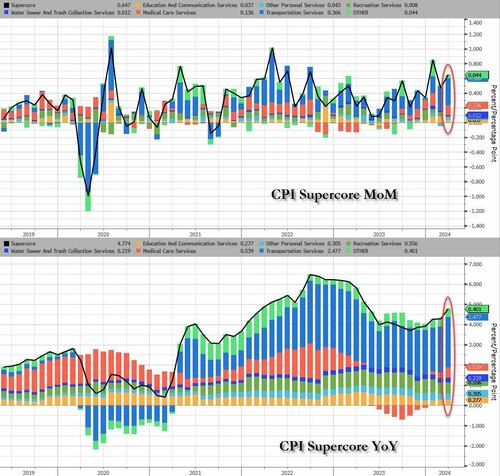
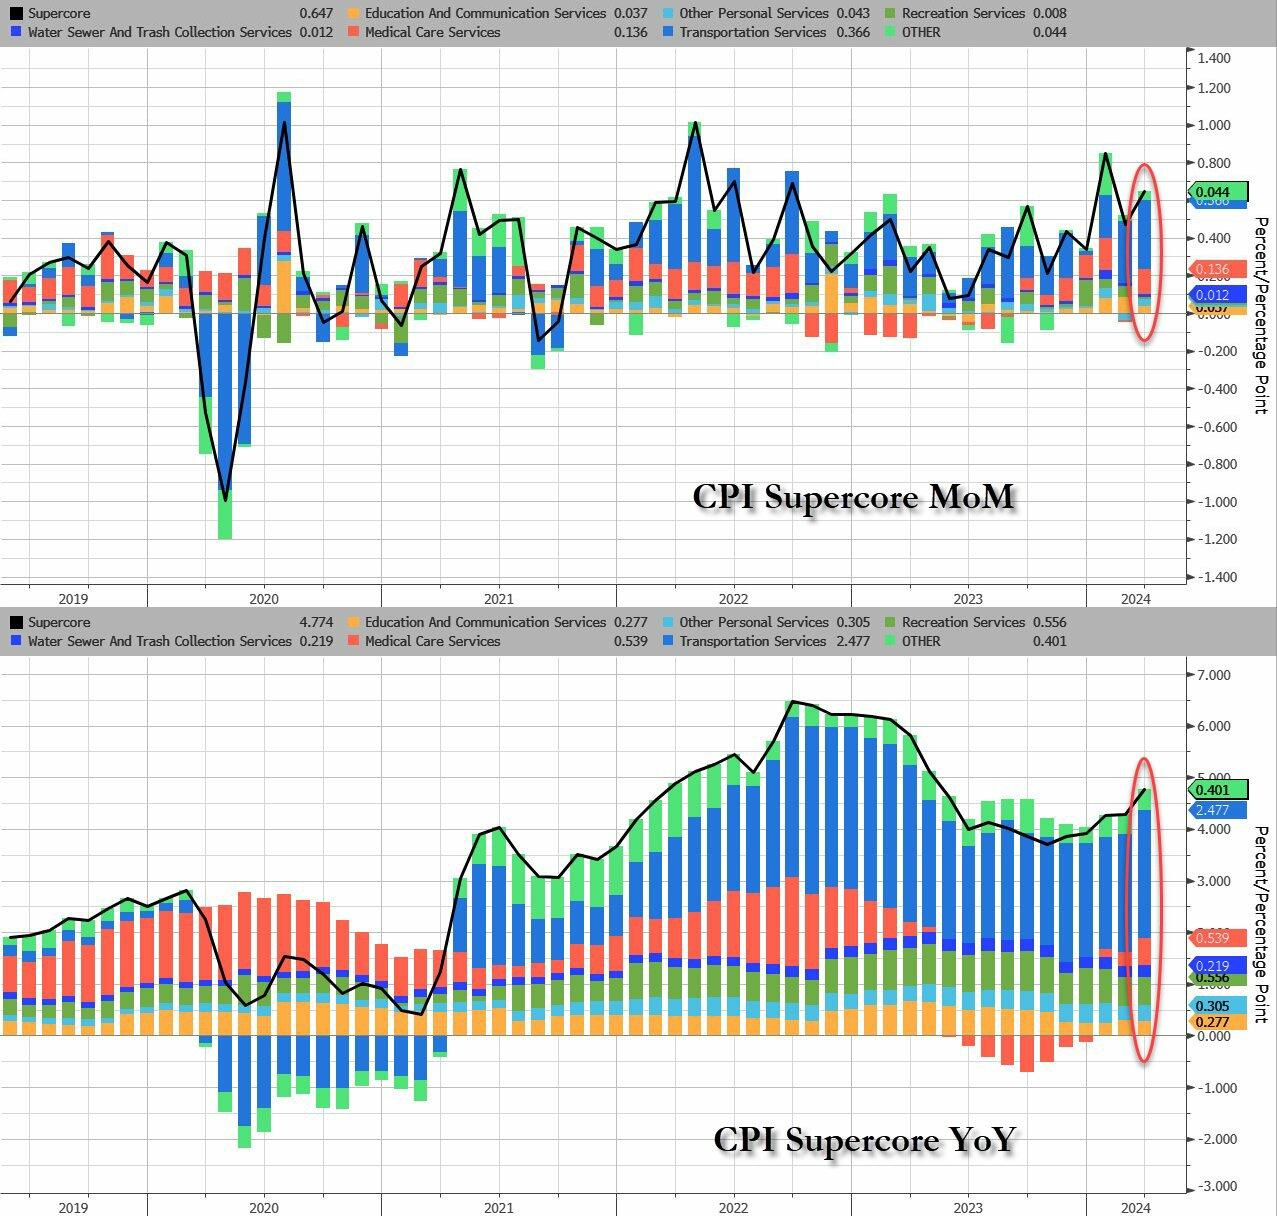
… with supercore inflation coming in blazing hot…
… thanks to a boiling inflation print which saw every single CPI metric coming in hotter than expected – was a shock, not because it reflected reality, but because it effectively sealed Biden’s fate because as Bloomberg’s Chris Antsey writes, “obviously, this is very bad news for Joe Biden… we’re approaching the point where high inflation is bound to still be in voters’ minds when they head to the polls, regardless of how the price figures come in over summer.”Easy financial conditions continue to provide a significant tailwind to growth and inflation. As a result, the Fed is not done fighting inflation and rates will stay higher for longer.”
It’s about to get even worse: recall today we have a $39 billion 10-year auction which is already being dubbed “sloppy” and a definitive break of 4.5% could easily extend if underwriting dealers are left holding the bag. As it stands, the 10yr has popped above the 4.5% parapet. Ian Lyngen at BMO Capital Markets says:“We expect the setup to the auction will break 4.50% in 10-year yields with ease.”
Obviously, this is very bad news for Joe Biden. It’s still only April, and we’ll have another half-a-year’s worth of inflation reports before the election. But we’re approaching the point where high inflation is bound to still be in voters’ minds when they head to the polls, regardless of how the price figures come in over summer.
Joe Biden continues to act like a gangsta giving away student loan forgiveness despite being told no by the US Supreme Court. As I said, Funky Cold Joe Biden. But Biden’s gangstaism favors the top 0.5% of net worth people, not the masses.
As Biden gropes for more voters, claiming he was raised in Puerto Rican, Greek, Black, and every other race on the planet, he probably sings “Ride The White Horse” to The Presidency. Reminiscint of Hillary Clinton claiming she kept a packet of hot sauce in her purse when talking to a black commentator.
We are living in the USA where corruption, favoritism, open borders and an out-of-control Federal budget and debt are destroying this once great nation.
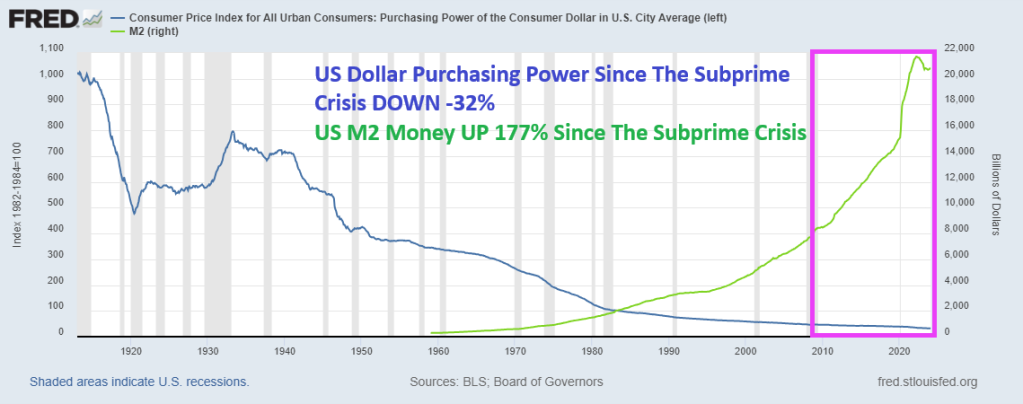
Former Kansas City Fed President Thomas M. Hoenig was absolutely right when he said recently that The Federal Reserve panders to Wall Street, Congress and special interest groups, prioritizing immediate relief over financial stability. Bernanke’s zero-interest rate policies (ZIRP) and Quantitative Easing (QE) were short-term fixes that never went away. Indeed, since the subprime mortgage crisis of 2008-2009, US Dollar purchasing power is DOWN -32% and M2 Money is up a staggering 177%. While Yellen stuck with zero-interest policies until Trump was elected, then raised The Fed Funds Target Rate 8 times. Yellen only raised the target rate once under Obama. Clearly playing political favoritism.
The Federal Reserve’s lack of transparency comes amidst reports that countries are removing their gold and other assets from the U.S. in the wake of the unprecedented Western sanctions imposed on Russia over its invasion of Ukraine. According to a 2023 Invesco survey, a “substantial percentage” of central banks expressed concern about how the U.S. and its allies froze nearly half of Russia’s $650 billion gold and forex reserves.Headline USA filed a FOIA request with the Fed for records reflecting how much gold the Federal Reserve Bank of New York currently holds in its vault, as well as records reflecting the ownership stake that each of FRBNY’s central bank/government clients have in that gold. The FOIA request also sought records about the Fed’s gold holdings prior to Russia’s February 2022 invasion of Ukraine. However, the Federal Reserve denied the FOIA request on Wednesday.
It influences the price of nearly everything, as well as the availability of jobs, the stability of our banking system, and the purchasing power of our money.
When the Fed Chair speaks, the entire world stops to listen.
But the average person has a poor understanding of how this colossally important entity operates. Or even why it exists.
And after a series of asset price bubbles — which some argue we’re in another one now — a chorus skeptical of the Fed’s actions has emerged.
So today we’re doing our best to shine as bright a light as possible on the Fed: how & why it operates, the good & as well as the shortcomings of its actions to date, what direction its policies are likely to take from here, and how all of this impacts the households of regular people like you and me.
Here are my top takeaways from from a speech by former KC Fed President Thomas Hoenig:
Dr Hoenig admits the Federal Reserve has experienced substantial “mission creep” since its creation as a lender of last resort. Its track record is very much “mixed” in terms of delivering on the intent of its policies. In Dr. Hoenig’s opinion, its efforts to add stability sometimes instead only create more instability.
While very critical of the Fed’s QE and ZIRP policies in the wake of the GFC, and more recently in the $trillions in monetary & fiscal stimulus unleashed post-COVID, Dr Hoenig thinks current Fed policy is “about right”. Though he expects the Fed to come under serious pressure soon as ebbing liquidity allows recessionary forces to build. He thinks the Fed will need to make an important decision within the coming year: return to QE and re-flame inflation, or allow a recession to occur.
Dr Hoenig criticizes the Federal Reserve for pandering to various interests, noting that short-term thinking and pressures from Wall Street, Congress, and interest groups often lead to decisions that prioritize immediate relief over long-term stability — a sort of “We’ll act now for optics sake and hopefully figure things out later”
In Dr Hoenig’s opinion, our fiscal policy is a runaway disaster. He criticizes both political parties of Congress for their roles in the cycle of ever-increasing deficits. Democrats advocate increased spending and tax hikes, while Republicans aim to keep taxes low but fail to curb spending. He warns of dire long-term consequences for future generations due to this impasse.
Dr Hoenig is very worried about the current stability of the banking system (and this from a former Direct of the FDIC!). He advocates for essential reforms to address government spending, prioritize essential areas without relying on future borrowed funds or inflationary measures, and communicate transparently with the public. He stresses the importance of reducing debt growth substantially below national income growth to avoid a full-blown crisis scenario in the future.
Dr Hoenig predicts the purchasing power of the US dollar (and other world fiat currencies) will continue to decline due to current policies and the lack of a “discipline” to money creation. Until such a discipline is restored (perhaps a return to some sort of hard backing of the currency), the dollar’s fall in purchasing power won’t abate.
Dr Hoenig suggests investing time in reading history and biographies as a valuable way to learn about leadership and gain insights into what strategies works and which don’t.
Here is the “Sound Money Parade” in 1896. By the aftermath of the subprime crisis, Janet Yellen (1993-2020) adopted the UNSOUND Money Fest, an orgy of printing and charging near zero interest rates. Powell in 2021 is ever-so-slowly unwinding The Fed’s balance sheet, but Powell has raised The Target Rate to its highest level since 1998 to fight inflation caused by Biden’s policies.
Combine The Fed not telling us how much gold they hold and their overprinting problems since 2008, and you can see why investors are turning to gold and silver and crypto currencies. The adoption of Central Bank Digital Currency (CBDC) is a step towards financial collapse.
Here is a parade you will NEVER see in Washington DC. A Sound Money Parade!
Powell is beginning to act like a sound money fan, but he still is taking his sweet time shriking the balance sheet.
I am thinking of fleeing to Lilliehammer Normay like Frank Tagliano.
Joe Biden (aka, BeelzeBiden) is really a piece of … work. His policies are helping drive prices through the roof, he seeks to protect deepstate employees against removal by Trump, had a disastrous withdrawal from Afghanistan and is getting the US engaged in possible hot wars in Ukraine (against Russia), open borders allowing US crime to spike, seems to be suppoporting Hamas over our long-time ally Israel, the list goes on. Biden’s big push for electric cars is a Socialist fantasty and simply unrealistick, drives up energy costs and is EXPENSIVE. It is like Biden is the demon Beelzebub from the TV show “Supernatural.” I once referred to Washington DC as “Mordor on The Potomac.”
Throw in the Federal Reserve operating outside their mandate (excessive interference in the financial crisis of 2008, the excessive interfernce after the Covid outbreak in 2020) and the two together are destroying the US.
Look at housing prices (up 32.5% under Biden) against the purcchasing power of the US dollar (down -16.1% under Biden).
The problem has gotten so bad that Sedona, Arizona, recently set aside a parking lot exclusively for these homeless workers. The city is even installing toilets and showers for the new occupants.
Apparently, the City Council thought installing temporary utilities was cheaper than solving the area’s cost-of-living crisis.
And what a crisis it is.
The average home in the city sells for $930,000, while most of the housing available for rent is not apartments, but luxury homes targeted at wealthy people on vacation.
With such a shortage of middle-class housing and with starter homes essentially nonexistent, low- and even middle-income blue-collar workers have nowhere to go at night but their back seat.
Much like America’s Great Depression in the 1930s, this marks a serious regression in our national standard of living. But shantytowns were not prevalent in the 1920s (a decade that began with a depression) or the 1910s. Nor were they ubiquitous following the Panic of 1907, which set off one of the worst recessions in American history.
Indeed, Americans in the Great Depression faced such a cost-of-living crisis that many were forced to accept a standard of living below what their parents and even their grandparents had.
Fast-forward about 90 years, and countless families are in the same boat. Many young people today don’t think they’ll ever be able to achieve the American dream of homeownership that their parents and grandparents achieved. The worst inflation in 40 years, rising interest rates, and a collapse of real (inflation-adjusted) earnings mean a huge step backward financially.
That inflation has pushed up rents so much that young Americans are moving back in with their parents at rates not seen since the Great Depression because they can’t make it on their own. Sometimes, they can’t even make it with multiple roommates.
But many people cannot move back in with family, so the car it is.
The housing problem is not limited to wealthy towns in Arizona, however. It is systemic. The monthly mortgage payment on a median-price home has doubled since January 2021, and rents are at record highs. Like the Great Depression, this disaster stems from impolitic public policy.
For the past several years, the government has spent, borrowed, and created trillions of dollars it didn’t have. The predictable result of this profligacy was runaway inflation, followed by equally foreseeable interest rate increases.
The deadly combination of high prices and high interest rates has frozen the housing market and reduced homeownership affordability metrics to near-record lows. In several major metropolitan areas, it takes more than 100 percent of the median household after-tax income to afford a median-price home.
Since rents and virtually all other prices have risen so much faster than incomes over the past three years, even renting is unaffordable today, so many people have to go into debt to keep a roof over their heads. And for some, that’s a car roof.
This is the kind of story you might expect from a Third World country or somewhere behind the Iron Curtain during the Cold War, not the largest economy in the world—at least not outside of a depression like the one in the 1930s.
Hoover certainly deserved some blame for the Great Depression, but so did the progressives in Congress, who came from both parties and repeatedly voted to meddle in the economy instead of allowing it to recover from the initial downturn.
Similarly, President Joe Biden deserves blame for constantly advocating runaway government spending. (Runaway Joe??)
But today’s multitrillion-dollar deficits are also made possible by the big spenders in Congress, who come from both parties.
If this bipartisan prodigality of Washington continues, Bidenvilles will only become more widespread as the housing affordability crisis worsens.
Biden’s official White House portrait.
Washington DC under Biden and Schumer, Pelosi, etc.
Like last month, today’s jobs report for March is better than Februrary’s miracle report, but has some glaring bad news that the Administration and slobbering media will ignore. Now you know why I no longer appear on CNBC, CNN or Fox Business anymore.
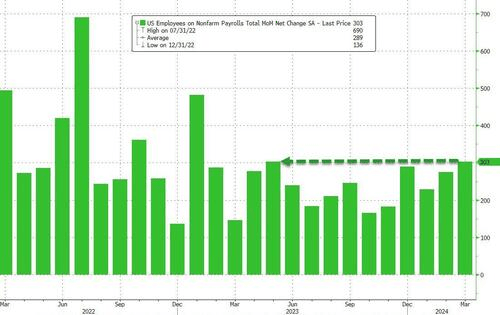
Let’s start with the good news! The BLS reported that in March, the US added a whopping 303K jobs, tied for the highest since Jan 2023!
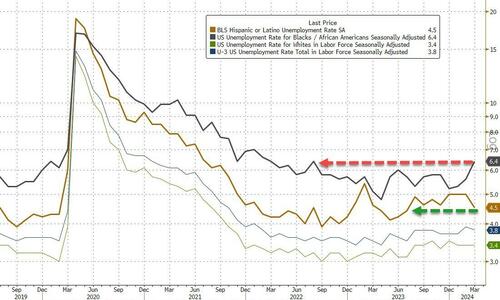
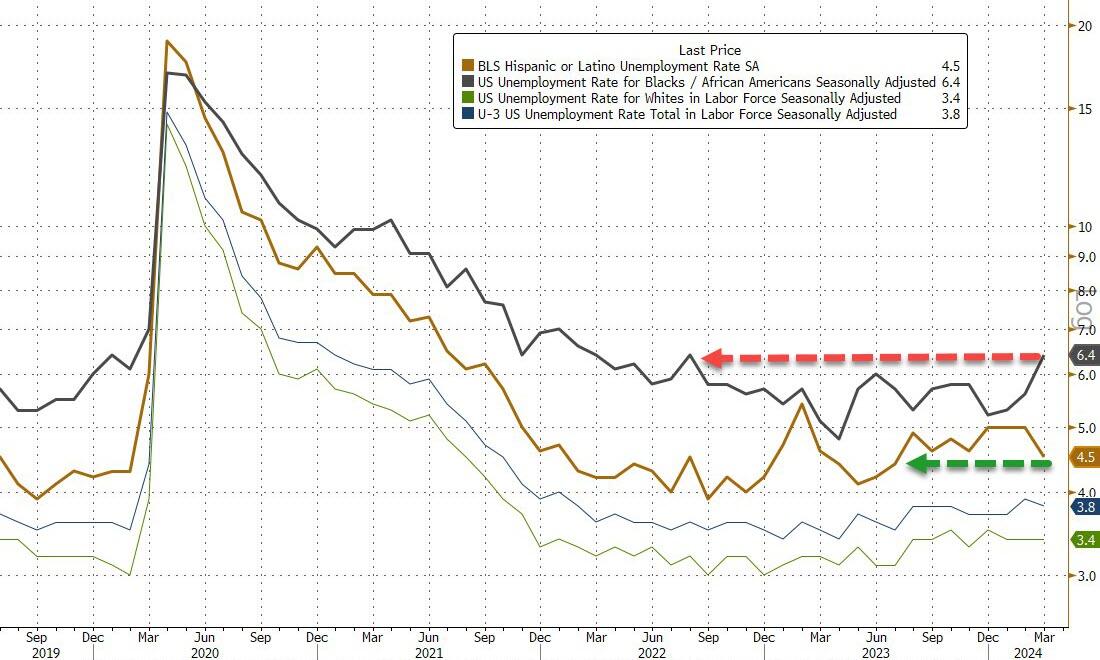
Turning our attention to the unemployment rate, it unexpectedly dipped again, dropping to 3.8%, from 3.9%, in line with estimates, as the number of unemployed workers dipped modestly from 6.458 million to 6.429 million while the number of employed workers rose by almost half a million workers; the unemployment rate for Blacks (6.4 percent) increased in March to the highest level in almost two years, while the rates for Asians (2.5 percent) and Hispanics (4.5 percent) decreased. The jobless rates for adult men (3.3 percent), adult women (3.6 percent), teenagers (12.6 percent), and Whites (3.4 percent) showed little or no change over the month.
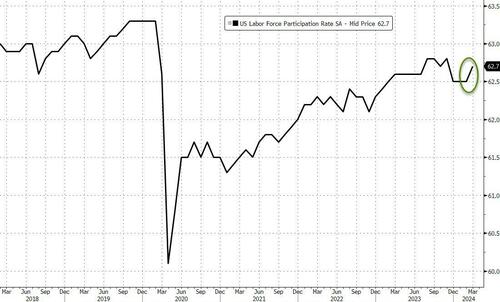
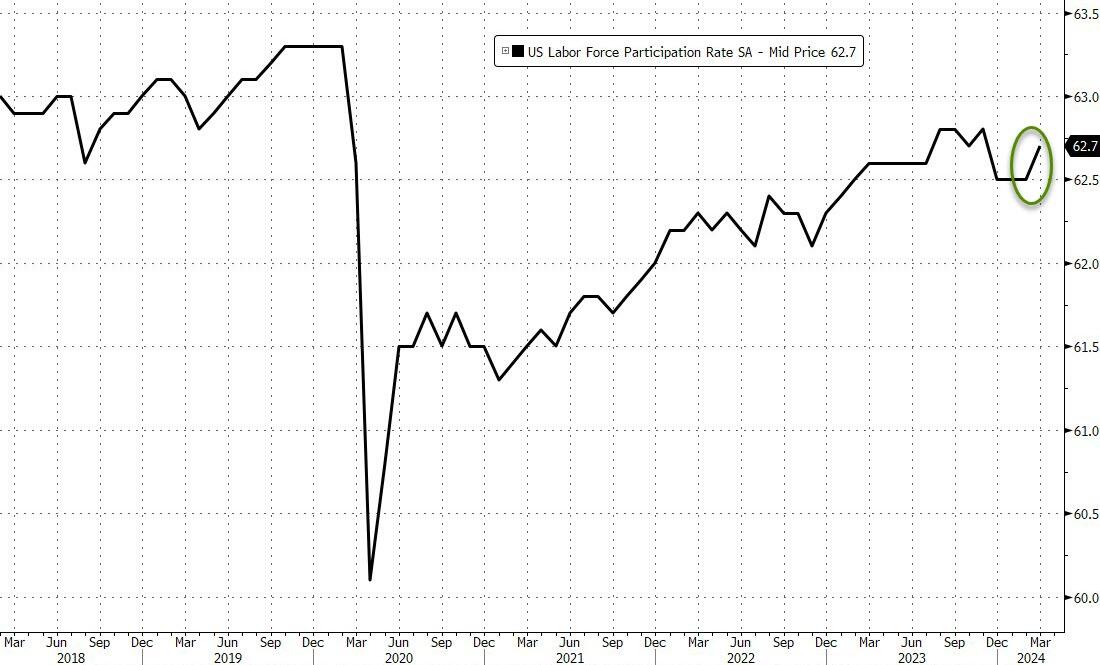
In contrast, the participation rate rose from 62.5% to 62.7%, above the 62.6% expected, as the overall civilian labor force increased slightly less than the number of employed people.
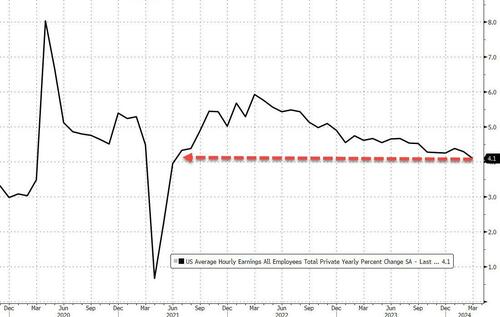
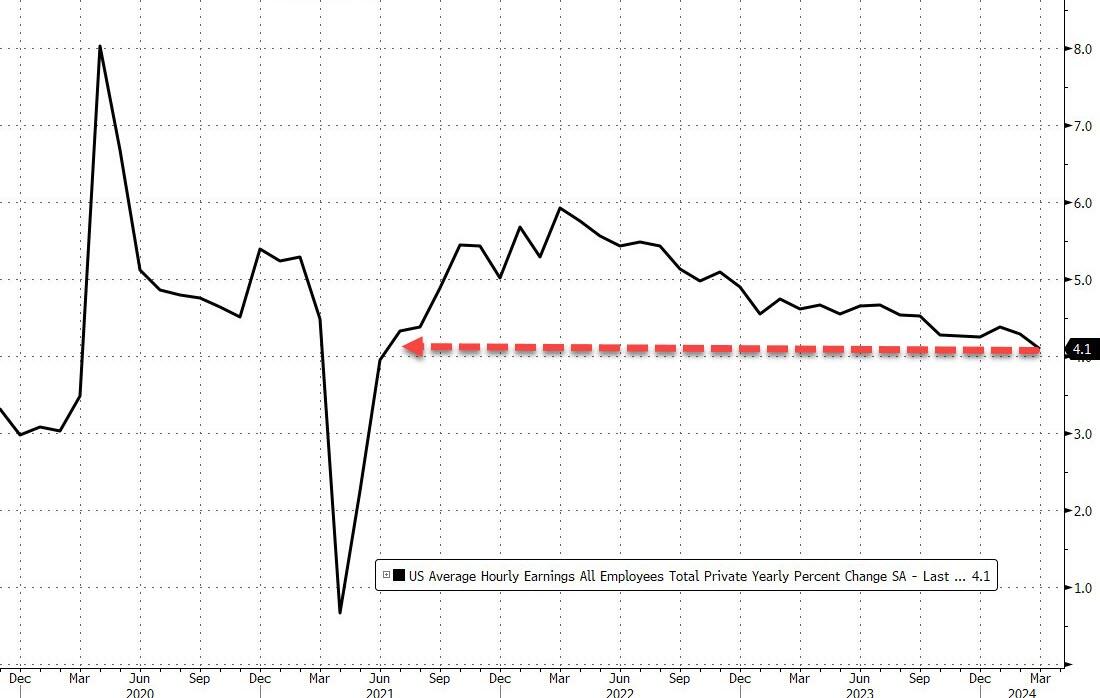
Now for the not-so-good news. The average hourly earnings came in as expected, rising 0.3% MoM, up from last month’s upward revised 0.2% sequential increase (revised from 0.1%), On an annual basis, the hourly earnings rose 4.1%, as expected, and down from 4.3%. This was the lowest print in almost three years: the last time wages rose by this much was the summer of 2021.
Now for the bad news.
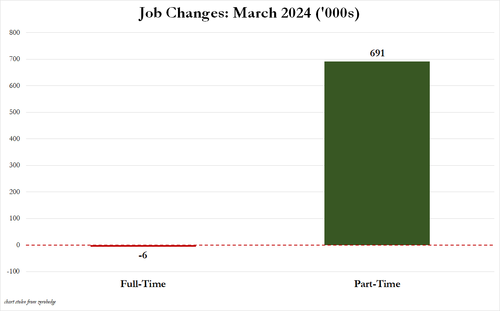
For those wondering if the jobs were all part-time, the answer is a resounding yes: in March, full-time jobs dropped by 6,000 as Part-time jobs soared by 691,000.
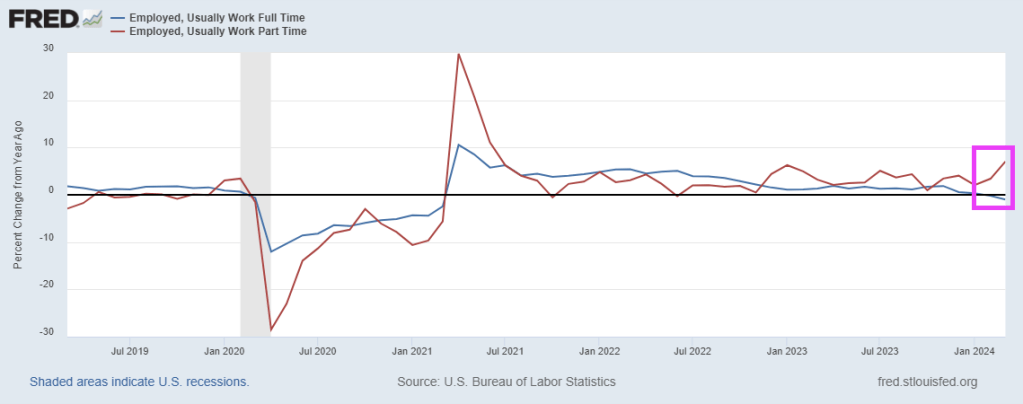
On a year-over-year (YoY) basis, full-time jobs were down -1.0% while part-time jobs were up 7.1%
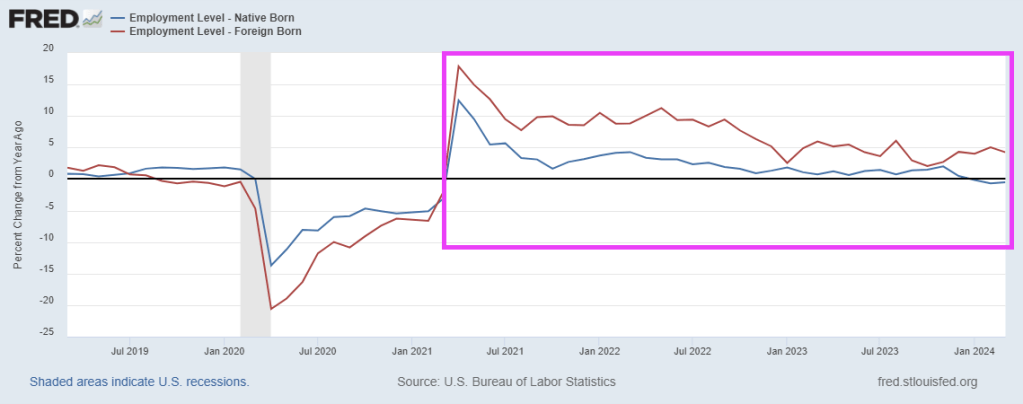
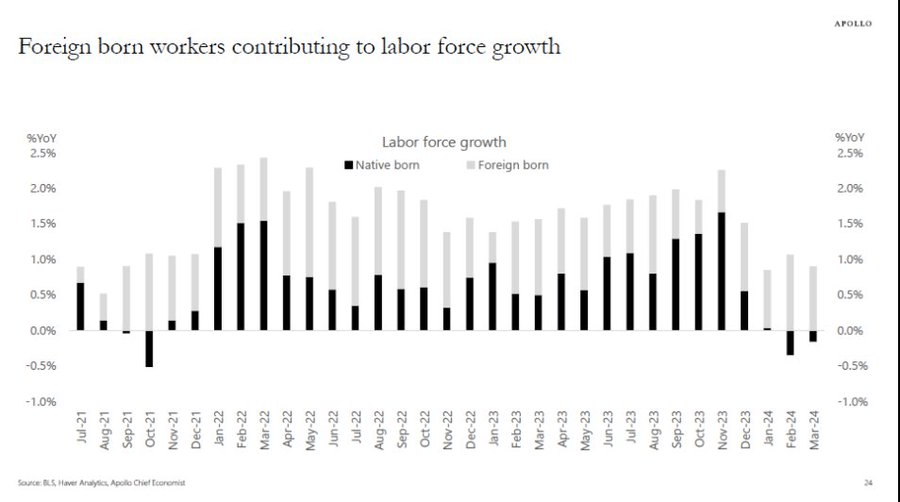
Native-born versus foreign born? On a YoY basis, native-born employment was down -0.5% while foreign-born employment increased by 4.2%.
Not only is Biden importing Democrat voters (since 70% of Americans HATE Biden’s policies), they are also displacing native-born Americans in the labor force.
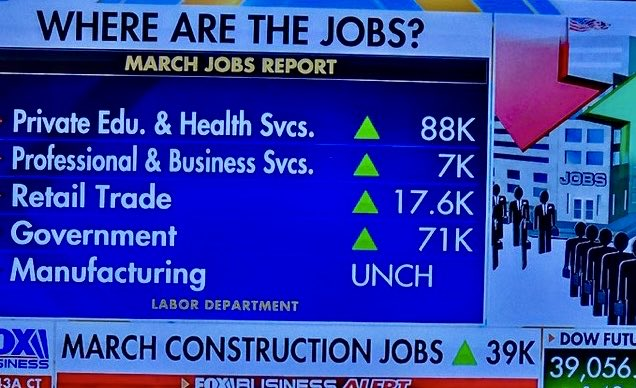
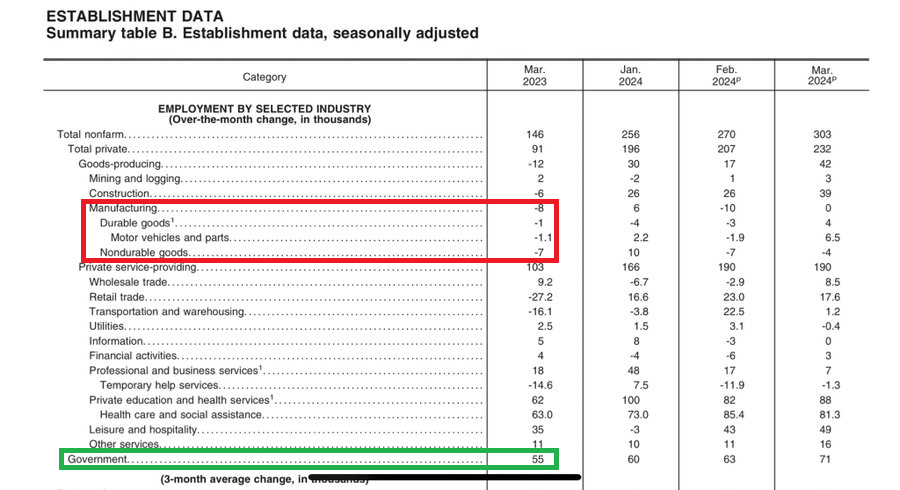
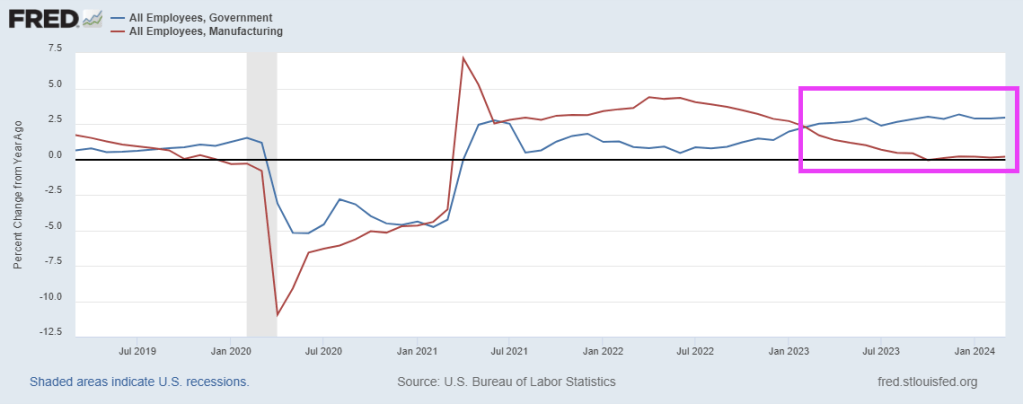
Manufacturing jobs added were ZERO. So, much for all of Biden’s claims. But NON-PRODUCTIVE government jobs were up 71,000. So our manufacturing jobs are dead while non-productive government jobs are growing like crazy.
Under Biden, the Administrative state is growing faster than manufacturing since Feb 2023. The Biden Administration implements new rules to prevent Trump’s ability to purge deep state employees if re-elected in 2024.
How will The Fed respond? Likely will lead to limited rate cuts.
1. Everybuddy: 100% of workforce 2. Wisense: 100% of workforce 3. CodeSee: 100% of workforce 4. Twig: 100% of workforce 5. Twitch: 35% of workforce 6. Roomba: 31% of workforce 7. Bumble: 30% of workforce 8. Farfetch: 25% of workforce 9. Away: 25% of workforce 10. Hasbro: 20% of workforce 11. LA Times: 20% of workforce 12. Wint Wealth: 20% of workforce 13. Finder: 17% of workforce 14. Spotify: 17% of workforce 15. Buzzfeed: 16% of workforce 16. Levi’s: 15% of workforce 17. Xerox: 15% of workforce 18. Qualtrics: 14% of workforce 19. Wayfair: 13% of workforce 20. Duolingo: 10% of workforce 21. Rivian: 10% of workforce 22. Washington Post: 10% of workforce 23. Snap: 10% of workforce 24. eBay: 9% of workforce 25. Sony Interactive: 8% of workforce 26. Expedia: 8% of workforce 27. Business Insider: 8% of workforce 28. Instacart: 7% of workforce 29. Paypal: 7% of workforce 30. Okta: 7% of workforce 31. Charles Schwab: 6% of workforce 32. Docusign: 6% of workforce 33. Riskified: 6% of workforce 34. EA: 5% of workforce 35. Motional: 5% of workforce 36. Mozilla: 5% of workforce 37. Vacasa: 5% of workforce 38. CISCO: 5% of workforce 39. UPS: 2% of workforce 40. Nike: 2% of workforce 41. Blackrock: 3% of workforce 42. Paramount: 3% of workforce 43. Citigroup: 20,000 employees 44. ThyssenKrupp: 5,000 employees 45. Best Buy: 3,500 employees 46. Barry Callebaut: 2,500 employees 47. Outback Steakhouse: 1,000 48. Northrop Grumman: 1,000 employees 49. Pixar: 1,300 employees 50. Perrigo: 500 employees
But, according to the government-supplied data…
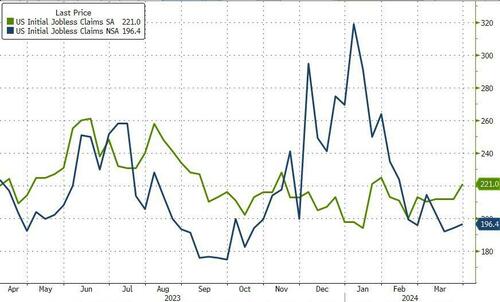
The number of Americans filing for jobless benefits for the first time last week rose from 212k to 221k (SA) to its highest since Jan, and claims ticked modestly higher on an NSA basis…
Source: Bloomberg
Continuing claims remain glued around 1.8mm Americans – where they have been for nine months…
Source: Bloomberg
But, here’s the thing… WARNs are soaring… and Challenger-Grey just announced that March saw the most job cuts (90,309) since January 2023…but government-supplied data on initial jobless claims continues to smoothly tick along near record lows…
Source: Bloomberg
The WARN data is very disturbing.
Ah, Bidenomics!!
If Trump wins in November, will all this data suddenly be ‘allowed’ to reflect reality?
But the feral pigs are already here in Washington DC as elected representative and non-elected bureaucrats.
Bidenomics is really about insane money printing after Covid and the installation of Biden as President. Biden and The Federal Reserve are both pushin’ too hard. Biden to fundamentally change the US and The Fed trying to cope with the inflation reaction. With Covid and then Biden’s selection as President, Federal outlays exploded (blue line) and remain elevated under Biden. To help finance the (outrageous) spending The Federal Reserve massively increased the M2 Money supply (green line). Now, The Fed has withdrawn some of the excessive monetary stimulus, but there is a staggering amount monetary stimulus still swimming around the economy like a Great White Shark.
The problem with Federal policies (energy, government spending, government debt) is that there are unpredictable factors that undo the best laid plans of mice and men. And rats such as crop blights and changes in consumer habits.
A good example is the Strategic Petroleum Reserve, which can be drained if craven politicians want to manage oil and gasoline prices for political purposes. Unfortunately, the promise of replenishment is made difficult by rising crude oil prices. The Biden admin cancels plan to refill emergency oil reserve amid high prices (some caused by factors such as war, often caused by government).
In fact, spot crude is up 73% under Biden. Partly, because of Biden’s promised war on fossil fuels and international disasters like war, blights, etc. This is why I cringe when I hear politicians and “economists” discuss why inflation will fall.
On the food side, we have cocoa prices rising 136% under Biden. Again, not predictable when policies were being made. Combine crop blights were rising transportation costs and DC, we have a problem! But this is one reason why The Fed, etc, focus on core inflation (excluding energy and food prices).
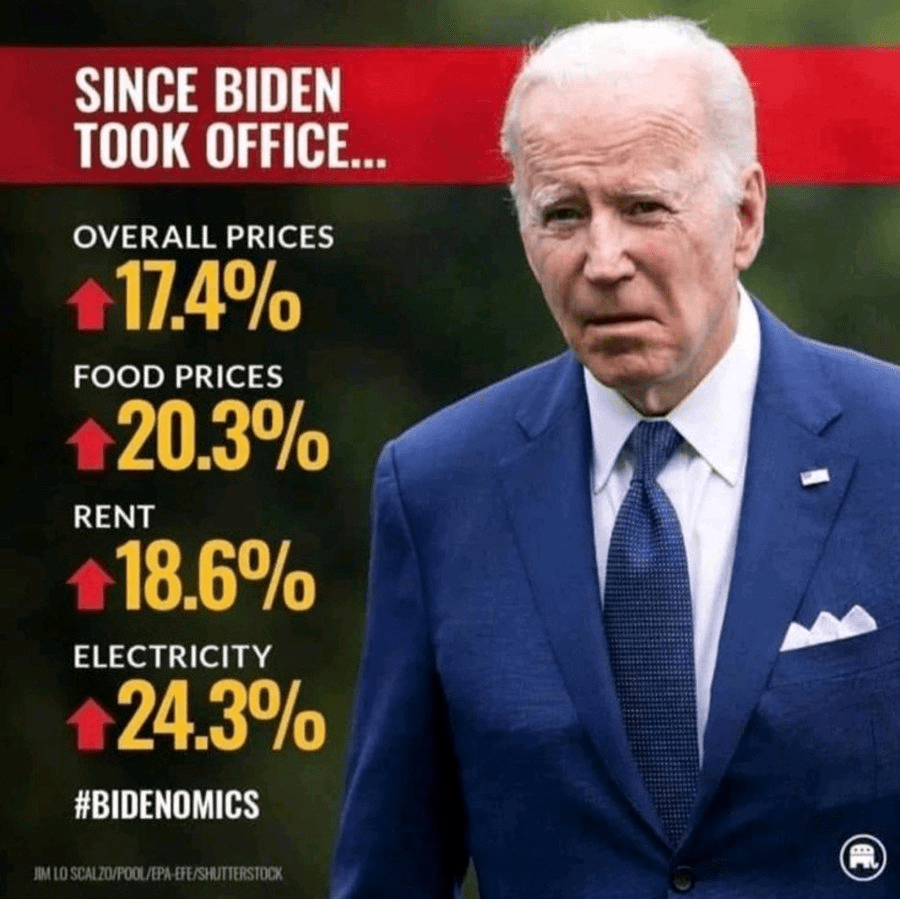
There are many examples of rising prices and how they hurt consumers, particularly middle-class and low wage workers.
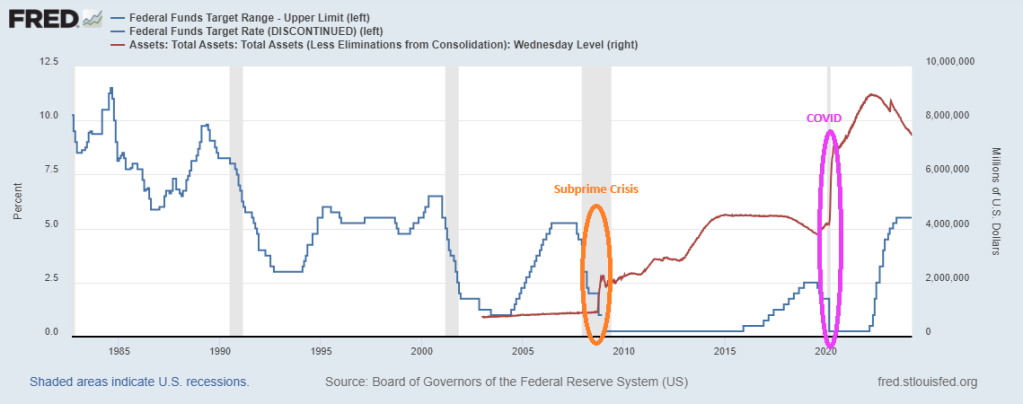
How did The Federal Reserve react to the inflation Biden helped create? They raised The Fed Funds Target Rate (Upper Bound) by 2,100% to combat Bidenflation. Freddie Mac’s 30-year mortgage rate is up 156% helping to crush homeownership aspiration for younger households.
And then we have Congress/Biden shoveling more than $10 billion in subsidies to Intel, even though Intel has an incentive to develop chips using borrowed funds and Intel retained earnings. But why put your shareholders at risk in case the chip gamble doesn’t payoff. Just shift the risk to US taxpayers!
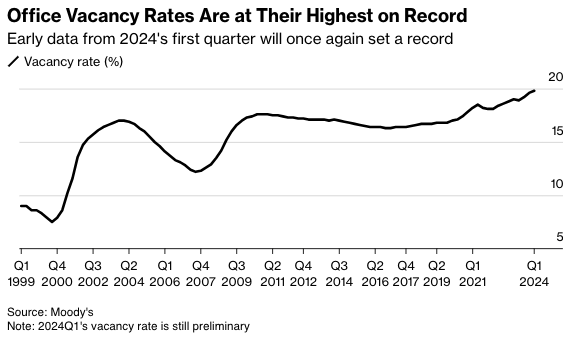
The rising supply of office space is due to a combination of surging remote and hybrid work that forces companies to reduce corporate footprints. Also, companies are exiting imploding progressive cities and high-taxed blue states for red ones while downsizing space. In the report, office tower vacancies rose to a record 19.8%, up from 19.6% in the fourth quarter of 2023.
Even with the increase, there is an eerily calm across the commercial real estate sector. This comes as the Federal Reserve’s interest rate hiking cycle is higher for longer, indicating that the pain train is nearing (perhaps after the presidential election).
“The office stress isn’t quite done yet,” Thomas LaSalvia, Moody’s head of commercial real estate economics and one of the authors of the report, told Bloomberg in an interview. He noted recent positive economic indicators stave off a “perfect storm in the office sector.”
“There are spots of light and there are spots of extreme darkness,” LaSalvia said, adding, “This is part of a longer-term evolution where we are seeing obsolete buildings in obsolete neighborhoods.”
The high office vacancy rate continues to be terrible news for landlords and developers eager to fill their buildings, and the Fed’s hiking cycle has made refinancing very challenging.
Viswanathan said there have been no major fireworks in CRE tower debt because the debt is being “extended and modified rather than refinanced,” which “mitigates a default wave and a sharp pick-up in losses on CRE loan portfolios.”
Yes, both residential and commercial real estate are thunderstruck under Bidenomics.
Mortgage applications decreased 0.6 percent from one week earlier, according to data from the Mortgage Bankers Association’s (MBA) Weekly Mortgage Applications Survey for the week ending March 29, 2024.
The Market Composite Index, a measure of mortgage loan application volume, decreased 0.6 percent on a seasonally adjusted basis from one week earlier. On an unadjusted basis, the Index decreased 0.1 percent compared with the previous week. The seasonally adjusted Purchase Index decreased 0.1 percent from one week earlier. The unadjusted Purchase Index increased 1 percent compared with the previous week and was 13 percent lower than the same week one year ago.
The Refinance Index decreased 2 percent from the previous week and was 5 percent lower than the same week one year ago.
What a mess! With M2 Money up 8.4% under Biden (green line), home prices are up a staggering 39.2% under Sheriff Joe and his deputy Fed chair Jerome Powell.
And conforming mortgage rates (30Y) are up 148% under Biden’s Reign of Error.
Thanks O’Biden! Although Biden is the figurehead, Obama and his team are still running The White House. Regardess of whether it is Biden or Obama (or Soros/World Economic Forum) calling the shots, the US housing market is on a highway to hell.
Bidenomics “helping” the middle class and low wage workers.
The staggering amount of Fed money printing combined with insane, reckless spending by The Federal government (hereafter called The Feral Government) has caused massive distortion in the US economy.
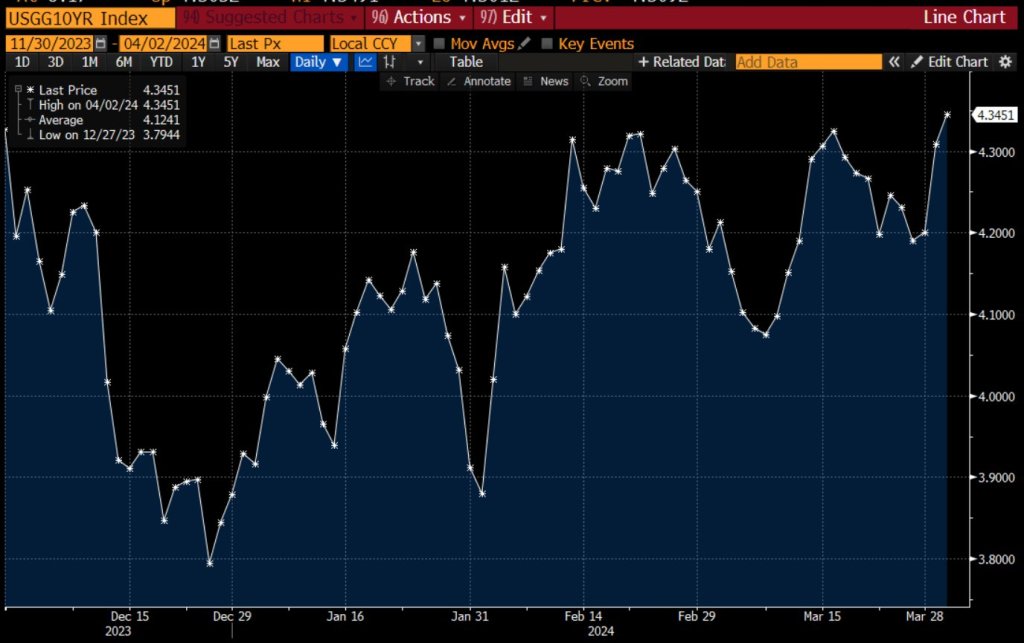
Second, the US Treasury 10-year yield is up tp 4.35%, the highest in 2024.
Third, with the 10-year Treasury rising towards 5%, watch for the 30-year mortgage rate to rise AGAIN making housing even more unaffordable. Or as Robert Palmer almost sang, Simply Unaffordable. Today, the 30-year mortgage rate is 7.567%. Look for it to climb to over 8% very soon.
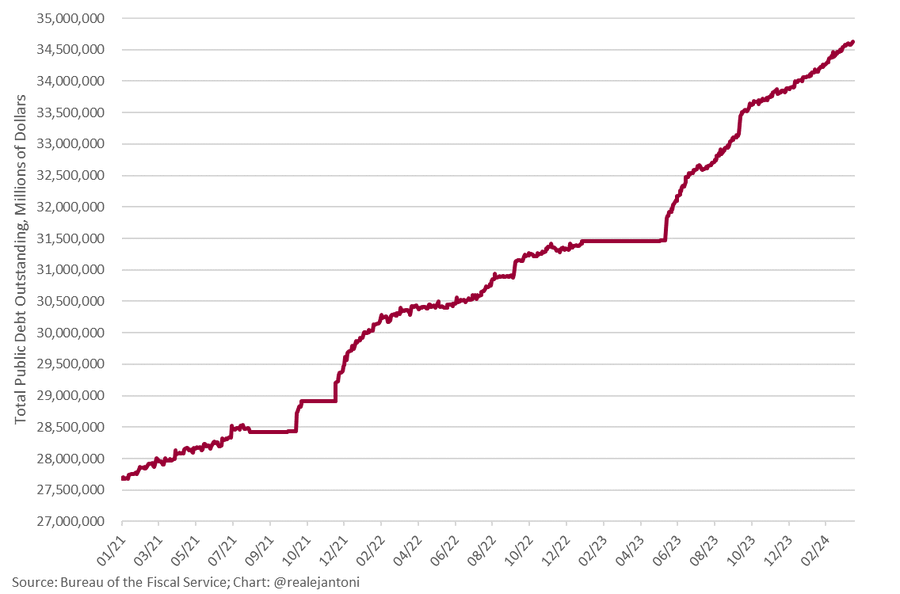
Fourth, BOOM: federal debt explodes $41 billion higher yesterday, breaching $34.6 trillion for first time ever; we’re on track to borrow $2.9 trillion this fiscal year – how long before the bond vigilantes have to remind everyone just how much power they have?


You must be logged in to post a comment.