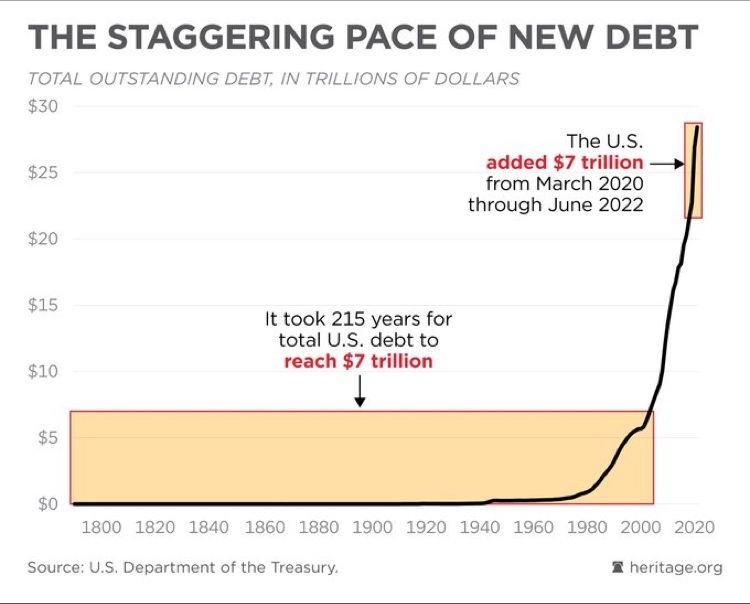
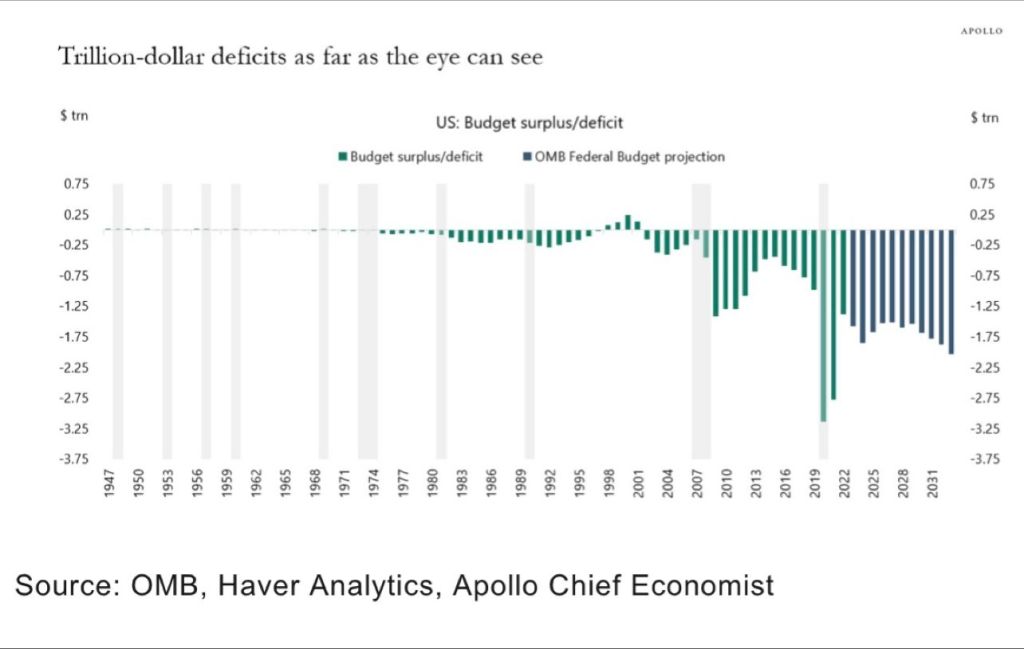
The Federal government added $7 trillion in debt since 2020 while it took 215 years to get to $7 trillion before Covid and Bidenomics.
In what can simply be called fiscal insanity, The Federal government is borrowing like there is no tomorrow (given that Biden is 81 years old, this isn’t far off) displacing businesses and households. Heaven help us if the Federal government has to borrow more money to fight a real war like World War II.
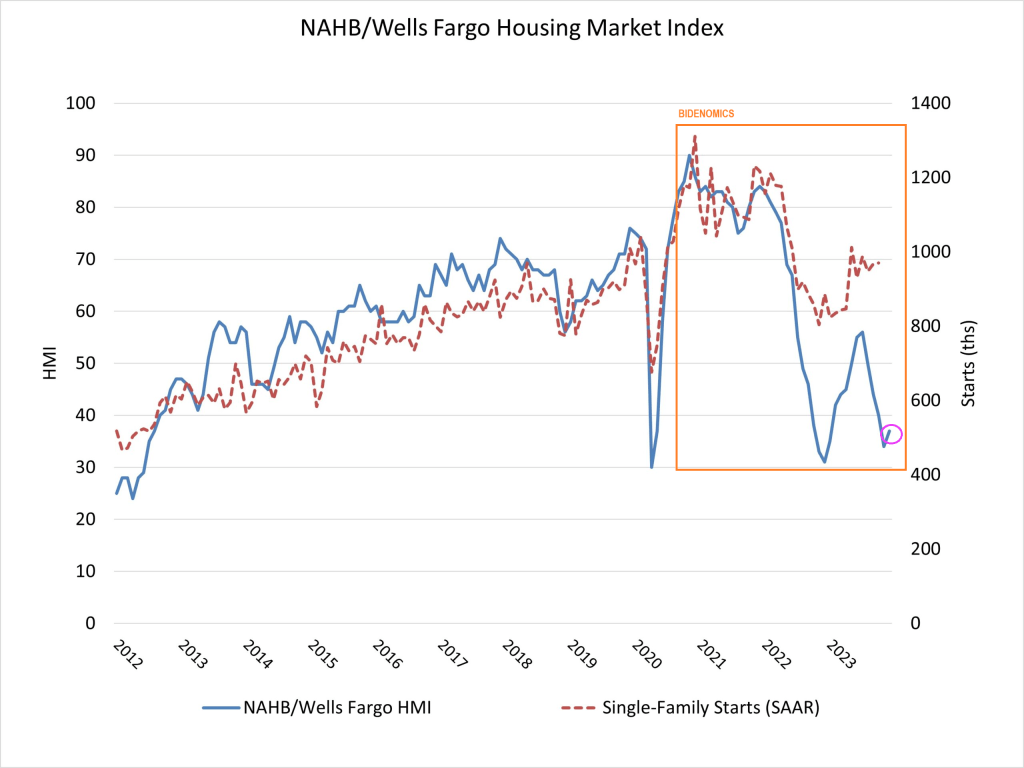
So, the massive Federal debt gorging isn’t helping the housing market.
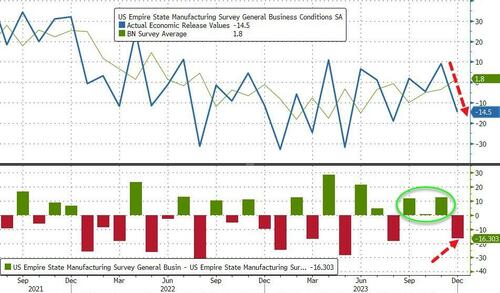
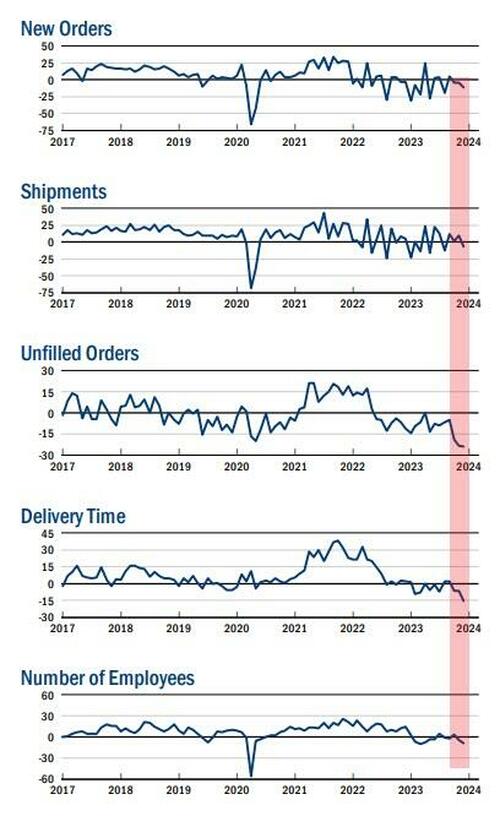
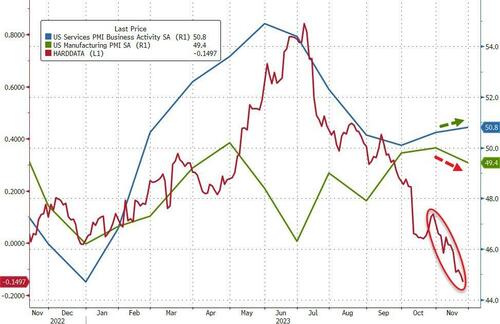
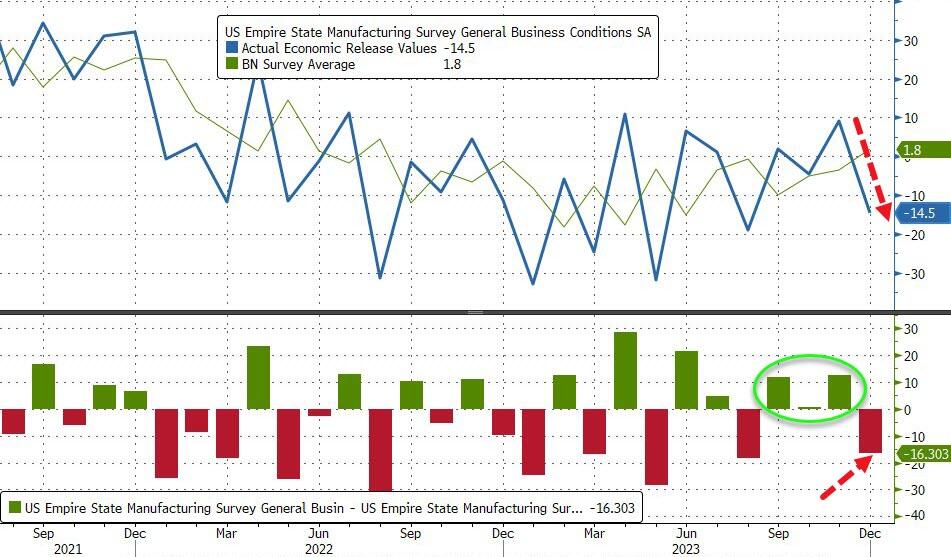
The drop takes the measure from ‘expansion’ at 7-month-highs to ‘contraction’ at 4-month-lows…
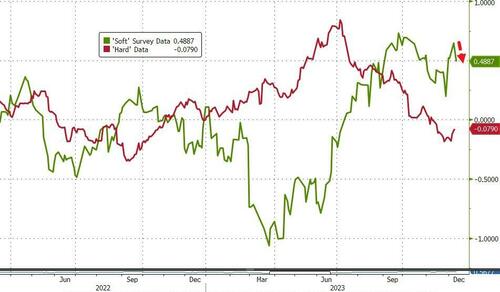
Source: Bloomberg
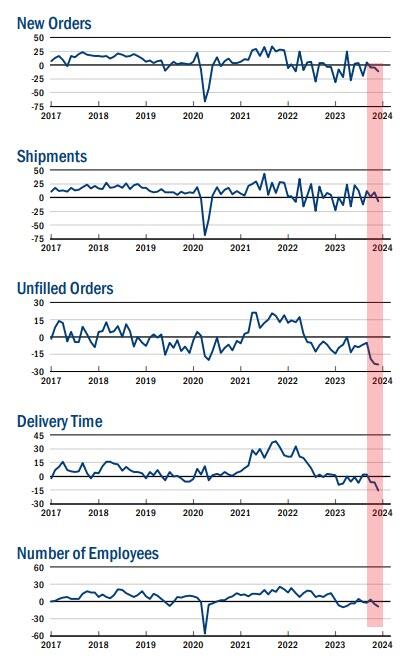
The new orders fell six points to -11.3, pointing to a decline in orders for a third consecutive month, and the shipments index fell sixteen points to -6.4, indicating that shipments fell.
The unfilled orders index held steady at -24.0, a sign that unfilled orders continued to fall significantly.
After rising into positive territory last month, the inventories index retreated fourteen points to -5.2, suggesting that inventories moved lower.
The delivery times index dropped ten points to -15.6, its lowest reading in several years, a sign that delivery times shortened.
The index for number of employees fell four points to -8.4, its lowest level in several months, pointing to a modest decline in employment levels.
On the bright side, the prices paid index moved down six points to 16.7, suggesting an ongoing moderation in input price increases, while the prices received index held steady at 11.5, a sign that selling price increases remained modest.
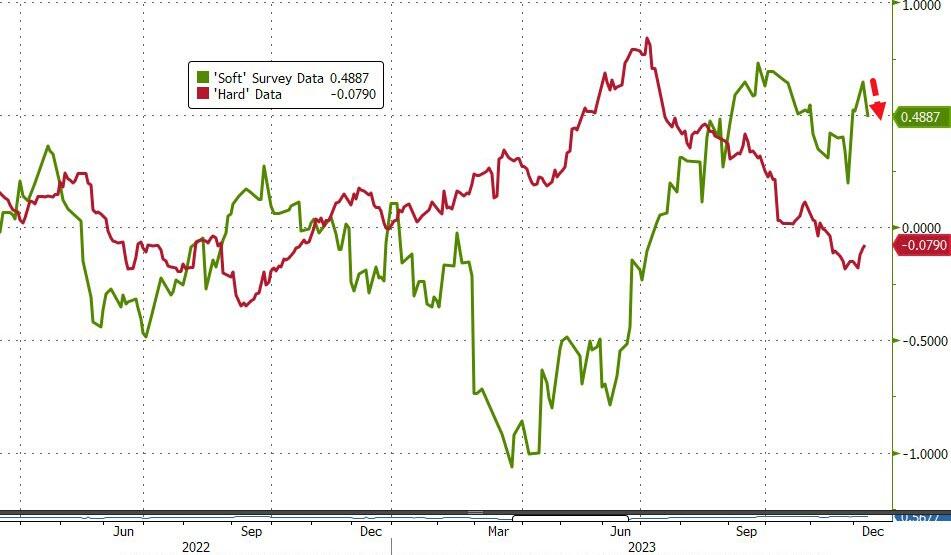
Is this the start of ‘soft’ data’s reversion to ‘hard’ reality?
The Fed – with its six rate-cuts – better hope so.
Traders and investors must spend precious time deciphering them. For those who wouldn’t mind a break from this parlor game, there are some markets that don’t march to the beat of the global policy cycle, and offer diversification benefits for portfolios.
The game was in full flow at Wednesday’s Federal Reserve meeting, as the central bank patiently unpicked the higher-for-longer stitching it had spent many months carefully inculcating in the market.
Anyone who had listened to it on financial conditions, keeping rates restrictive for an extended period, or who thought Powell meant it when he implied he was a Paul Volcker and not an Arthur Burns, is now left trying to figure out if the Fed’s reaction function has indeed changed.
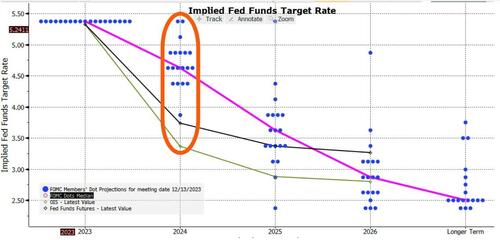
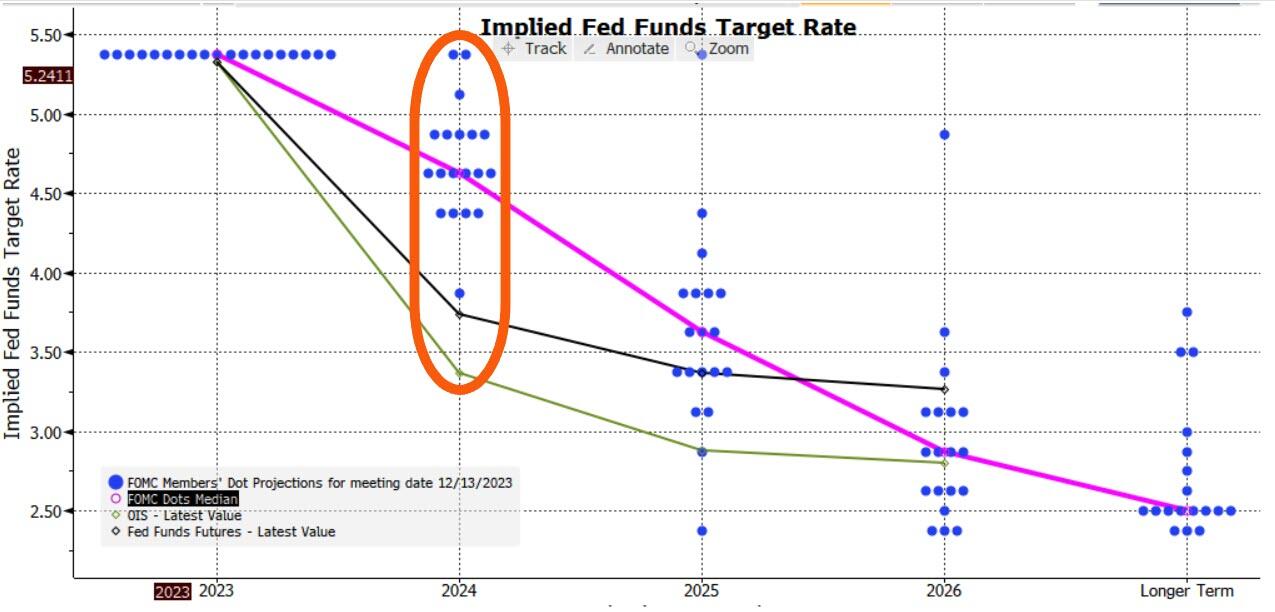
Adding confusion to the game are the dots. They reinforced the dovish message, with the median dot implying three cuts next year versus two back in September.
But with one dot implying six cuts, two implying none and the rest all spread in between, this isn’t exactly sure-footed clarity.
It’ll be repeated again today with the ECB, BOE, the SNB and the Norges Bank all meeting to set rates (the SNB held rates steady and the Norges unexpectedly hiked). For those who can trade only G7 markets, there is not much choice but to play the game.
However, for those looking for markets less reliant on the Delphic utterances of central bankers, there are other options.
The problem is that most bond markets tend to be quite alike over the medium-to-longer term.
Interest rate cycles are typically quite synchronized (with the US the most influential), and capital can flow freely around most of the world.
To show the broad uniformity of bond markets we use a statistical tool called principal component analysis.
PCA is a way of making sense of large data sets. For instance, a retailer may have reams of data on how users use its website: how long they spend on it, which pages they visit, where they hover their mouse, etc. PCA will tell you which input – or combination of inputs – has the greatest explanatory power in determining the total time users spend on the website (something they would want to maximize).
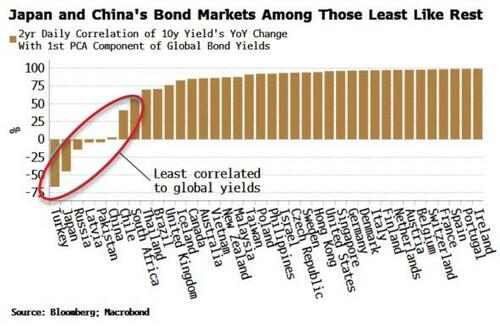
Using PCA on yields from 40 countries, we can show that over half of global bond market moves are described by just one factor.
This not a trivial result. It means we could replace our data on 40 bond markets by this one component and it would capture more than half of the variance of the individual yields.
A bond market that was similar to this component would therefore be a good proxy for the global bond market. However, as the mathematician Carl Jacobi advised, we should always invert. A more interesting question is: which bond markets look least like this factor?
The chart below shows how each of the 40 bond markets are correlated to the first PCA factor. Most have a high correlation – more than 75% – but what stands out is the handful of markets with a low or negative correlation.
Japan and Turkey are among those with a negative correlation, while China’s correlation is close to zero.
This is intuitive.
Japan has been running a deliberately counter-cyclical monetary policy, while Turkey until recently was running a through-the-looking-glass one, cutting rates in the face of rampant inflation. And China’s economy is in deflation, at odds with every other major DM and EM country.
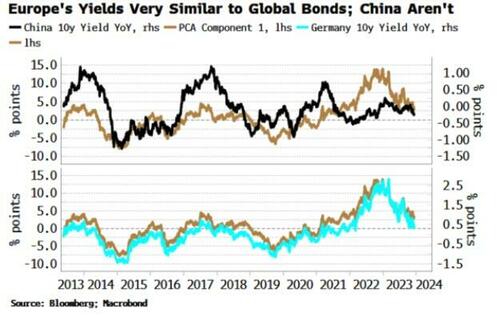
The above analysis provides analytical backing for the intuition that Japan et al have provided diversification for global bond portfolios in recent years, while most other markets, e.g. Europe, the US, Australia, New Zealand, etc are low-resolution facsimiles of each other and therefore have delivered few diversification benefits.
Of course, there will be other things to consider before adding a country’s bond index to a portfolio, such as how overbought or oversold it is, how liquid it is, the expected stance of the central bank, and so on.
But if the correlations persist, such a market should produce a more resilient and lower-volatility bond portfolio.
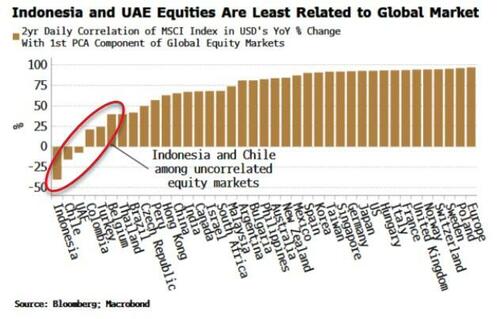
We can extend this analysis to look at stocks.
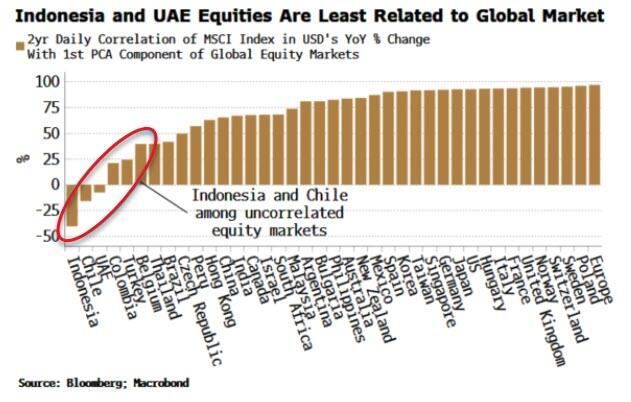
Global equity markets are even more similar to one another than bond markets, with the first component explaining 60% of the total move. Nonetheless, applying PCA offers up some portfolio diversification candidates (using as our data set MSCI country indices in USD).
Indeed, it can be shown that the first PCA component of equity markets is highly correlated to the US’s manufacturing ISM, elegantly demonstrating that in large part global stocks are driven by macro.
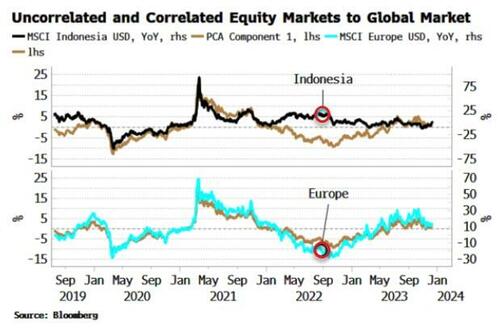
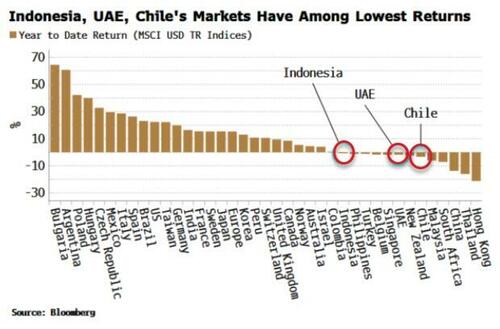
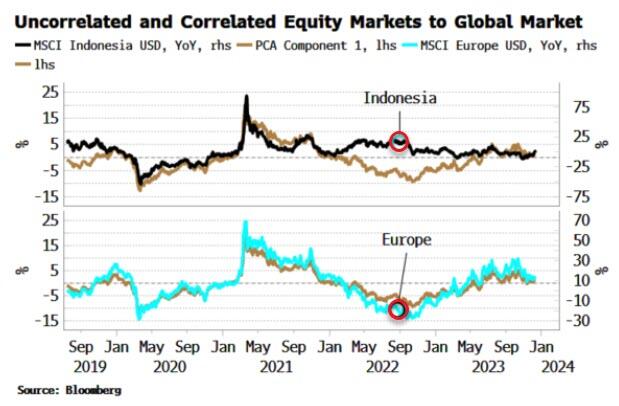
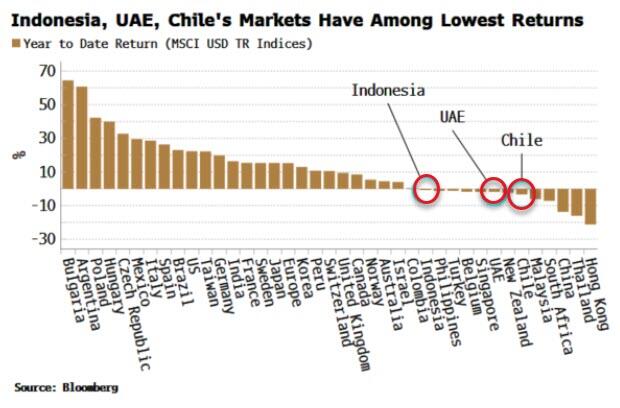
Indonesia, UAE and Chile’s stock markets are all negatively correlated to the global equity move, and therefore the global macro cycle, while European markets move almost in lockstep with it. As the chart below shows, Indonesia’s market (white line) remained supported in late 2022/23, as its market bottomed in July 2022 and rallied through, while other markets went on to make a new low in October of that year.
Indonesia et al also have had among the lowest returns of all global equity markets this year. It is relatively common for the markets that are among the worst performers one year to be the among the top the following year.
We can complete the analysis by looking at commodities.
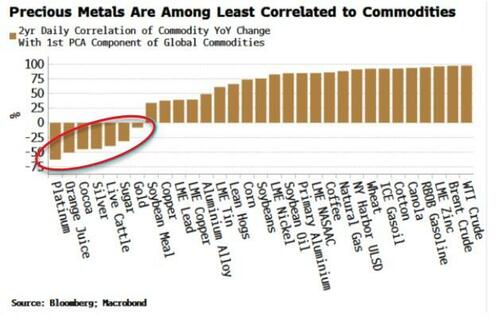
The first PCA component here explains about half the move of all commodities, a similar proportion to global bond markets. PCA shows that precious metals, such as gold, silver and platinum are the most negatively correlated to commodities.
As almost all commodities are traded in dollars, the first component is quite similar to the DXY.
So to some extent we are asking which commodities are most negatively correlated to the dollar. Precious metals typically exhibit a more negative dollar correlation than most other commodities. Further, in the current environment they should offer some protection against inflation.
The lack of variation among macro-driven markets makes portfolio investment challenging as it is easier to add risk rather than uncorrelated factors.
The above PCA analysis shows that Japanese bonds, Indonesian equities and platinum are examples of assets that may confer some diversification advantages for global portfolios.
At the very least, you may not have to pay as much attention to central bankers.
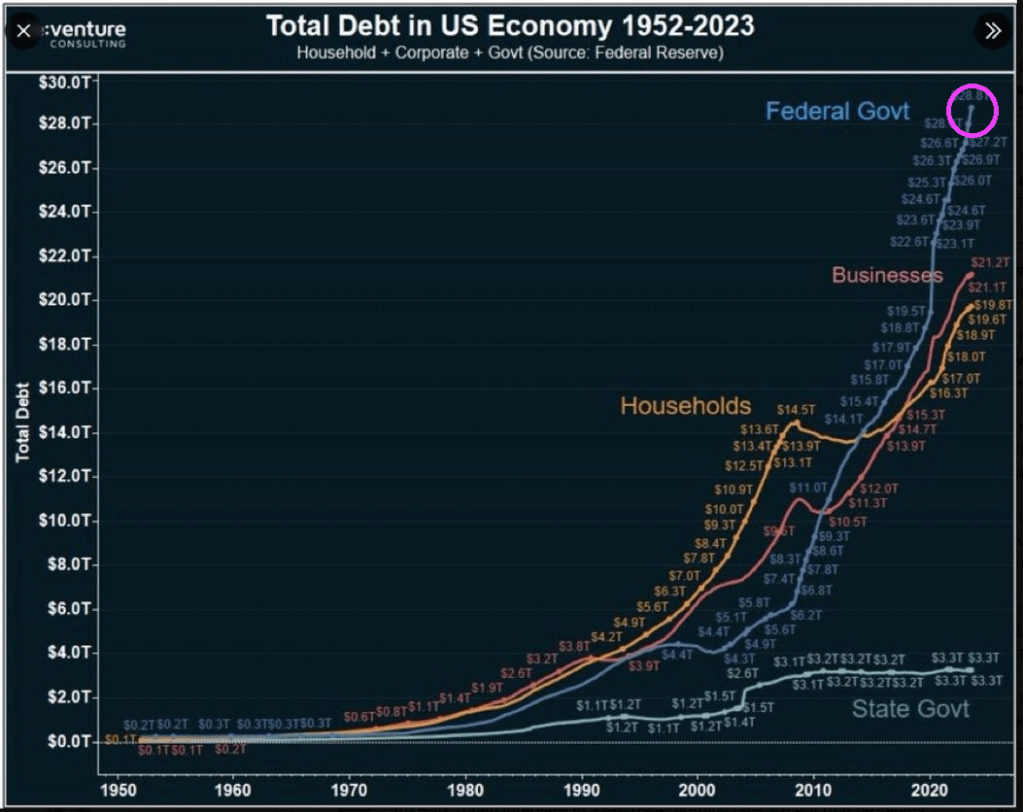
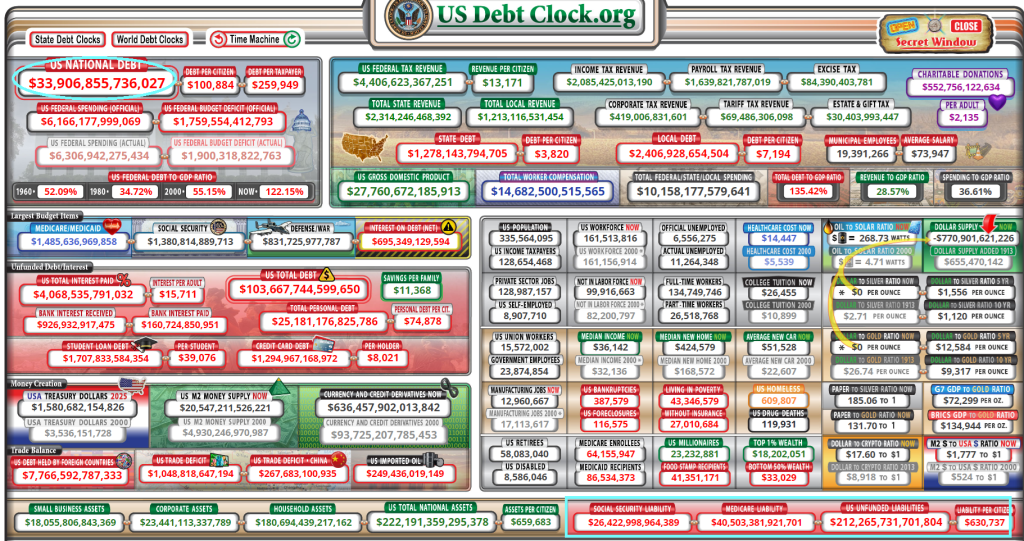
We are on a Highway To Hell! Massive Federal Budget deficits and staggering payments to Treasury from The Fed (losses on balance sheet) and $212 TRILLION in unfunded promises to the non-elites.
Under Modern Monetary Theory (or print money without consequences), we are seeing trillion dollars budget deficits with no end in sight. Nothing has been the same since the financial crisis of 2008 with The Fed’s massive intervention.
Then we have The Fed paying an ever growing amount to US Treasury for losses on their huge balance sheet.
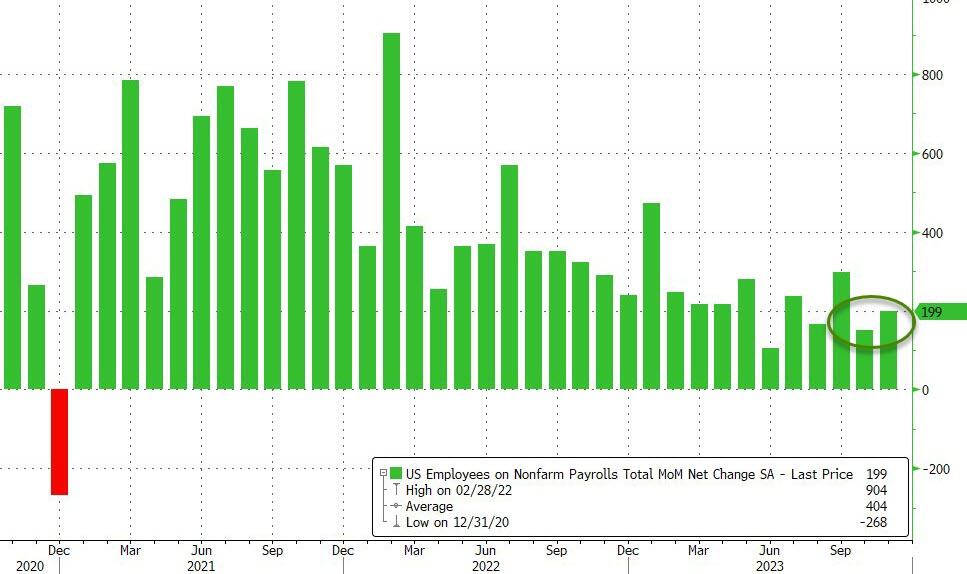
Several talking heads are salivating about the strong or solid jobs report in October. As if The Federal Reserve can’t read the jobs report. I call the report “Government gone wild!” since 51k government jobs were added in October.
Job gains occurred in health care, government, and social assistance. Employment declined in manufacturing due to strike actvity.
Total nonfarm payroll employment increased by 150,000 in October, below the average monthly gain of 258,000 over the prior 12 months. In October, job gains occurred in health care, government, and social assistance. Employment in manufacturing declined due to strike activity. (See table B-1.) Health care added 58,000 jobs in October, in line with the average monthly gain of 53,000 over the prior 12 months. Over the month, employment continued to trend up in ambulatory health care services (+32,000), hospitals (+18,000), and nursing and residential care facilities (+8,000). Employment in government increased by 51,000 in October and has returned to its pre-pandemic February 2020 level. Monthly job growth in government had averaged 50,000 in the prior 12 months. In October, employment continued to trend up in local government (+38,000). Social assistance added 19,000 jobs in October, compared with the average monthly gain of 23,000 over the prior 12 months. Over the month, employment continued to trend up in individual and family services (+14,000). In October, construction employment continued to trend up (+23,000), about in line with the average monthly gain of 18,000 over the prior 12 months. Employment continued to trend up over the month in specialty trade contractors (+14,000) and construction of buildings (+6,000). Employment in manufacturing decreased by 35,000 in October, reflecting a decline of 33,000 in motor vehicles and parts that was largely due to strike activity. In October, employment in leisure and hospitality changed little (+19,000). The industry had added an average of 52,000 jobs per month over the prior 12 months. Employment in professional and business services was little changed in October (+15,000) and has shown little net change since May.
Speaking of Govzilla, my favorite quote showing the stupidity of BIG government is … Biden’s climate envoy John Kerry. “We’ve got to cut down on farming due to ‘Climate Change’…or people are going to starve…”
While the exciting headline is “Mortgage Purchase Demand rises 35%!” bear in mind that the level of mortgage purchase demand is still relatively low. This is volatility in mortgage applications.
Mortgage applications increased 2.8 percent from one week earlier, according to data from the Mortgage Bankers Association’s (MBA) Weekly Mortgage Applications Survey for the week ending December 1, 2023. Last week’s results include an adjustment for the observance of the Thanksgiving holiday.
The Market Composite Index, a measure of mortgage loan application volume, increased 2.8 percent on a seasonally adjusted basis from one week earlier. On an unadjusted basis, the Index increased 43 percent compared with the previous week. The seasonally adjusted Purchase Index decreased 0.3 percent from one week earlier. The unadjusted Purchase Index increased 35 percent compared with the previous week and was 17 percent lower than the same week one year ago.
The Refinance Index increased 14 percent from the previous week and was 10 percent higher than the same week one year ago. Mortgage rates declined last week, with the 30-year fixed-rate mortgage falling to 7.17 percent – the lowest level since August 2023.
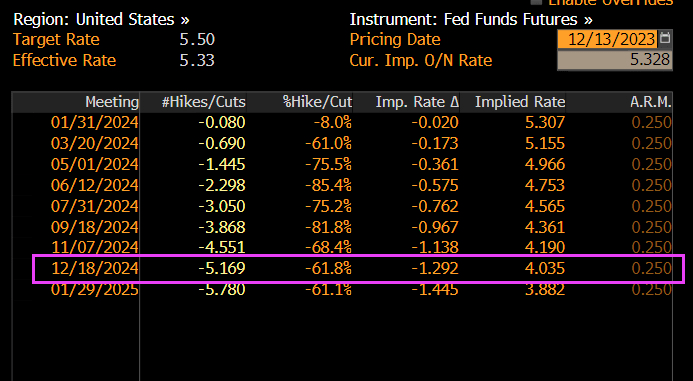
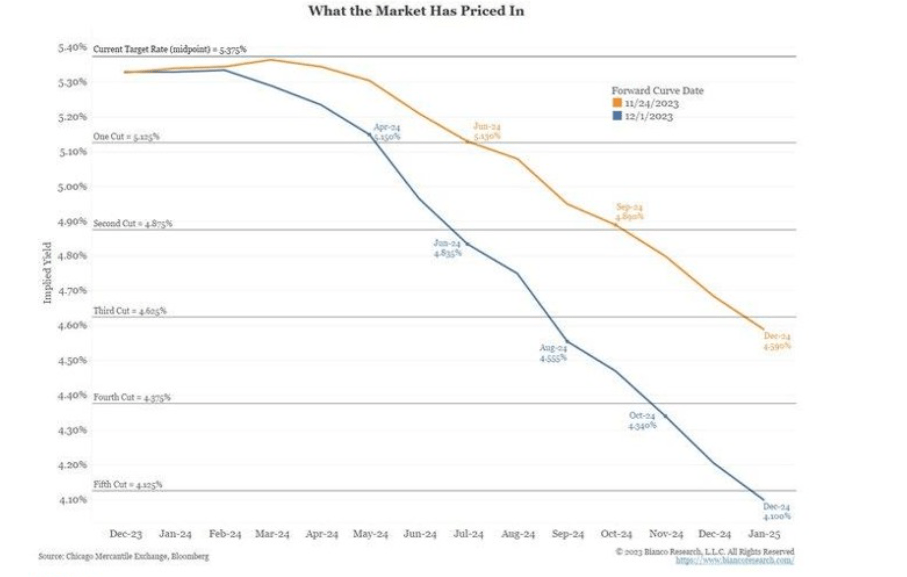
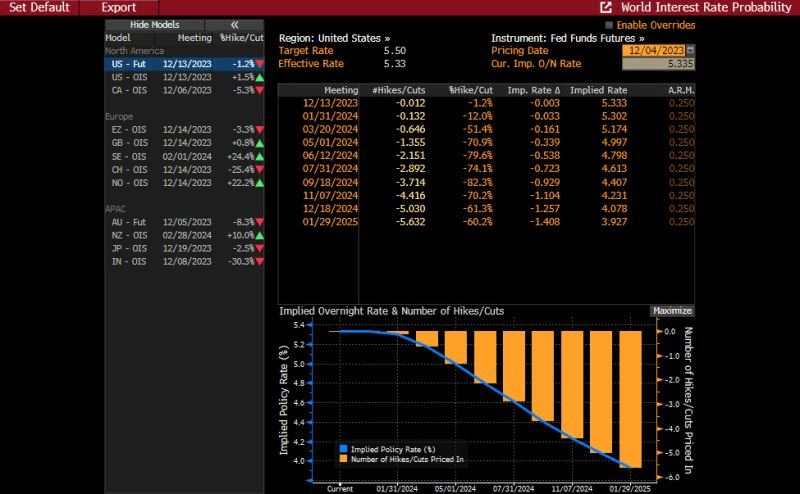
And with 5 rate cuts priced in, we should see mortgage demand increasing in 2024.
On the hotness front, here are the 10 smokin’ housing markets. Strange that the hotness score is highest for generally depressed economic cities like Manchester NH, Rochester NY and Rockford IL. Hey, at least Columbus Ohio made the top 10 on the hotness list!
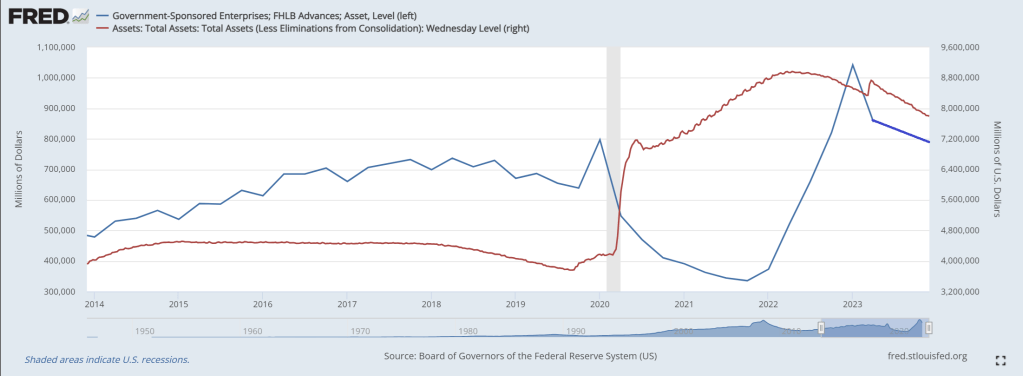
The Federal Home Loan Bank System (comprised of Federal Home Loan Banks or FLUBs) are a major source of American home loans and liquidity … at least until now.
According to a recently released report, the Federal Housing Finance Agency (FHFA) plans to propose rules that would curtail US banks’ borrowings from the Federal Home Loan Banks (FHLBs) to ensure they are not used as a “lender of last resort.” The announcement comes after the liquidity crunch in March spurred several banks to tap into the FHLB system, sending FHLB advances to a three-year high in the first quarter. During that quarter, when two large regional banks failed, FHLB advances totaled $804.39 billion, comprising 3.7% of banks’ total liabilities.
While totals have fallen since then, sitting at $602.62 billion, or 2.8% of total liabilities, in the third quarter, the FHFA is still seeking to impose limitations. Should the agency enact the new rules, banks’ liquidity options would be hindered. The FHFA wants Federal Reserve facilities to be used instead, but banks are reluctant to tap those because of the stigma attached to those sources, industry experts said.
“It is fair to argue that some banks have come to rely on FHLB funding as a crutch, and the ramp in lending to struggling banks during the mini-crisis in March is an area of continued debate,” Isaac Boltansky and Isabel Bandoroff of BTIG LLC wrote in a Nov. 11 note. “With that being said, there is still a clear stigma associated with tapping the Fed’s Discount Window and other facilities, which should be part of the conversation if the FHLB support will eventually be curtailed.”
Among the various rules the FHFA plans to propose is requiring that certain members have at least 10% of their assets in residential mortgage loans or equivalent mission assets, including assets that qualify as Community Financial Institution collateral, on an ongoing basis in order to stay eligible for FHLB financing.
The leading FLUB borrower? Columbus Ohio’s own JP Morgan Chase!
The problem is that bank credit growth has been contracting for several weeks now. 18th straight week of negative credit growth.
As FLUB advances decline with Fed balance sheet shrinkage.
Joe Biden has a new name: the crypt keeper. As in the person through his economic screw-ups is causing a massive inflow to cryptos.
Anticipation of an eventual US spot Bitcoin ETF – which Bloomberg’s analysts assign a 90% probability of being approved by the SEC in January.
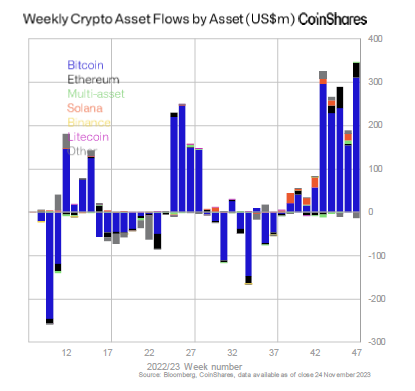
as well as surging prices, have helped to spur inflows into digital-asset investment products for a ninth consecutive week, the largest run since the crypto bull market in late 2021.
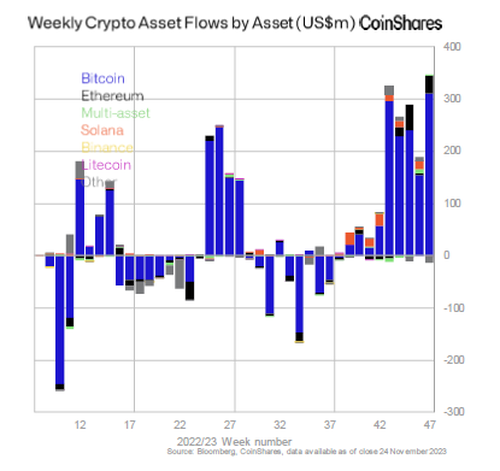
According to a recent report from CoinShares, these products which include trusts and exchange-traded products, saw inflows of $346 million last week, with Canada and Germany contributing to 87% of the total. Only $30 million came from the US, a sign of continued low participation from the country, the asset-management firm said. Of course, that will change as soon as investors start seeing double digit percentage weekly gains, and reallocating their money into crypto in droves, just like they did in 2020 and 2021.
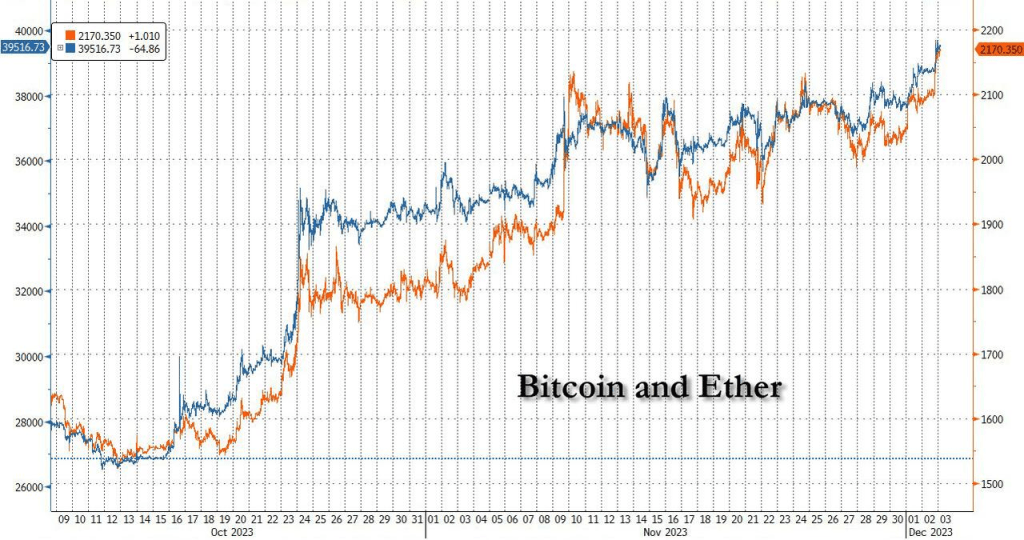
Since early October, the crypto market has surged as traditional asset managers like BlackRock prepared for spot Bitcoin ETFs, potentially bringing in many more investors into the asset and resulting in inflows of tens of billions in fresh capital.
“The combination of price rises and inflows have now pushed up total assets under management to $45.3 billion, the highest in over one and half years,” the report said.
Bitcoin products raked in $312 million last week, pushing inflows to over $1.5 billion since the start of the year. Ether products saw $34 million in inflows last week, almost negating outflows all of 2023.
Amid the surging inflows, and amid expectations for imminent ETF approval by the SEC and a surge in March rate cuts odds, bitcoin and ethereum have continued their furious ascent, with the former now trading just shy of $40.
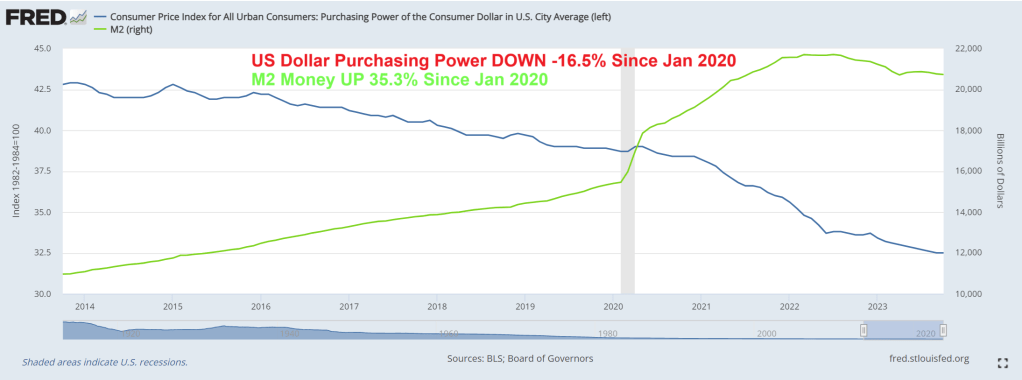
Since Covid and the idiotic government and school shutdowns of 2020, the purchasing power of the US Dollar has fallen -16.5% as M2 Money grew 35.3%. Keep on printing?
I suppose Biden’s biography can be called “Tales From The Crypt(o)”.
The Federal Reserve reminds me of The Stones’ song “Tumbling Dice.” Why? The Fed can’t tell if inflation is cooling or re-accelerating. Hence, they are just rolling dice.
Let’s start with mortgage rates, a critical component of the housing and CRE markets. Mortgage rates remain up 163% since 2021, not great for housing affordability. Despite recent small declines in the mortgage rate. The 10Y-2Y Treasury curve is also going deeper into reversion … again.
However, the data was more mixed with US Manufacturing falling more than expected to 49.4 – back into contraction – (vs 49.9 exp) from 50.0 in October. However, US Services unexpectedly rose from 50.6 to 50.8 (exp 50.3).
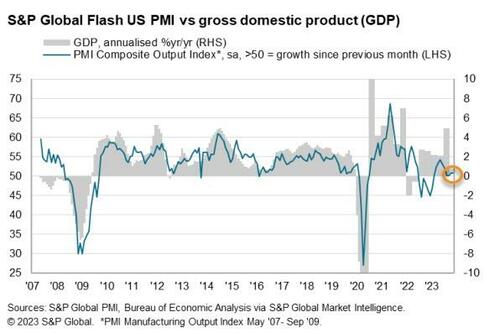
“The US private sector remained in expansionary territory in November, as firms signalled another marginal rise in business activity. Moreover, demand conditions – largely driven by the service sector – improved as new orders returned to growth for the first time in four months.
The upturn was historically subdued, however, amid challenges securing orders as customers remained concerned about global economic uncertainty, muted demand and high interest rates.
Businesses cut employment for the first time in almost three-and-a-half years in response to concerns about the outlook. Job shedding has spread beyond the manufacturing sector, as services firms signalled a renewed drop in staff in November as cost savings were sought.
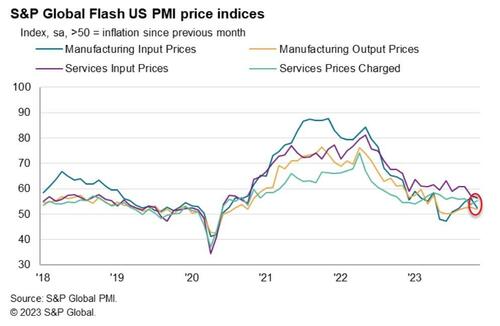
“On a more positive note, input price inflation softened again, with cost burdens rising at the slowest rate in over three years. The impact of hikes in oil prices appear to be dissipating in the manufacturing sector, where the rate of cost inflation slowed notably.
Although ticking up slightly, selling price inflation remained subdued relative to the average over the last three years and was consistent with a rate of increase close to the Fed’s 2% target.”
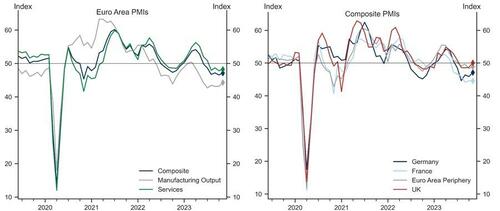
The US data comes after yesterday’s Euro area composite flash PMI increased by 0.6pt to 47.1, above consensus expectations, driven by a meaningful acceleration in Germany and the periphery, partially offset by a marginal decline in France. In the UK, the composite flash PMI improved meaningfully and entered expansionary territory at 50.1, above consensus expectations, on the back of a pickup in both sectors, with the services sector index entering positive territory at 50.5.
Goldman sees three main takeaways from today’s data.
First, we see a potential turning point in Euro area activity, with forward-looking indicators all improving in November, potentially setting a positive stage for the remainder of the year and the beginning of 2024. While the improvement seems to be broad-based, the upside surprises in the manufacturing sector in Germany and the Euro area as a whole may point to early signs of the sector’s revival.
Second, inflationary pressures, after moderating for some time, show signs of renewed intensification in the Euro area, as reflected by the output and input price components ticking up in November.
Third, UK growth momentum was meaningfully better than last month, and is picking up across the board, with the headline and services indices coming in above 50. This, however, is now accompanied by an increase in cost pressures, with both the input and output price indices edging up in November.
Finally, back to the US, S&P Global found that US business uncertainty was also heightened among US firms, as expectations regarding the year-ahead outlook slipped to the weakest since July.
A record 130.7 million people are expected to shop in stores and online in the U.S. on Black Friday this year, the National Retail Federation (NRF) estimates. The event is known for crowds lining up at big-box stores at dawn to scoop up discounted TVs and home appliances.
But at 6 a.m. on Friday at a Walmart in New Milford, Connecticut, the parking lot was only half full.
“It’s a lot quieter this year, a lot quieter,” said shopper Theresa Forsberg, who visits the same five stores with her family at dawn every Black Friday. She was at a nearby Kohl’s (KSS.N) store at 5 a.m.
Fifth Avenue, one of the world’s top shopping streets, is dead quiet on Black Friday — at least by New York’s boisterous standards.
The strip of high-end shops from brands like Louis Vuitton and Cartier has largely recovered since its pandemic lull, where vacancies had once reached nearly 30% in Midtown East. Some vestiges of that struggle remain, with a few empty storefronts covered up or filled with little art installations. Yet the street has managed to keep its title as the most expensive retail area on the planet by rent per square foot, according to Cushman & Wakefield.
Mortgage rates up 163% since 2021, manufacturing PMI in contraction and Black Friday shopping muted. Not good. The Fed is rolling the dice on what to do next.
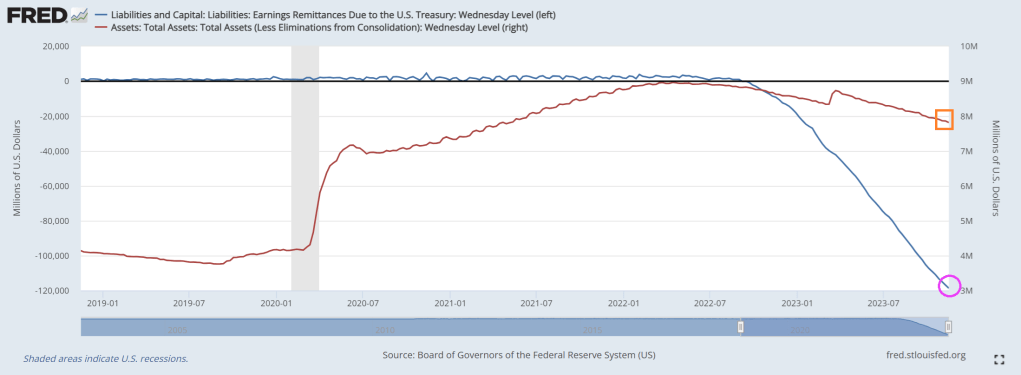
Biden’s terrible economic policies and horrid fiscal managment has put stress on The Federal Reserve. The Federal Reserve paid an estimated $76 billion to the Treasury in 2022 while banks’ willingness to lend has plummeted.
One of the key ways central banks absorb liquidity back out of the market is through reverse repo. These are short-term transactions where the Fed sells securities to banks and agrees to buy back at a higher price the next day.
This means banks are being paid to park cash with the Fed instead of injecting it into the economy through loans and fanning the fires of inflation.
That alone is costing the Fed $200M every single day.
In addition, the Fed is spending another $500M in daily interest payments on its reserve policy, i.e. balances that banks are holding in their reserve accounts at the Fed.
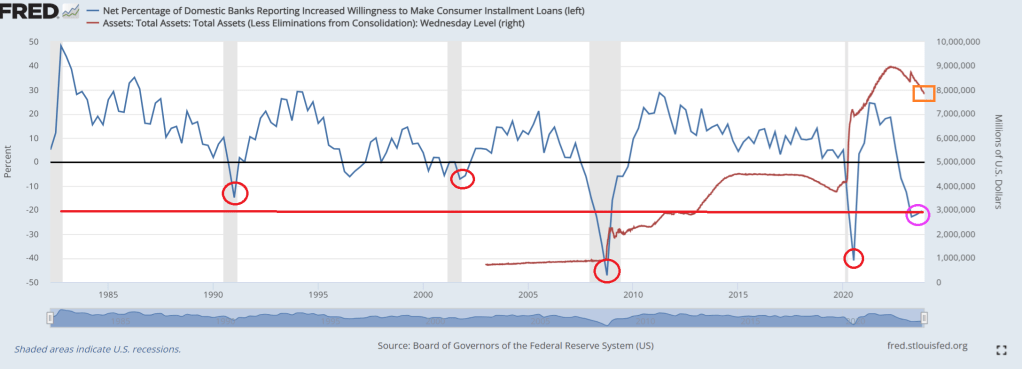
Banks’ willingness to lend has plummeted making credit availability increasingly tighter. Current levels have typically ended in recessions.This time is NOT different.
And on the energy side of the market, Biden Invokes ‘Wartime Powers’ to Attack Gas-Powered Furnaces. Of all the stupid things Biden has done, invoking wartime powers to make households use inefficent electric heat pumps instead of gas furnaces in stupid of two levels. First, invoking wartime powers for things unrelated to national defense is reckless and capricious. Second, electric heat pumps in the colder areas of the country is stupid as well. Electric heat pumps are inefficient, unless the goal of Biden and his Idiocracy is to “cull the herd” or kill off people during winter months (I had an electric heat pump in a condo I owned and it was terrible in winter months).
Yes, the Biden Administration and The Fed are economic mutilators!


You must be logged in to post a comment.