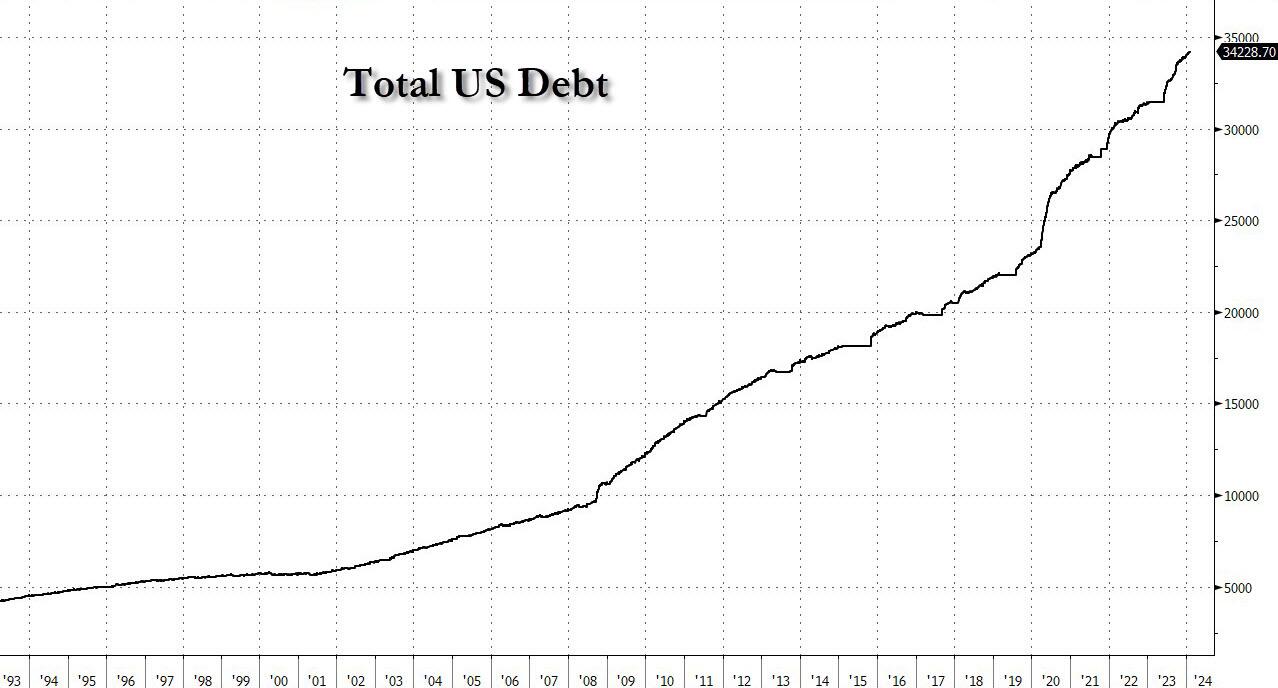
As Commander Cody sang, “We have too much debt.”
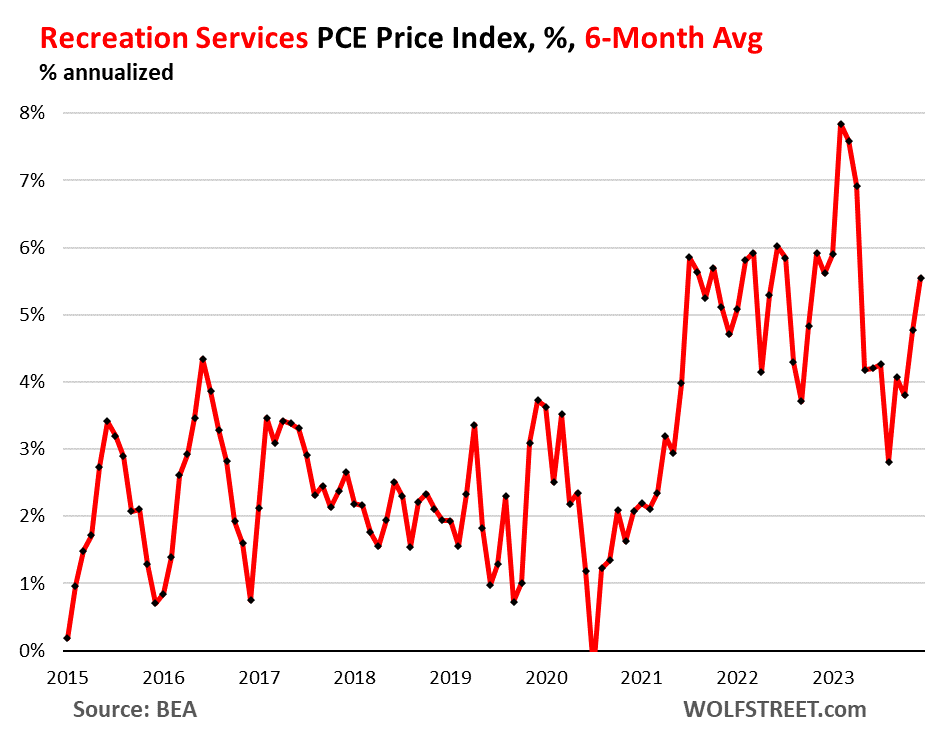
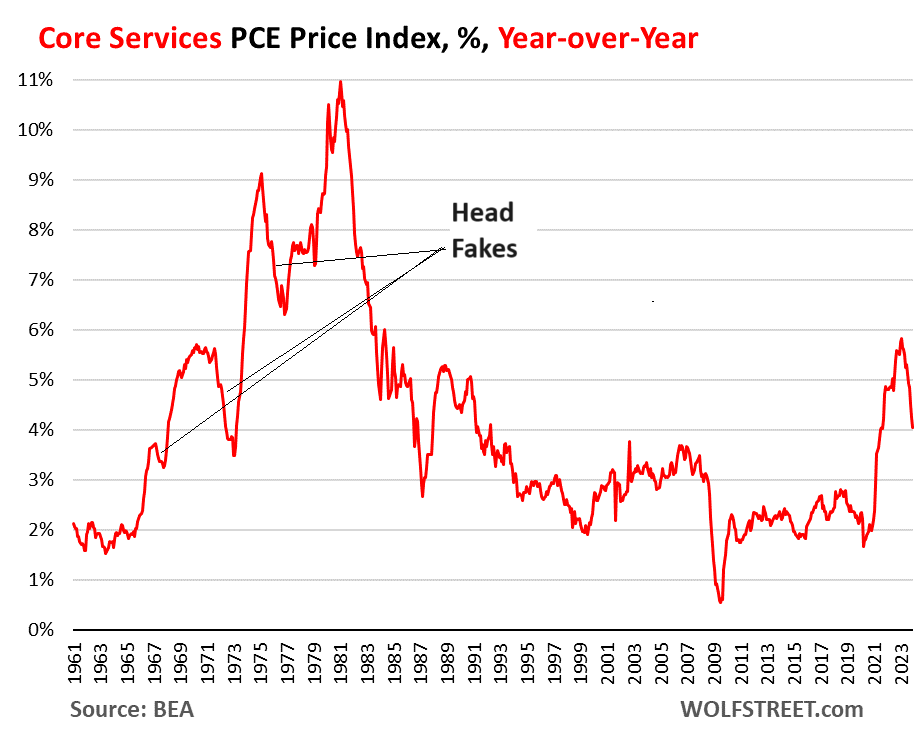
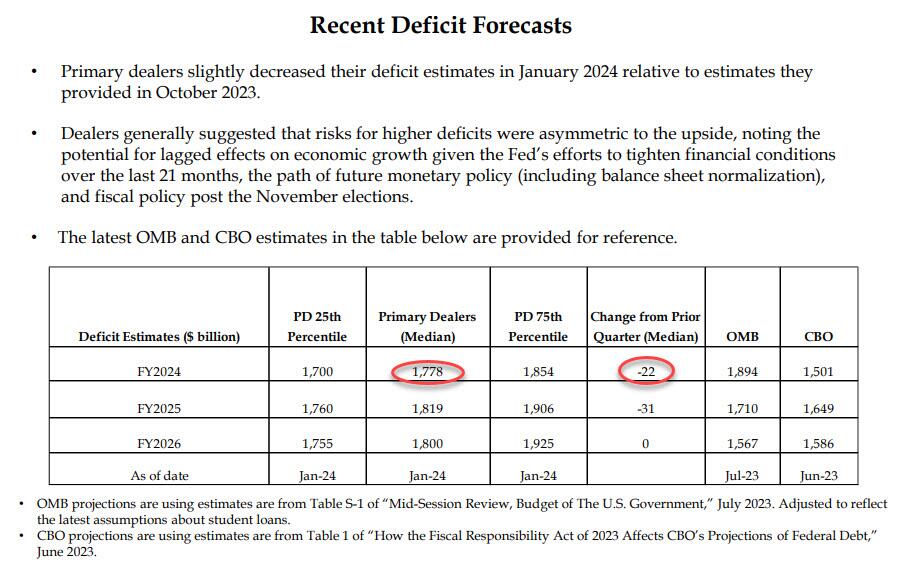
“The prices of some things will decline. Others will go up. But we don’t expect to see a decline in the overall price level,” said Federal Reserve Chair Jerome Powell, Nvidia stock hitting new highs, its market cap soaring to $1.78trln.
“That doesn’t tend to happen in economies, except in very negative circumstances. What you will see, though, is inflation coming down,” explained the Fed Chairman, the average American neither understanding nor caring about the nuance.
Bitcoin raced upward, its market cap roughly half of Nvidia. The market now values this remarkable maker of the semiconductor chips necessary to create an artificial life form at roughly twice the value of the most secure network in human history.
Fidelity added Bitcoin to a model portfolio, spurring investors to consider what happens to the price of a digital asset, whose supply is fixed at 21mm for all eternity, once passive investment products start really stacking Satoshis.
You see, the supply of everything in the universe expands as its price increases, but no matter how high the price of Bitcoin goes, its pre-defined pace of production will only ever decrease.
Nvidia (or any other stock) can be created at the click of a new issuance, or an executive equity option grant for that matter. The average investor neither understands this yet, nor cares for the nuance.
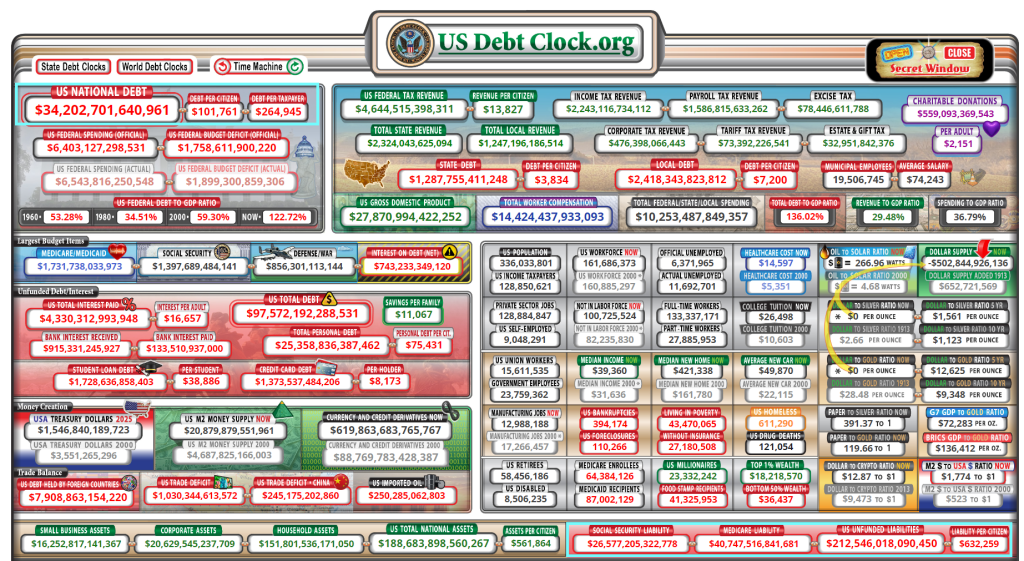
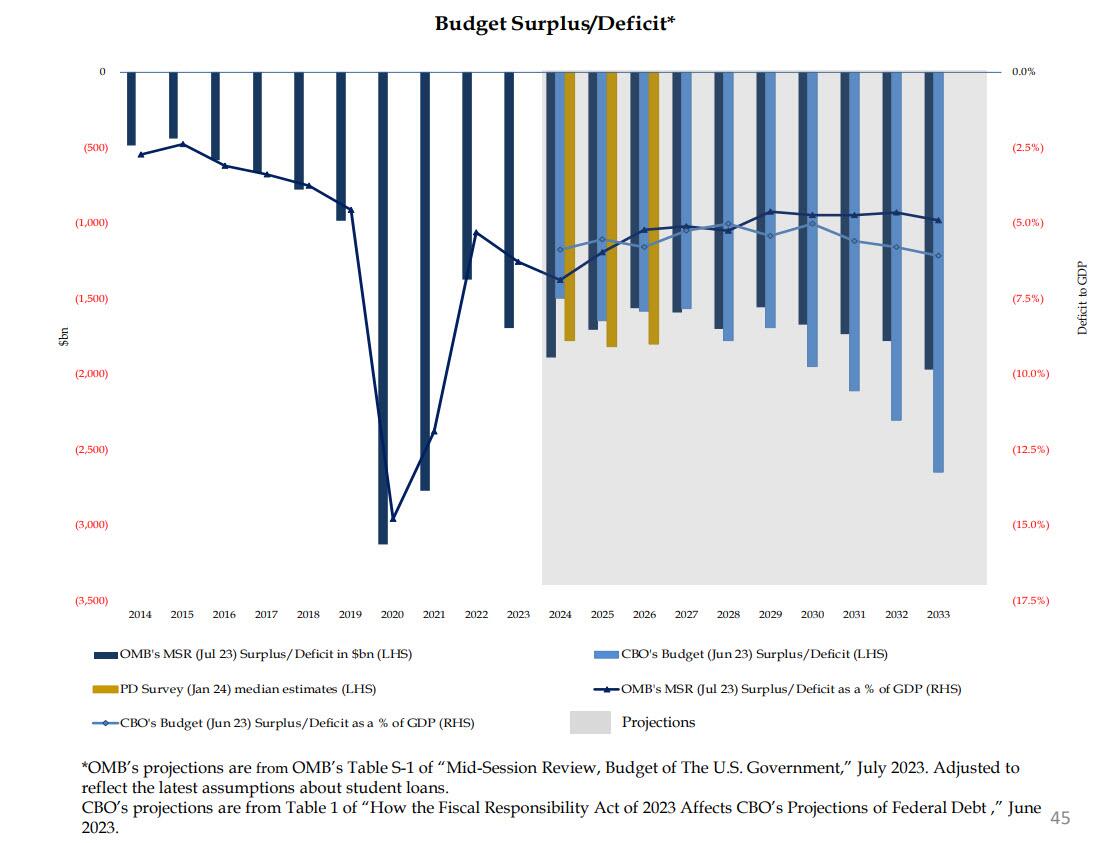
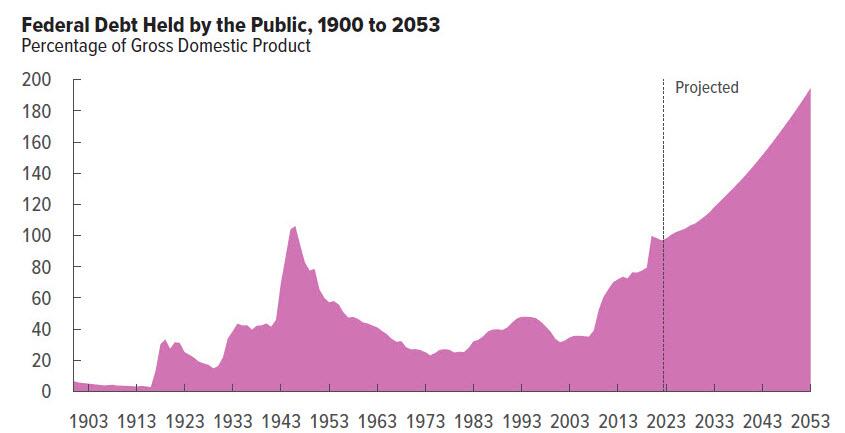
“I would say this. In the long run, the US federal government is on an unsustainable fiscal path,” said Powell, pointing out one of the most important top-down investment themes of the coming decade.
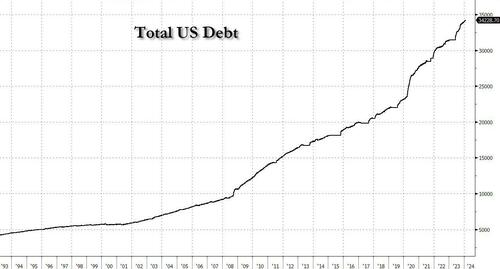
“And that just means that the debt is growing faster than the economy. So, it is unsustainable. I don’t think that’s at all controversial. And I think we know that we have to get back on a sustainable fiscal path. And I think you’re starting to hear now from people in the elected branches who can make that happen,” he added, without naming names, because there really aren’t any.
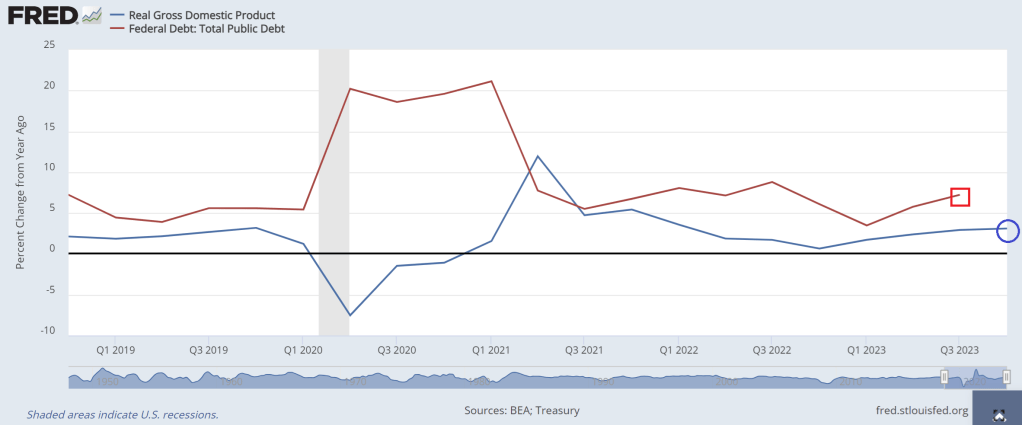
Under Brainless Joe and Dr. Janet Yellen, the US economy has experienced real GDP growth YoY only once (Q1 2021). Otherwise, debt growth YoY has always exceeded real GDP growth under Biden.
I admit I am rooting for the SF 49ers over the Kansas City Swifties. At least we won’t have to listen to Brainless Biden ramble on during the Super Bowl, unless they issue a pre-recorded propaganda piece for half time similar to the John Gill character from Star Trek.

Blank stares matter should be Biden’s new campaign slogan!


You must be logged in to post a comment.