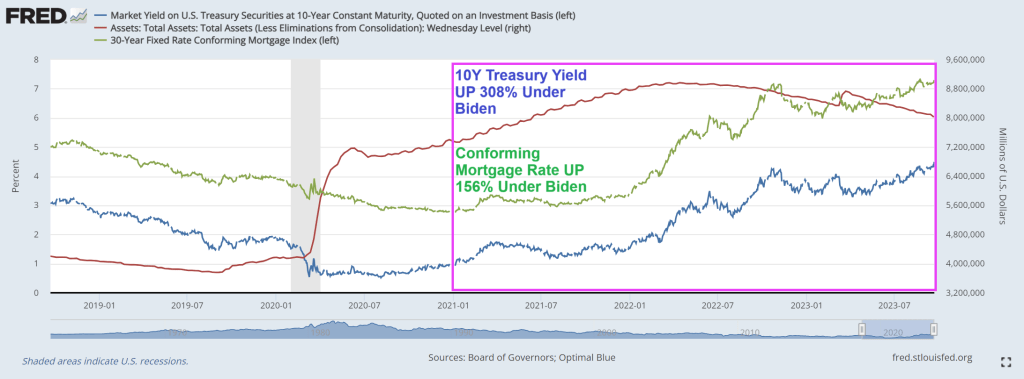
Alarm! US 10-year Treasury yields are soaring along with mortgage rates.
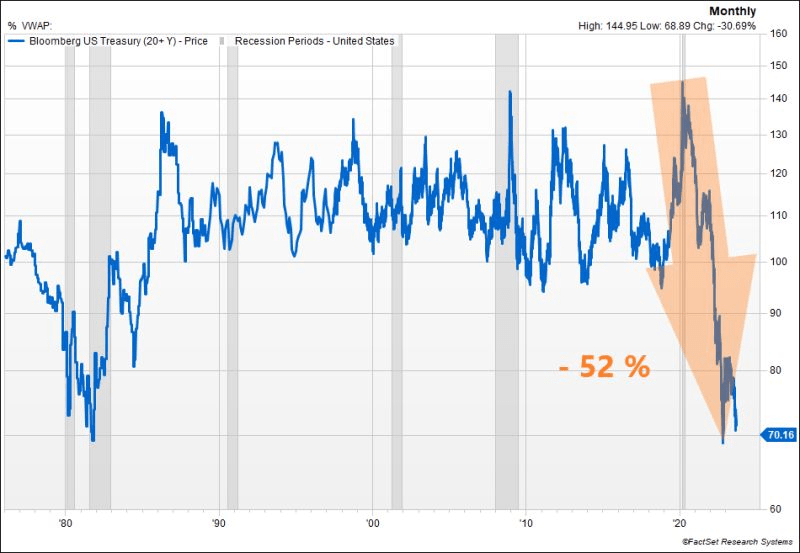
The US Treasury market is witnessing another significant selloff, pushing the 10y UST yield close to the 4.50% mark. The surge in real rates is remarkable, reaching 2.12% for the 10y, a level not seen since 08’. While this might appear attractive in real terms compared to historical benchmarks, could we be on the brink of a third consecutive year of negative performance for US Treasuries? To put this into perspective, such a scenario has never occurred in history.
The conforming mortgage rate is at 7.3%, up 156% under since Biden’s coronation as El Presidente of the United Banana Republics of America. Where political opponents are indicted prior to elections.
In Biden’s Banana Republic economy, the US Treasury 10y-2y yield curve remains inverted.
And then we have Mish’s chart on debt as a percentage of GDP from CBO. Remember, we used to worry about the US breaking the 80% debt to GDP level. It is now projected to be 181%. Wow.
Mortgage applications increased last week, despite the 30-year fixed rate edging back up to 7.31 percent – its highest level in four weeks.
Mortgage applications increased 5.4 percent from one week earlier, according to data from the Mortgage Bankers Association’s (MBA) Weekly Mortgage Applications Survey for the week ending September 15, 2023. Last week’s results included an adjustment for the Labor Day holiday.
The Market Composite Index, a measure of mortgage loan application volume, increased 5.4 percent on a seasonally adjusted basis from one week earlier. On an unadjusted basis, the Index increased 16 percent compared with the previous week. The Refinance Index increased 13 percent from the previous week and was 29 percent lower than the same week one year ago. The seasonally adjusted Purchase Index increased 2 percent from one week earlier. The unadjusted Purchase Index increased 12 percent compared with the previous week and was 26 percent lower than the same week one year ago.
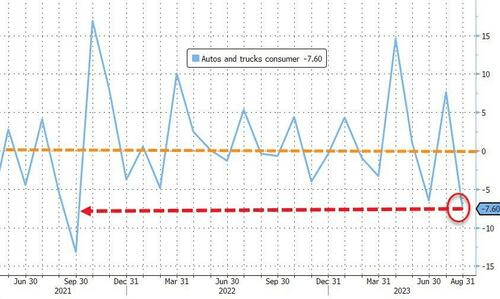
The Big Three auto companies and the UAW are suffering under Bidenomics (code for massive green energy payoffs to large donors). As I pointed out yesterday, the auto industry suffered a large decline of -7.60% in Q2 as a result of rising car prices (going electric is EXPENSIVE) and increasing consumer debt to cope with Bidenomics.
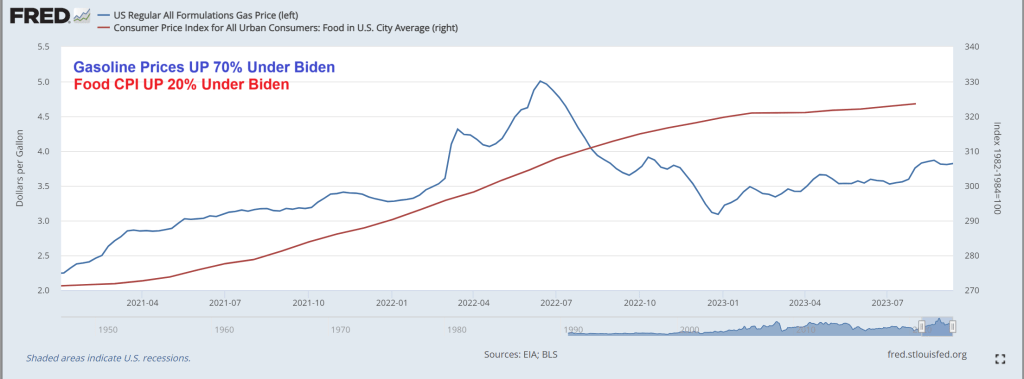
So when we consider the UAW’s demands of $20 an hour hike in pay, you have to consider that under “Union Joe” gasoline prices are up 70%, and food CPI is up 20%. So a 20% pay hike won’t even cover the cost of commuting and will just cover the increased food costs.
The shortened work week to 32 hours? How European of the the UAW.
But perhaps they will have the extra time to travel to Paris France to eat some beef au poivre at Le Bistrot Paul Bert.
Shape of things in the US economy. But a better tune to descible what is happening is over, under, sideways down.
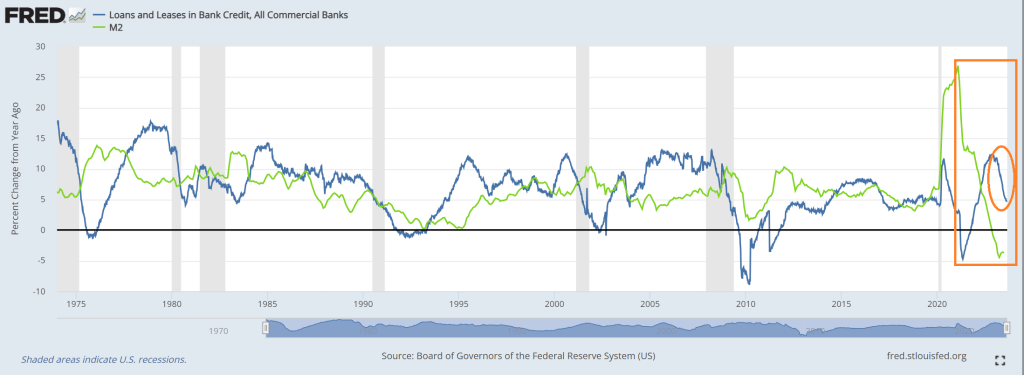
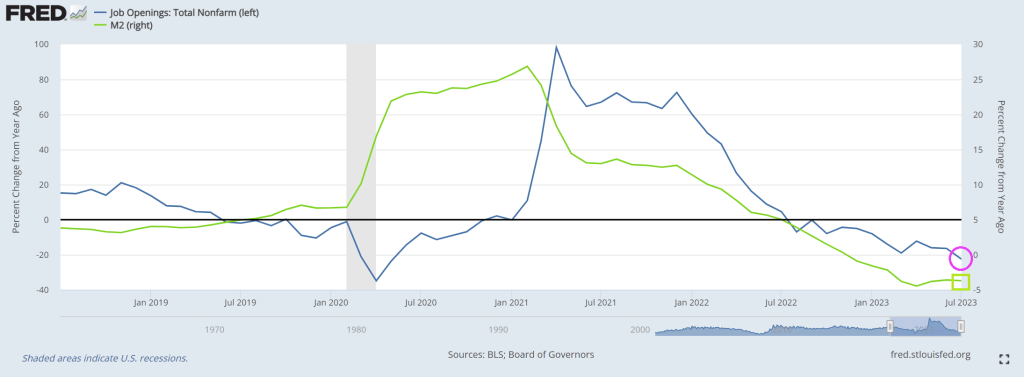
For example, look at this chart of loans and leases at commercial banks, since last year (YoY). The growth rate is plunging rapidly. Of course, M2 Money growth has already crashed.
Loan delinquenices? The trend in delinquencies is rising as consumers struggle with inflation.
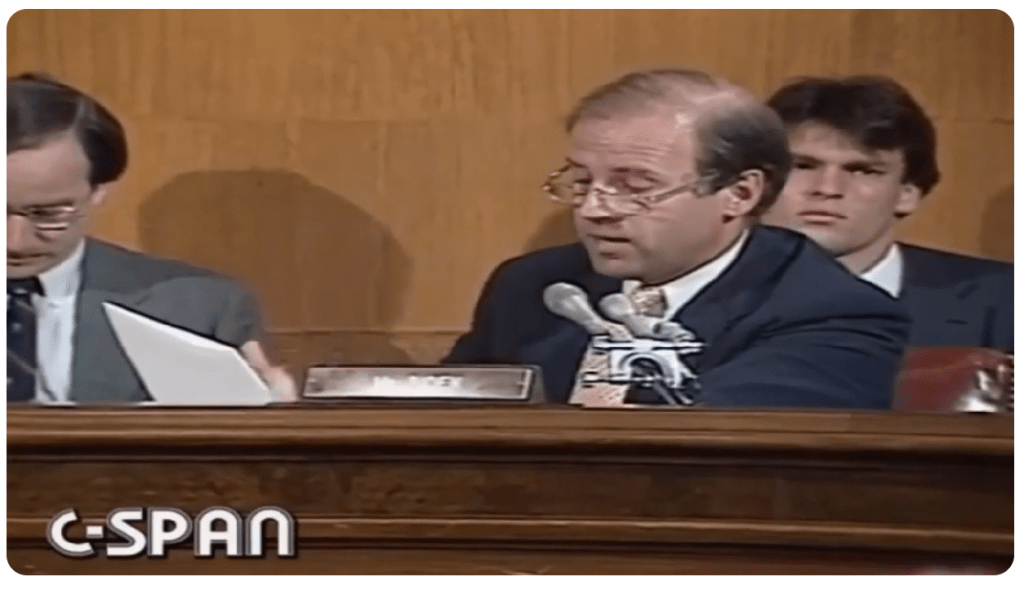
When asked about future Fed policies, Powell angrily replied “I’m a man.” Just kidding, but that is almost as nonsensical as his other answers.
As Bidenomics fails to do anything other than make big donors wealthier (green energy companies, big tech and union bosses, etc), we are seeing the impacts of Fed monetary tightening to combat inflation caused by Biden/Pelosi/Schumer’s spending spree.
First, the 10-year REAL Treasury yield is close to breaching 2%.
Second, 30-year mortgage rates are now 7.62%, up over 150% under Bidenomics.
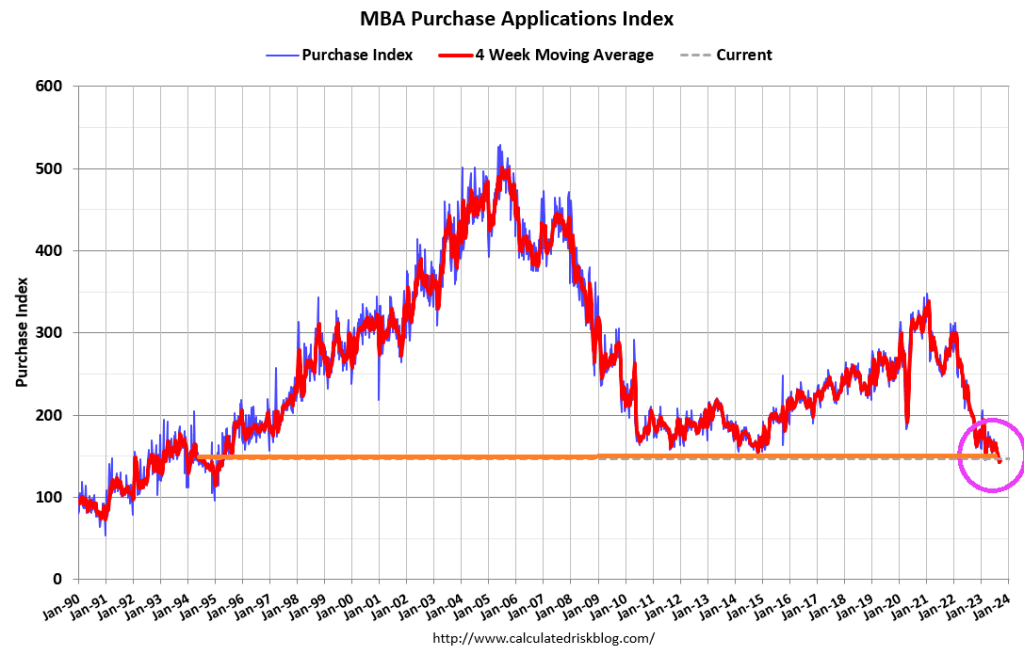
Third, mortgage purchase applications crashed to the lowest level since 1995.
Fourth, the 2-year Treasury yield just breached 5%.
Fifth, the 10Y-2Y yield curve remains deeply inverted.
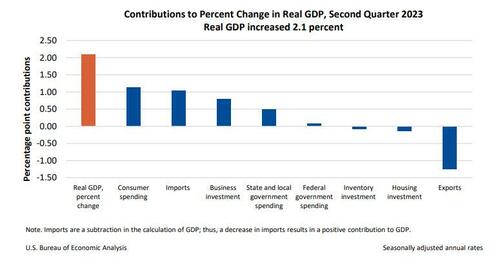
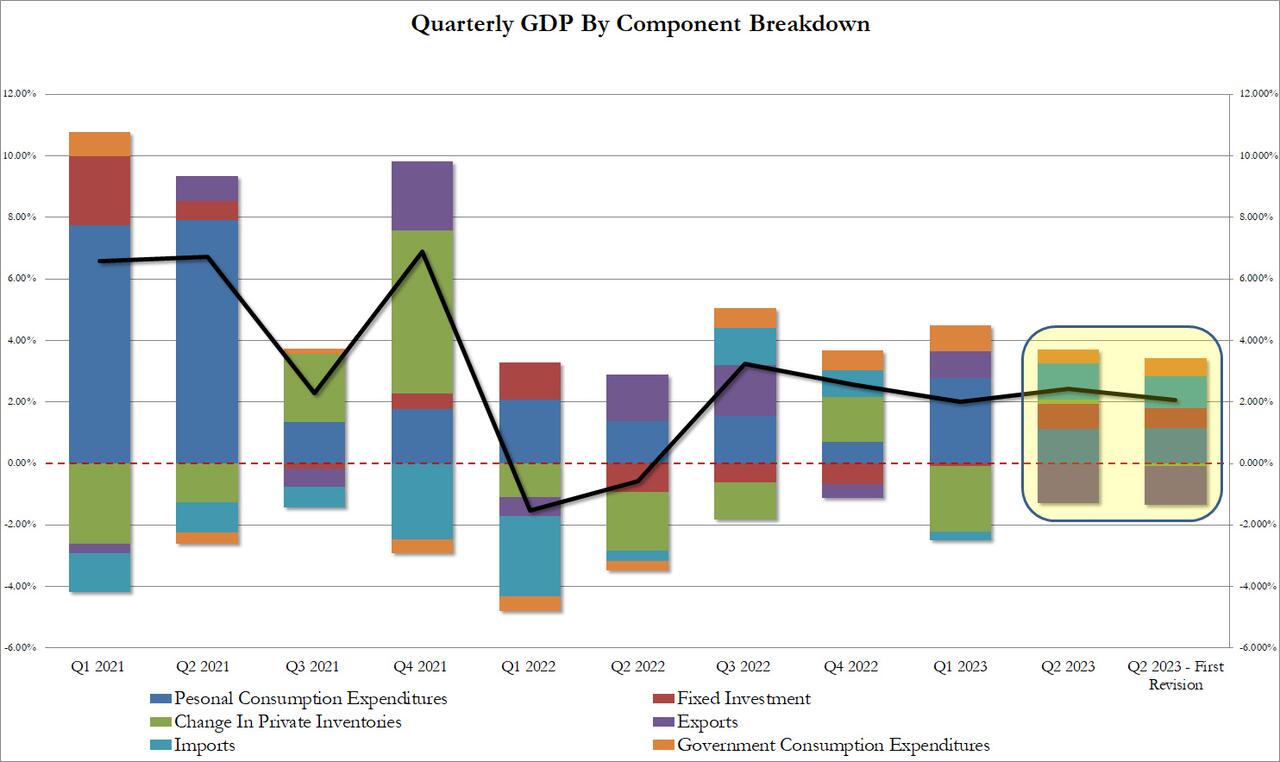
The GDP estimate released today is based on more complete source data than were available for the “advance” estimate issued last month. In the advance estimate, the increase in real GDP was 2.4 percent (refer to “Updates to GDP”). The updated estimates primarily reflecteddownward revisions to private inventory investment and nonresidential fixed investmentthat were partly offset by an upward revision to state and local government spending.
The increase in real GDP reflected increases in consumer spending, nonresidential fixed investment, state and local government spending, and federal government spending that were partly offset by decreases in exports, residential fixed investment, and private inventory investment. Imports, which are a subtraction in the calculation of GDP, decreased.
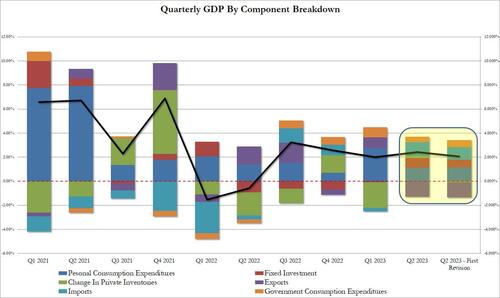
The revision according to the BEA, “reflected a smaller decrease in inventory investment and an acceleration in business investment. These movements were partly offset by a downturn in exports and decelerations in consumer spending and federal government spending. Imports turned down.” In short, everything was uglier,
Taking a closer look at the data, we find the following changes to the bottom line:
Personal consumption added 1.14% to the bottom line print or just over half, up from 1.12% in the original print; annualized this comes out to 1.7% which was below the 1.8% estimate.
Fixed investment contributed 0.66%, down from 0.83%
Change in private inventories now subtracting 0.09% from the bottom line number, a big swing from the positive 0.14% print in the original estimate. And it will be revised even lower next month as more of the “shrink” emerges.
Net exports were also revised lower, with gross exports trimmed from -1.28% to -1.26%, while imports were revised from 1.16% to 1.04%
Finally the ever handy plug that is government consumption (which is a garbage concept since the government does not actually create anything of economic value in the economy but merely allocated graft and embezzlement of public funding), actually rose from 0.45% to 0.58% (of bottom line GDP). Without this revision, Q2 GDP would have printed below 2.0%
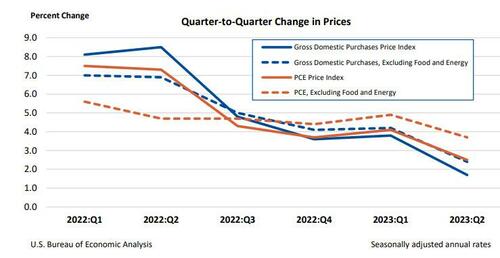
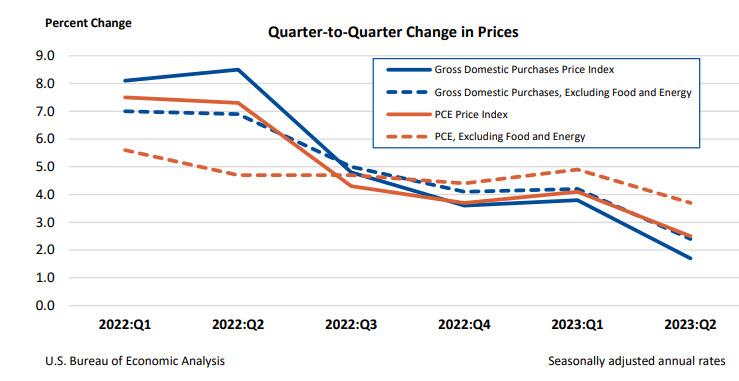
Separately, gross domestic purchases prices, the prices of goods and services purchased by U.S. residents, increased 1.7% in the second quarter after increasing 3.8 percent in the first quarter, above the 1.6% estimate last month but below the consensus 1.8%. Excluding food and energy, prices increased 2.4% after increasing 4.2%.
Personal consumption expenditure (PCE) prices increased 2.5% in the second quarter after increasing 4.1% in the first quarter. Excluding food and energy, the PCE “core” price index increased 3.7% after increasing 4.9%. This number was also revised lower from 3.8% and missed estimates of 3.8%.
Finally, the BEA reported corporate profits decreased 0.4% at a quarterly rate in the second quarter after decreasing 4.1% in the first quarter. Profits of domestic financial corporations decreased 12.1% after decreasing 2.3 percent. Profits of domestic nonfinancial corporations increased 0.9% after decreasing 5.0 percent. Profits from the rest of the world (net)increased 4.4 percent after decreasing 2.0 percent. Corporate profits decreased 6.5 percent in the second quarter from one year ago.
Needless to say, all this is a far cry from the rebound in corporate profits that companies themselves reported in their various GAAP and non-GAAP metrics, which is to be expected in a world where there is now an uncrossable chasm between economic data and its government fabrications.
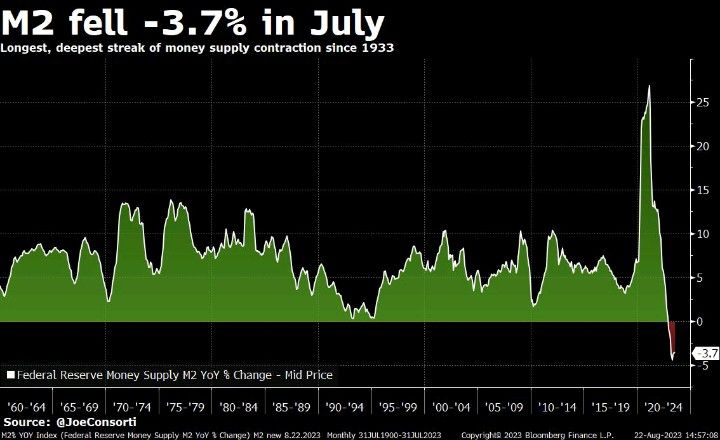
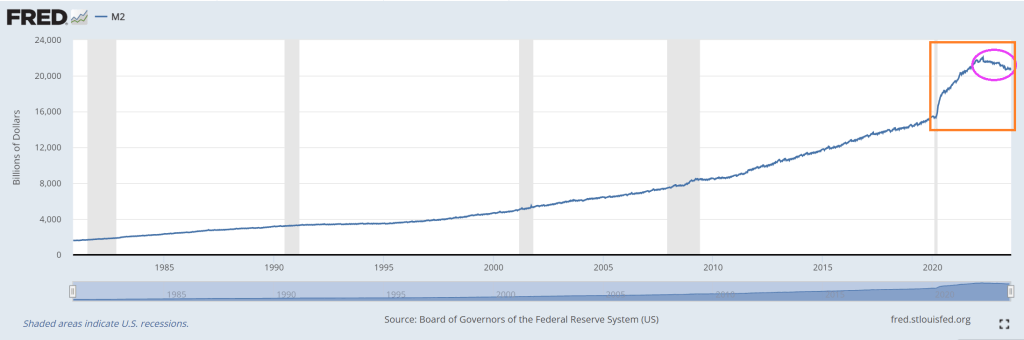
Then we have M2 Money collapsing, down -3.7% in July. Longest, deepest contraction of money suppy since 1933.
Biden, making Zelenskyy rich again!! The US bought Zelenskyy a new villa! “The document indicates that the villa was purchased by Zelenskyy’s mother-in-law in May 2023. The price of the villa is 150,000,000 Egyptian pounds or approximately $4,850,000.” Thanks Biden!!! America last!
Joe Biden is an incredibly weak President. I am not talking about his age or his deteriorating mental faculties. I am talking about ordering his attorney general to indict his chief political opponent, Donald Trump. How does the world interpret this weakness? BADLY.
The US has gone off the rails in terms of printing money, particularly since COVID struck and money printing went wild.
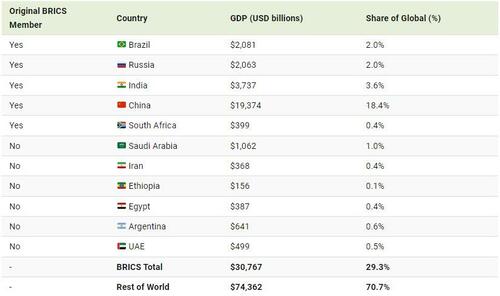
Under Biden’s Reign of Error and the US reckless money printing, more countries are abandoning King Dollar (based of fiat currency) and joining BRICS. Brazil, Russia, India, China, South Africa and a host of countries joining like Argentina, Saudi Arabia, Iran, Egypt, UAE, etc.
Now, the rest of the world is still stuck on the US Dollar as reserve currency … for now. But as Biden gets weaker and weaker, watch more countries join BRICs.
According to Reuters, there are over 40 countries that have expressed interest in joining BRICS. A smaller group of 16 countries have actually applied for membership, though, and this list includes Algeria, Cuba, Indonesia, Palestine, and Vietnam. Pretty soon, under Biden’s crazy leadership, we may be the last man standing in using the US Dollar as reserve currency.
Then we have the other shoe dropping with Bidenomics.
As soon as Biden took office, he set out to destroy industries that produce reasonably priced energy. He focused tremendous effort on deficit spending and borrowing to hand out “government goodies” to buy votes; recipients of this government largesse, in large part, included debt-saddled students, the green mafia, and leftist activists.
When Biden took office, inflation was under 2%, despite COVID and supply chain disruptions; shortly after, it skyrocketed to over 9%. Now inflation increases are “down” but prices remain exceptionally high compared to pre-Biden.
For example, crude oil prices, which affect almost everything and are used in over 6,000 products, are roughly double what they were when Biden took over.
President Trump focused on reduced regulations and energy independence, and implemented lower tax rates, all moves that greatly helped the American people. In contrast, Biden focuses on ensuring bureaucrats rapidly increase regulations which raises costs for everyday Americans; he’s waging economic war against us. Very few of Biden’s regulations go through Congress. From the White House archives:
Between FY 2017 and FY 2019, the Trump Administration has cut nearly eight regulations for every new, significant regulation….
The Council of Economic Advisers (CEA) estimates that this pro-growth approach to Federal regulation will raise real incomes by upwards of $3,100 per household per year.
Here are some recent reports of how well Biden policies are working:
Leading economic indicators have fallen for sixteen straight months. Maybe that is why people think the economy is moving in the wrong direction?
The current cost-of-living crisis is a manufactured one. As inflation rose, the Federal Reserve was forced to raise interest rates, which saw fewer people move. The cycle is very understandable, as simply explained in this one headline, “Housing Crunch: Home Sales Fall To Six Month Low…But Prices Rise Anyway”.
Parcel volumes are dropping by so much, freight pilots are “worried” about job security.
People are running up credit card debt and defaulting on car loans because of high inflation, and because their real wages haven’t been able to sustain them. Now, even more are falling behind on their payments. From CNN:
More Americans are failing to make payments on their credit cards and auto loans, another sign of rising financial pressure on consumers.
New credit card and auto loan delinquencies have now surpassed pre-Covid levels, according to a Wednesday report issued by Moody’s Investors Service.
After years of promoting and subsidizing electric cars, they represent around 6% of total sales, and demand is clearly slowing. It wasn’t that long ago that well-to-do people were buying these electric toys so quickly that they were placed on waiting lists; now, inventories are building because they are too impractical and expensive:
Auto News understands that there is currently a 103-day supply of unsold EVs in the United States. While it did not specify how many units are sitting on dealership lots, it says there is a higher supply of unsold EVs than any other automotive segment, except those in the ultra-luxury and high-end luxury segments with supplies also reaching over 100 days.
So what is Biden’s solution? Force people to buy them.
Here are some simple economics questions for the media and other Democrats:
Does flooding the U.S with illegals help or hurt housing availability and affordability?
Will the intentional destruction of oil and coal companies help or hurt the middle class and the poor?
Yet, the media and other Democrats brag that Biden’s economic policies are great, and when the public gives Biden poor marks, they say that we just don’t understand, and we’re not willing to get behind a candidate if they fail to make us feel “warm and fuzzy.”
Are journalists really that unaware?
Of course, they always sought to destroy Trump as his policies, even as poverty sank to record lows amongst minorities, because they don’t really care about anything but big government. According to Census data:
In 2019, the poverty rate for the United States was 10.5%, the lowest since estimates were first released for 1959.
Poverty rates declined between 2018 and 2019 for all major race and Hispanic origin groups.
Two of these groups, Blacks and Hispanics, reached historic lows in their poverty rates in 2019.
Results and facts haven’t mattered to the complicit leftist media for a long time.
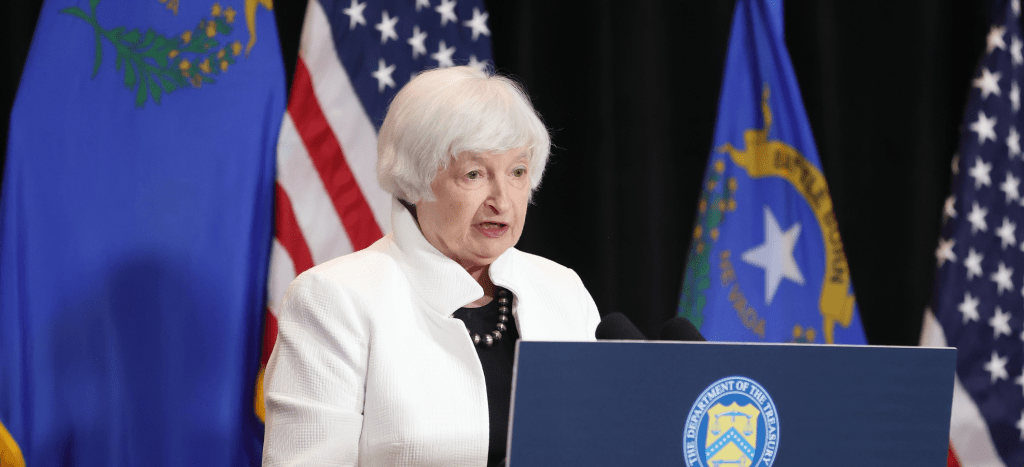
And perhaps the worst mistake Biden made (amongst his laundry list of horrible mistakes, [Afghanistan retreat, not showing up to E Palestine Ohio, Bidenomics that is a payoff to green donors and BIG corporate interests, an embarrasing visit to Maui two weeks after the fire, indicting his leading political opponent, ….) is the appointment of the WORST Federal Reserve Chair (Janet Yellen) as Treasury Secretary.
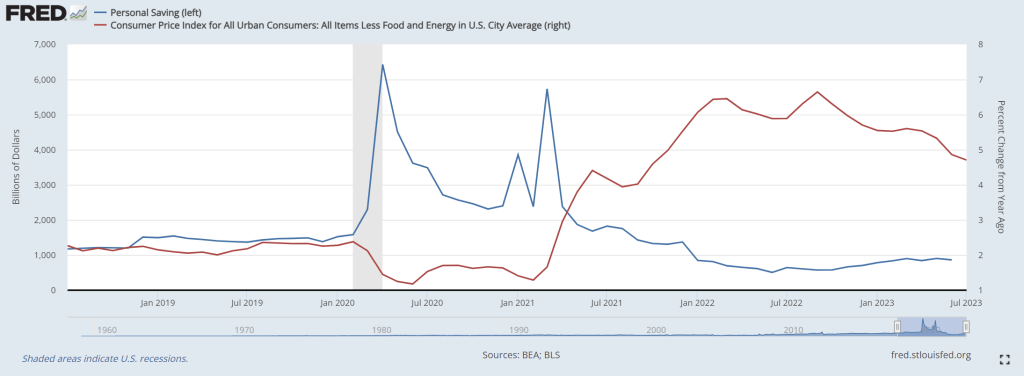
US personal savings are being exhausted as The Fed raises rates to fight inflation. I call this phenomenon “low riding” where consumers are being punished by The Federal Reserve and Biden Administration.
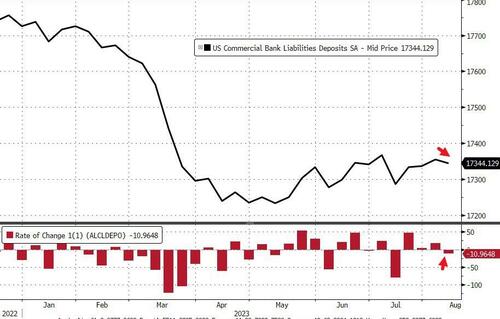
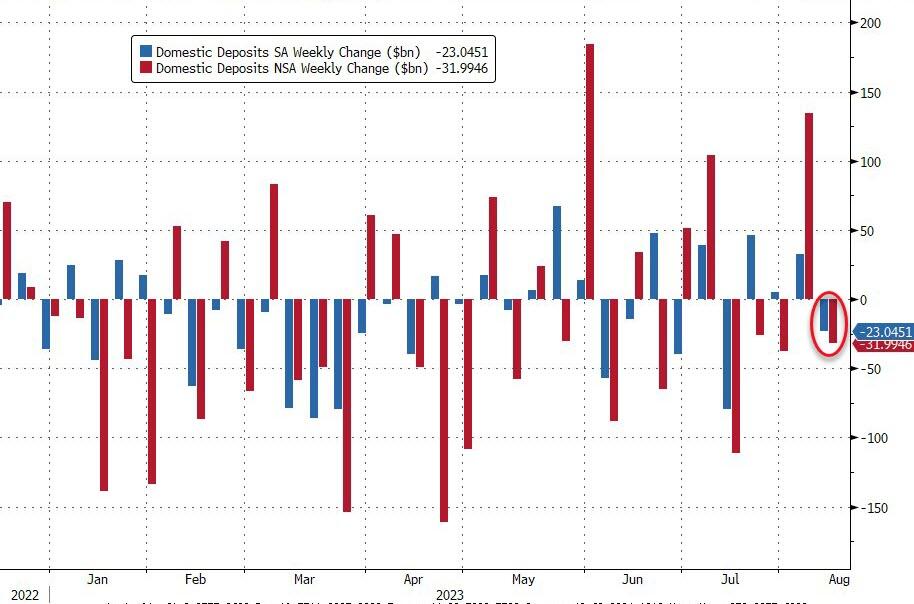
On a seasonally-adjusted basis, The Fed says that total deposits dropped $11BN last week (the first decline in 4 weeks). We also note that the prior week’s inflow was revised higher…
Source: Bloomberg
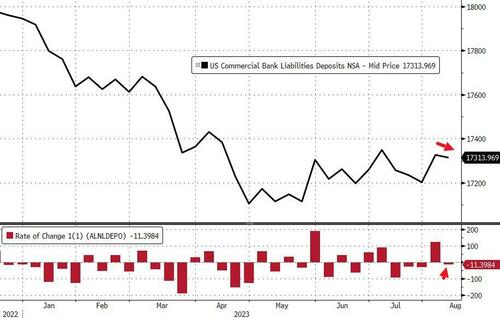
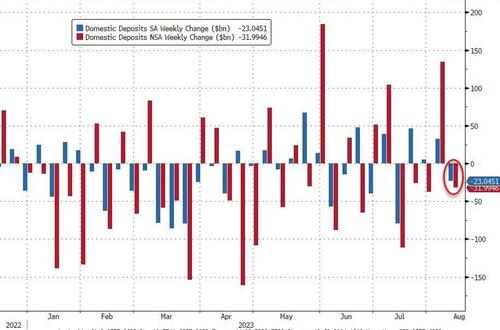
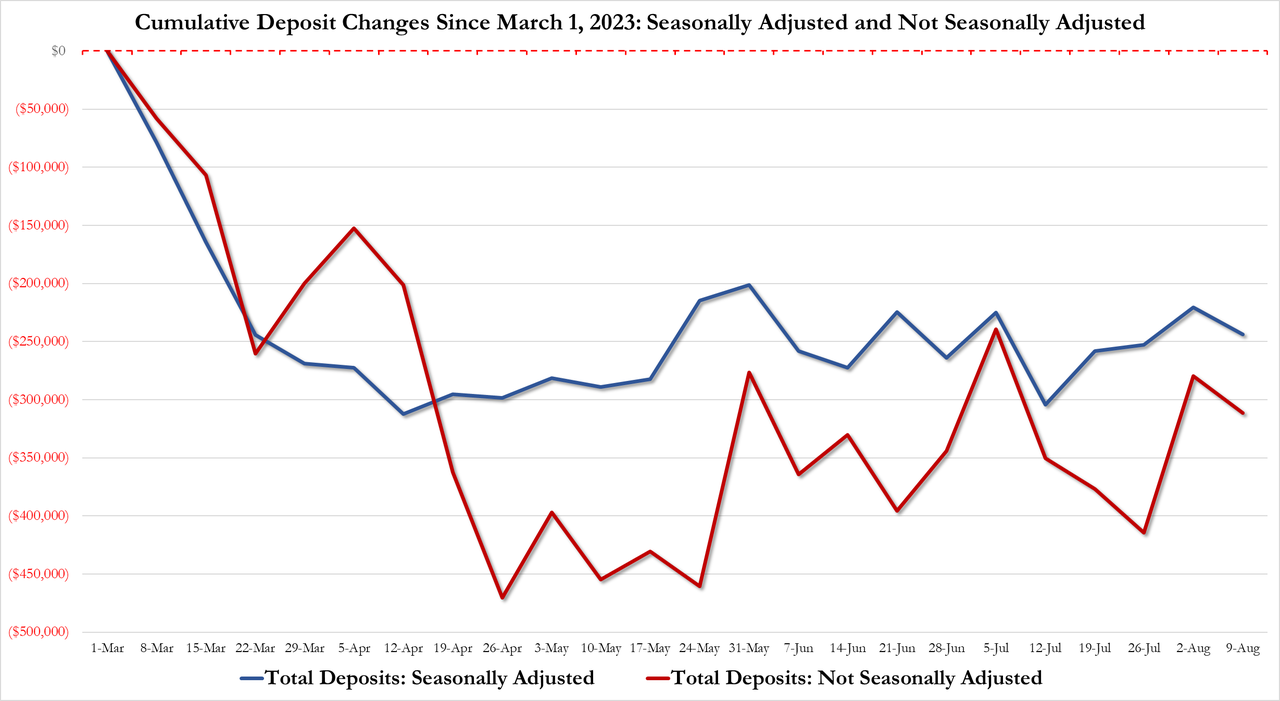
After last week’s enormous $121BN NSA deposits inflow, last week saw an $11BN outflow (on a non-seasonally-adjusted basis)…
Source: Bloomberg
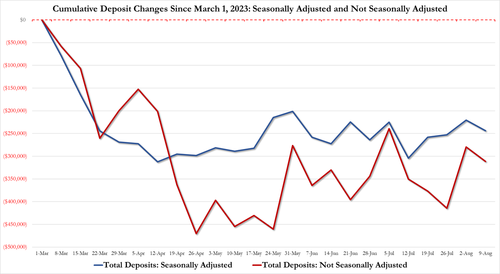
The gap between SA deposits and NSA deposits remains more manageable (until the next time The Fed decides to fiddle)…
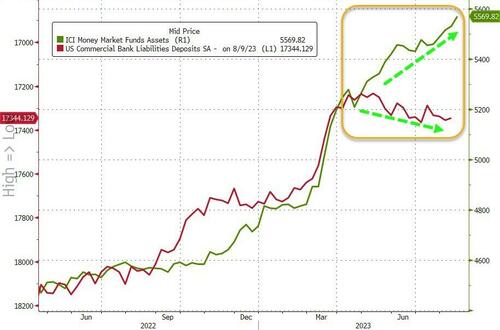
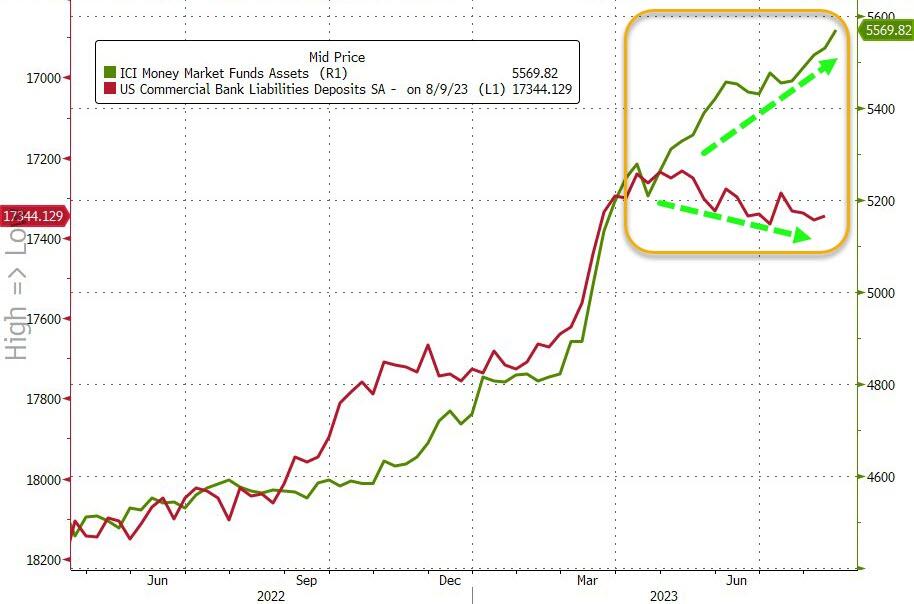
The divergence between money-market fund assets and bank deposits remains extreme…
Source: Bloomberg
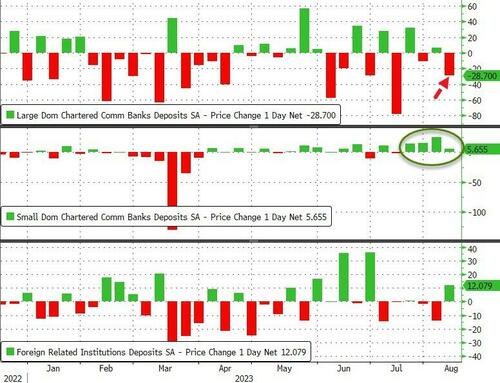
On a seasonally-adjusted basis, Small Banks saw $5.6BN deposit inflows last week while Large Banks suffered $28.7BN outflows (with foreign bank inflows of $12BN making up the difference)…
Source: Bloomberg
And so, for a nice change, everything is tidy with domestic US banks seeing deposit outflows on an SA and NSA basis…
Source: Bloomberg
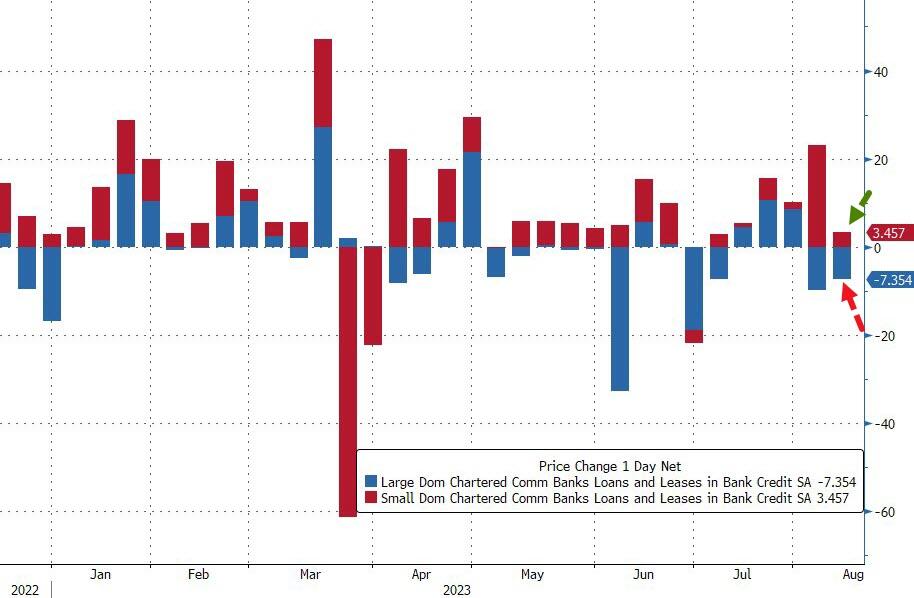
On the other side of the ledger, small banks continued to pump out loans (+$3.56BN, sixth straight week of increases), while large banks saw a $7.4BN contraction in loan volumes…
Source: Bloomberg
So, if The Fed’s data is to be believed, Small banks are ‘winning’ – deposit inflows and making loans; while large banks are leaking – deposit outflows and shrinking loans. All while Treasury prices tumble, stressing small bank balance sheets.
Just remember, the sitting US President Joe Biden goes under several psuedonyms like Robert Peters, Robin Ware, and JRB Ware in his email conversations about Ukraine with his son Hunter. But don’t forget another pseudonym: The Reverend Kane from Poltergeist 2!
“Ice Cream Joe” Biden is at Lake Tahoe for a week, probably to avoid being asked questions about his tin-ear respoonse to the tragic Maui fires that have killed 106 people so far. Instead, Joe is inappropriately chuckling (showing he doesn’t care!) and taking photo ops of him eating ice cream. The Biden administration angered a lot of people when it was announced that households that have been affected by the fires would only be getting a one time emergency aid payment of $700 while he gives billions for Ukraine.
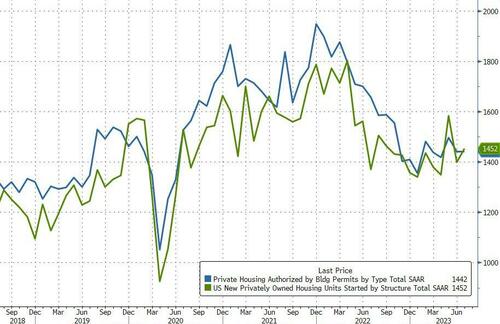
At least housing starts were up 6% year-over-year (YoY).
However, the picture was more mixed with starts rising 3.9% MoM (vs +1.1% exp), but that was impacted by a notable downward revision in June (from -8.0% to -11.7%).Building Permits rose just 0.1% MoM (well below the 1.5% MoM expected).
On a SAAR basis, Permits disappointed (1.442mm vs 1.463mm exp) while Starts were in line at 1.452mm (up from a significantly downwardly-revised 1.398mm in June).
Source: Bloomberg
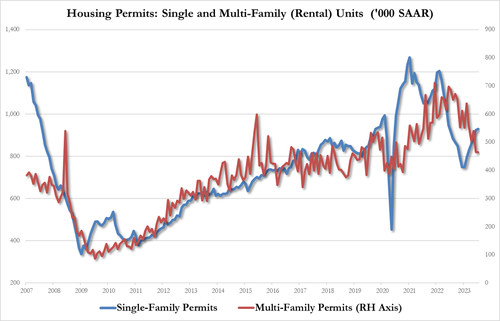
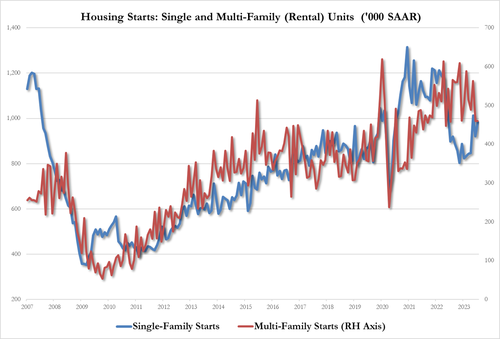
On the Permits side, single-family rose as multi-family fell:
Single-family up to 930K from 924K, highest since June 2022
Multi-family down to 464K from 465K, lowest since Oct 2020
July Housing Starts data followed the same trajectory with rental units growth underperforming single-family:
single-family housing up 6.7% to 983K, up from 921K, highest since May
multi-family housing unch at 460K, tied for lowest since July 2022
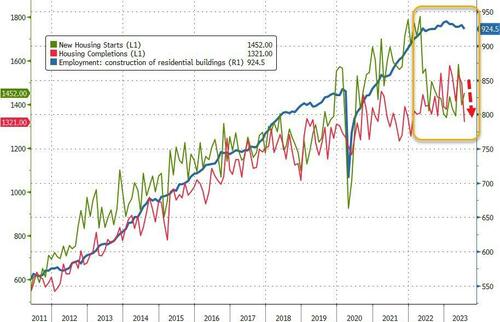
Additionally, we note that while Housing Starts and Completions remain well off their 2022 highs, Construction Jobs remain very close to those highs…
Source: Bloomberg
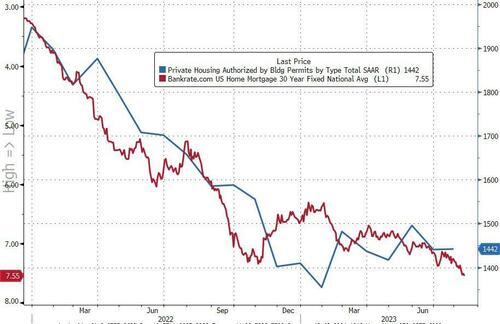
Finally, we note that Mortgage Bankers Association data released earlier this morning showed applications for home purchases dropped again last week (back near 1996 lows) as the contract rate on a 30-year fixed mortgage surged above 7% (highest since Dec 2001).
Source: Bloomberg
This won’t end well.
Speaking of not ending well, mortgage applications decreased 0.8 percent from one week earlier, according to data from the Mortgage Bankers Association’s (MBA) Weekly Mortgage Applications Survey for the week ending August 11, 2023.
The Market Composite Index, a measure of mortgage loan application volume, decreased 0.8 percent on a seasonally adjusted basis from one week earlier. On an unadjusted basis, the Index decreased 2 percent compared with the previous week. The Refinance Index decreased 2 percent from the previous week and was 35 percent lower than the same week one year ago. The seasonally adjusted Purchase Index decreased 0 percent from one week earlier. The unadjusted Purchase Index decreased 2 percent compared with the previous week and was 26 percent lower than the same week one year ago.


You must be logged in to post a comment.