The Federal Reserve And The Neo American Caste System (Brahmin Bankers Versus “Political Untouchables”)

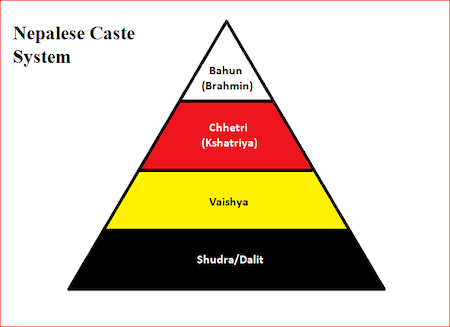
The Federal Reserve has created America’s version of India’s caste system. At the top of the neo American caste system are bankers and the political donor class. The top 1%. The other 99% are losing ground to the Brahmin Banker Class.

In 1913, Woodrow Wilson and his progressives promised that the Federal Reserve would avert both depressions and inflation, while preventing the wealthy from controlling America’s financial markets at the expense of the poor, the new untouchable class.

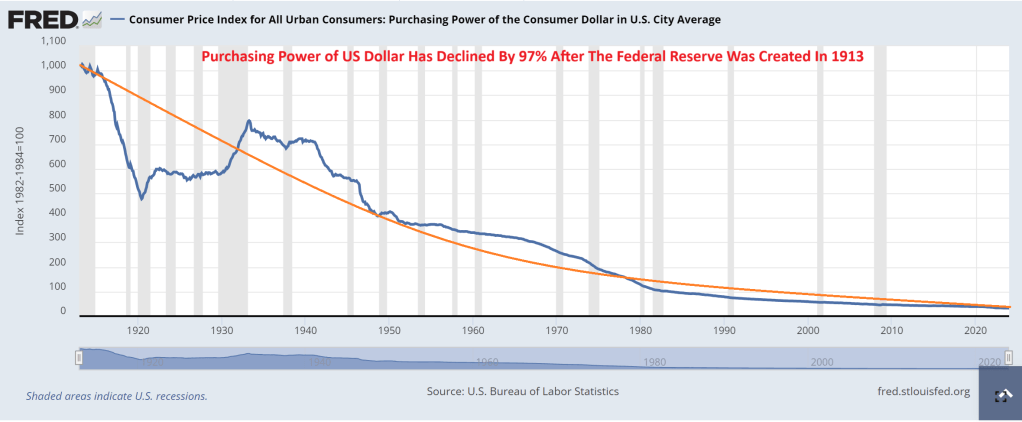
More than a century later, it’s clear that was all a lie, and the Fed has helped create a permanent American underclass (political untouchables). The Fed was designed to transfer wealth from the American people to the government, mostly through the hidden tax of inflation. But this process has prevented countless American families from being able to save and get ahead, because their savings are constantly losing value.

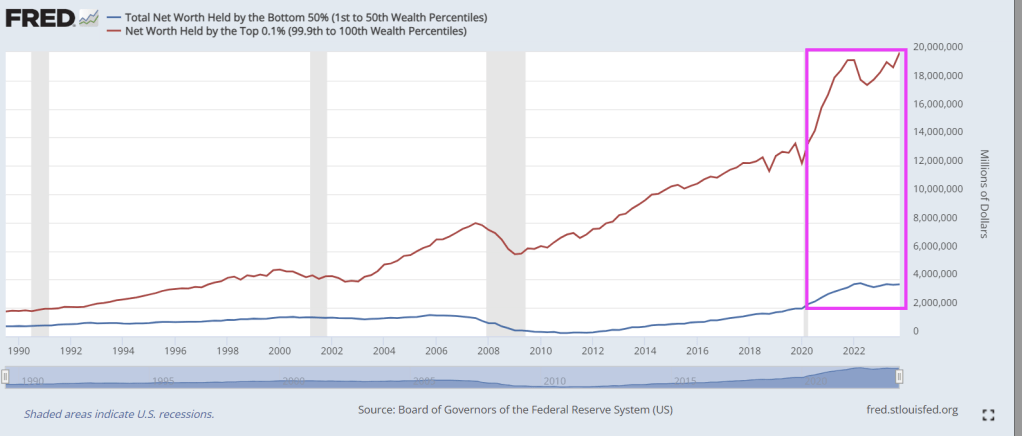
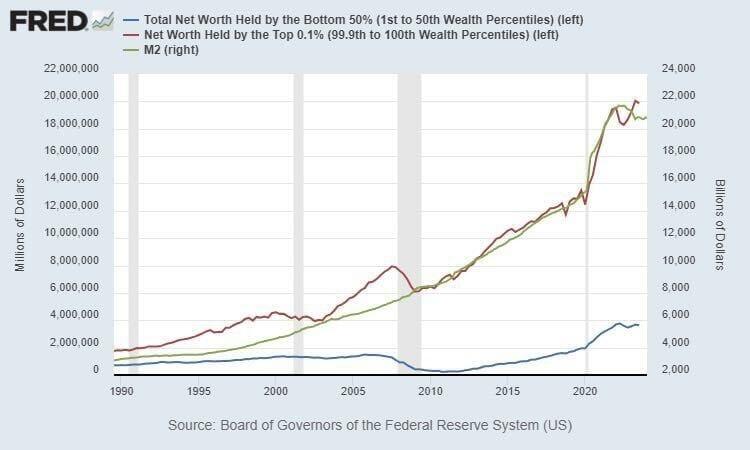
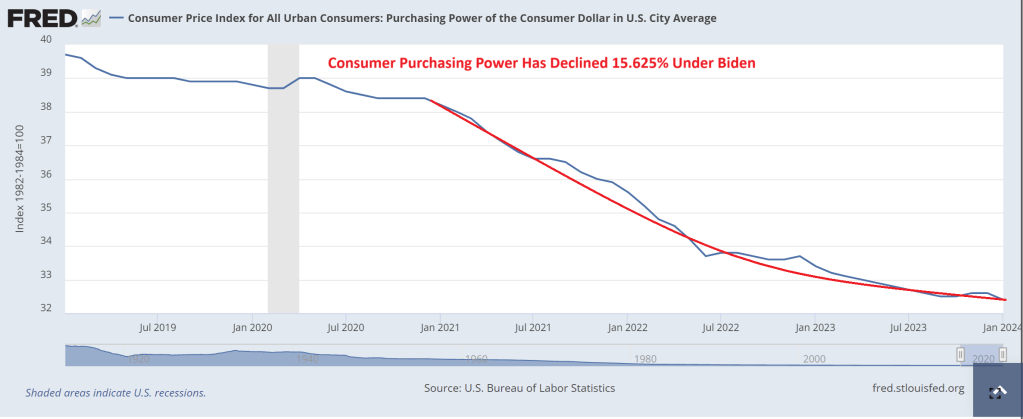
As you can see, the Brahmin Banker class (top .1% of net worth) are beating the socks off the bottom 50% of the new American caste system. This problems has greatly accelerated under Biden’s Reign of Error.

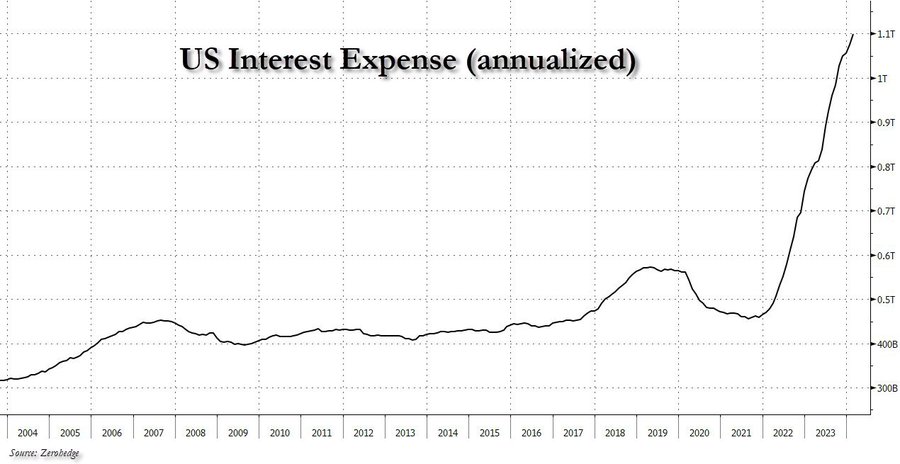
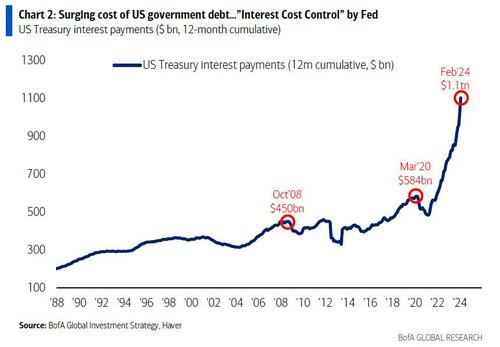
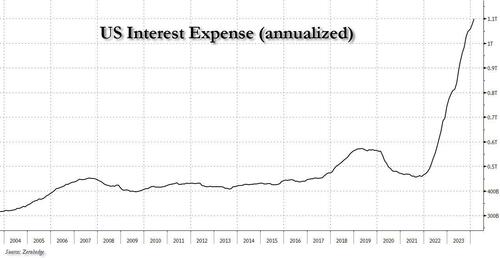
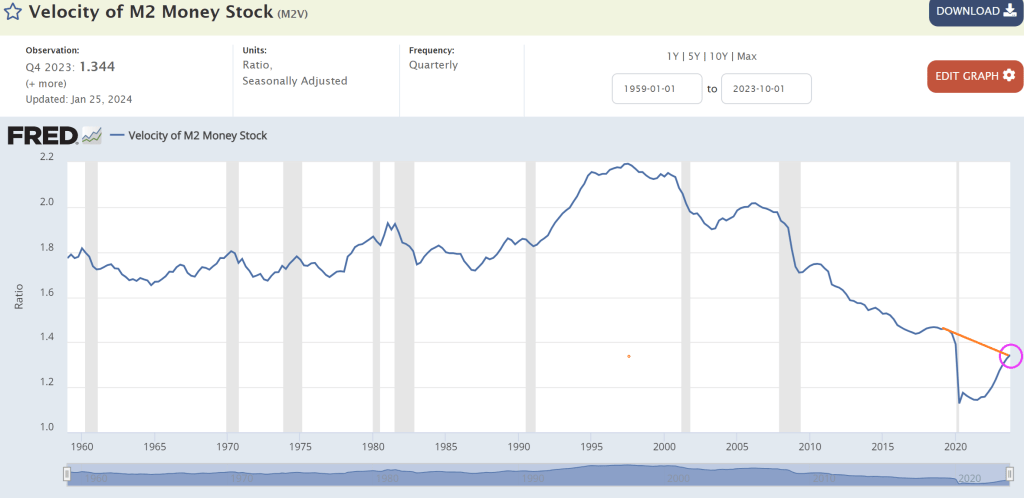
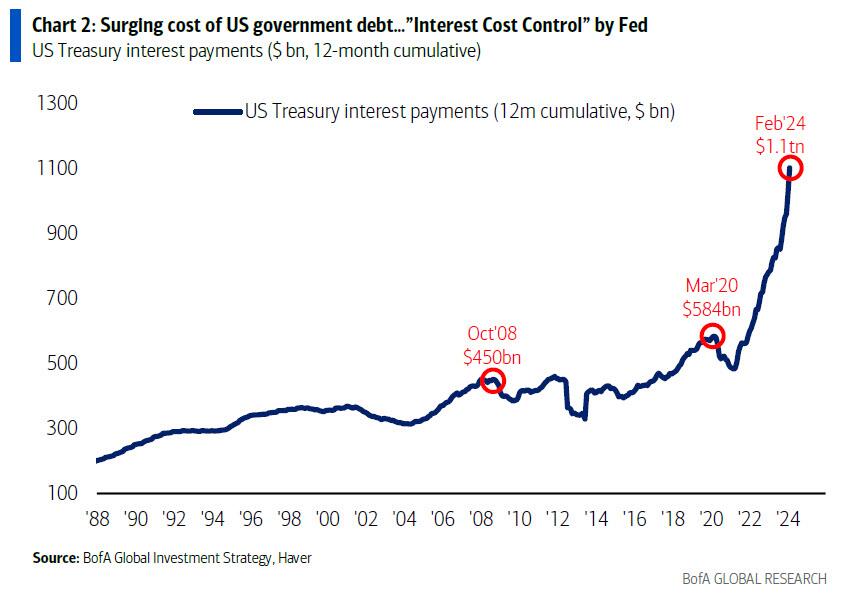
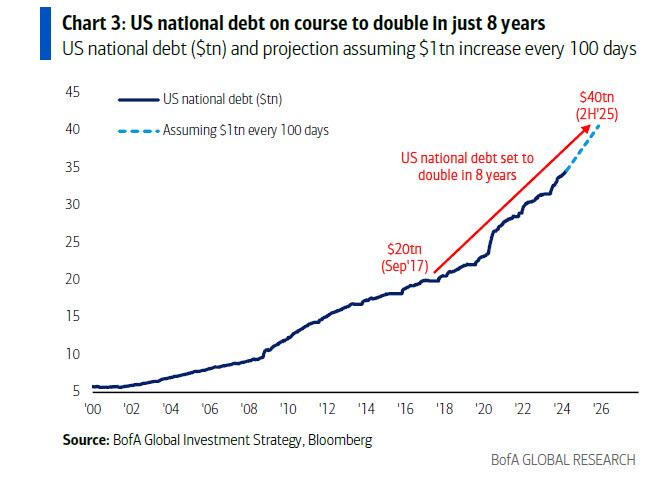
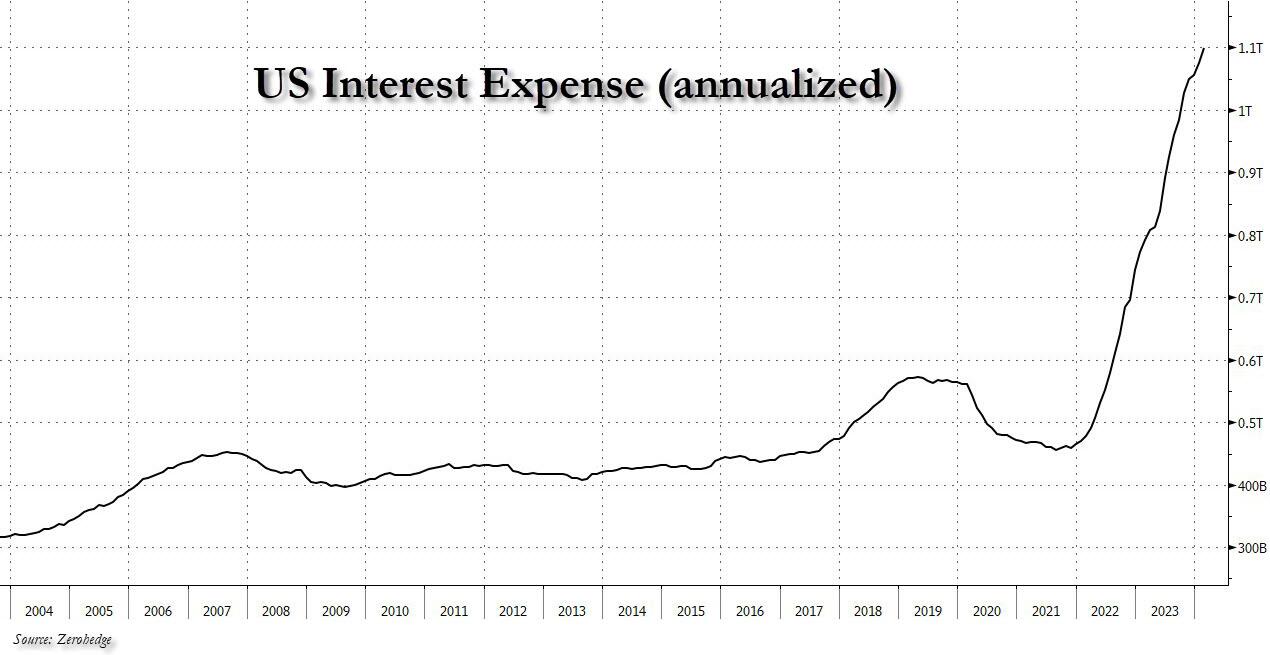
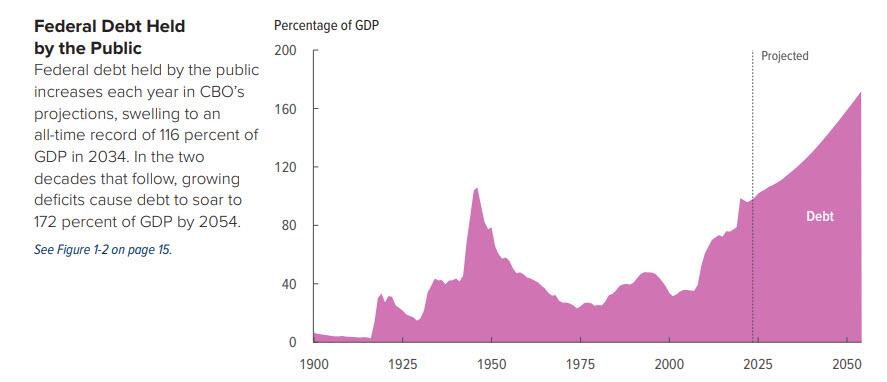
For two decades, the Fed kept interest rates artificially low to help finance massive government spending. When that spending reached unprecedented heights in 2020, the Fed intervened more drastically than ever, creating trillions of dollars and devaluing the currency.

Thus began an unparalleled transfer of wealth that continues to this day, and which has driven a wedge between different groups of Americans.

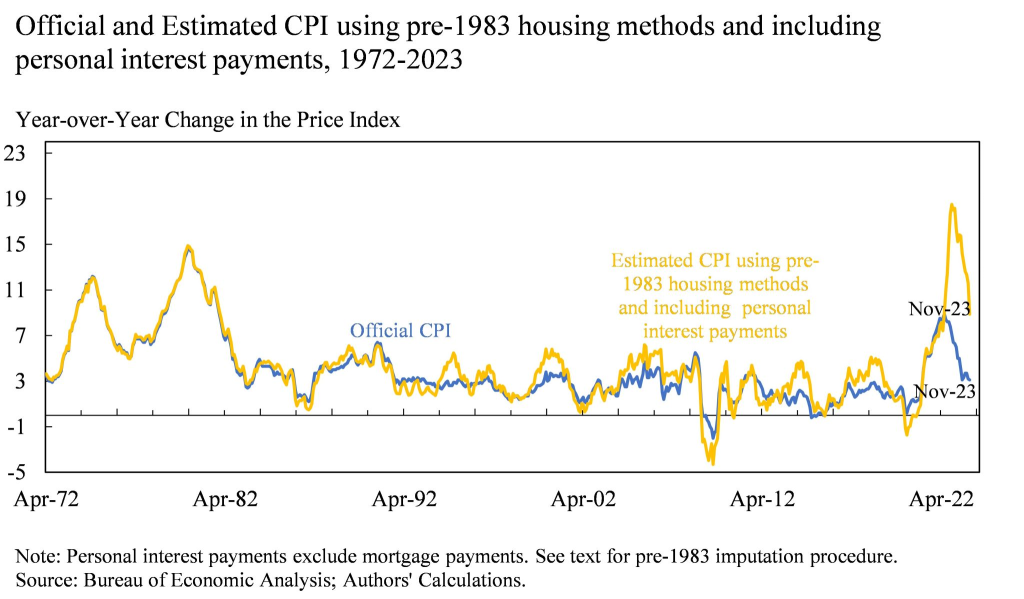
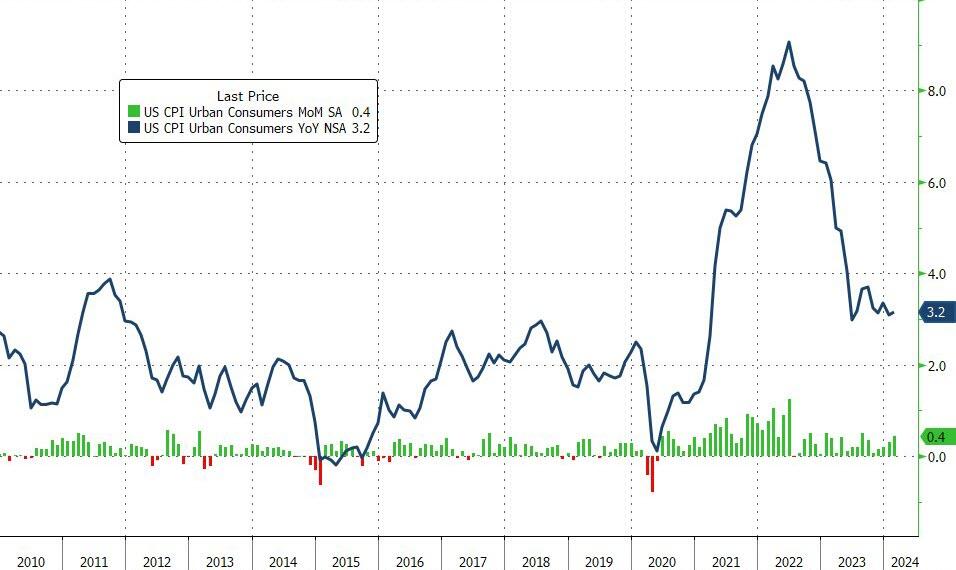
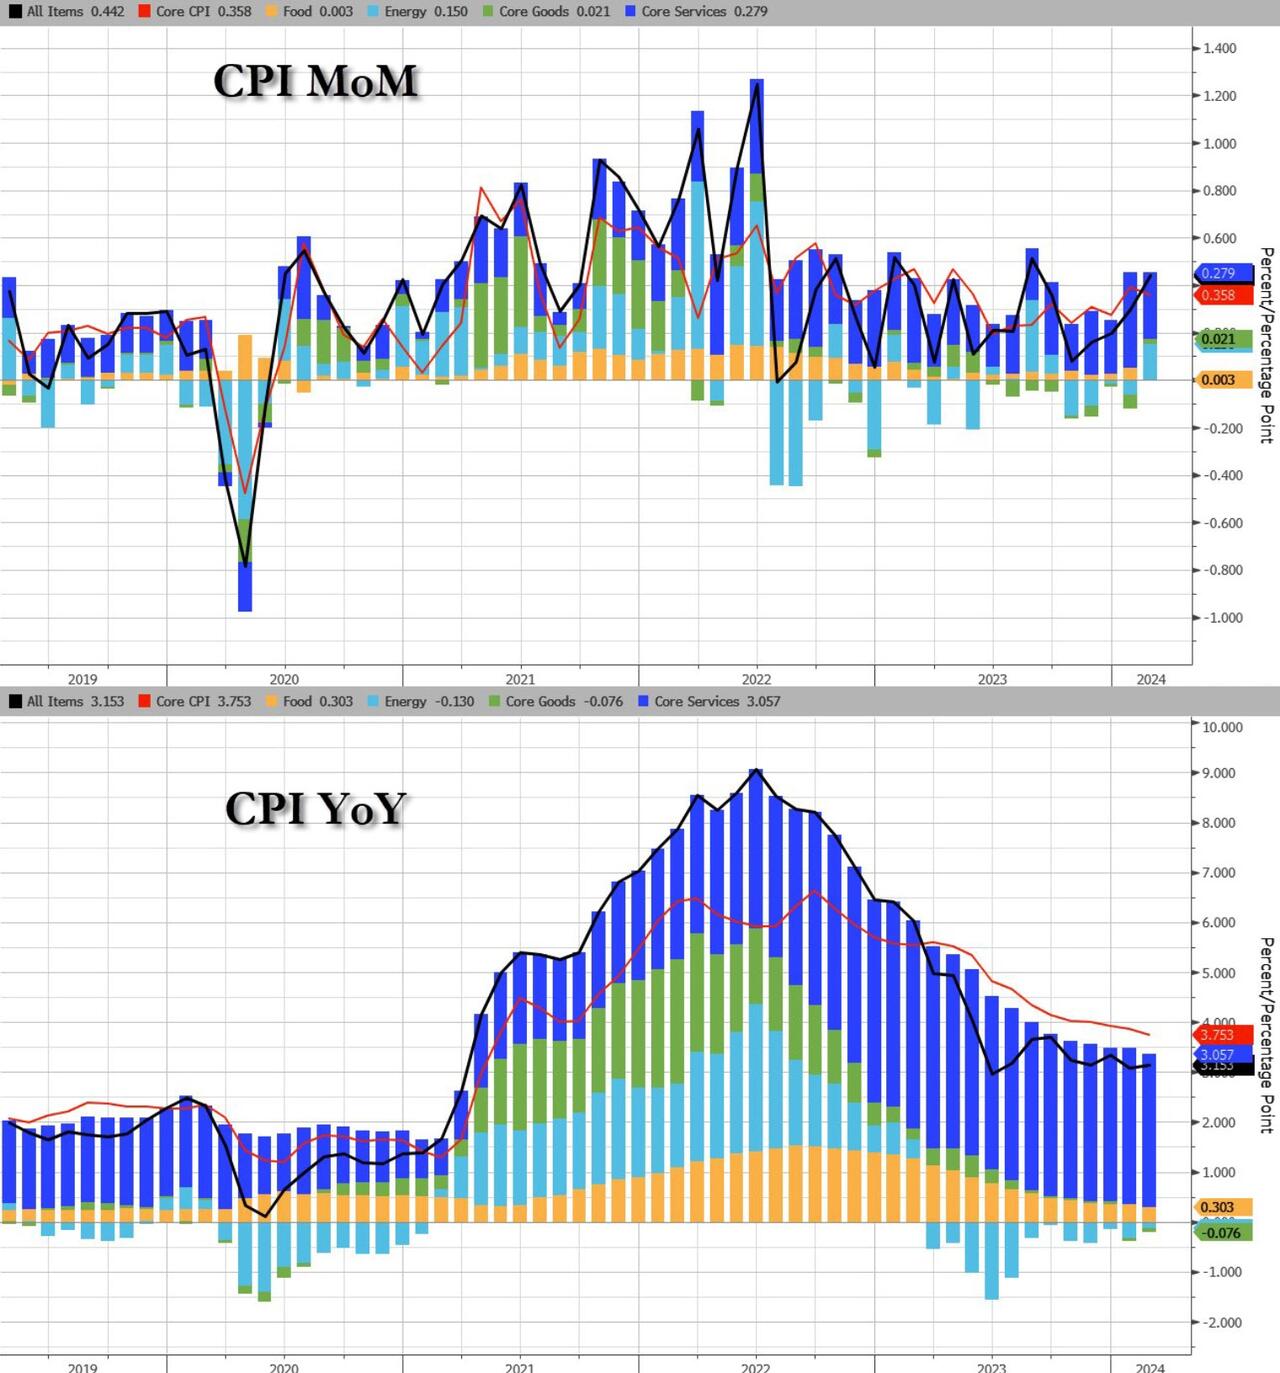
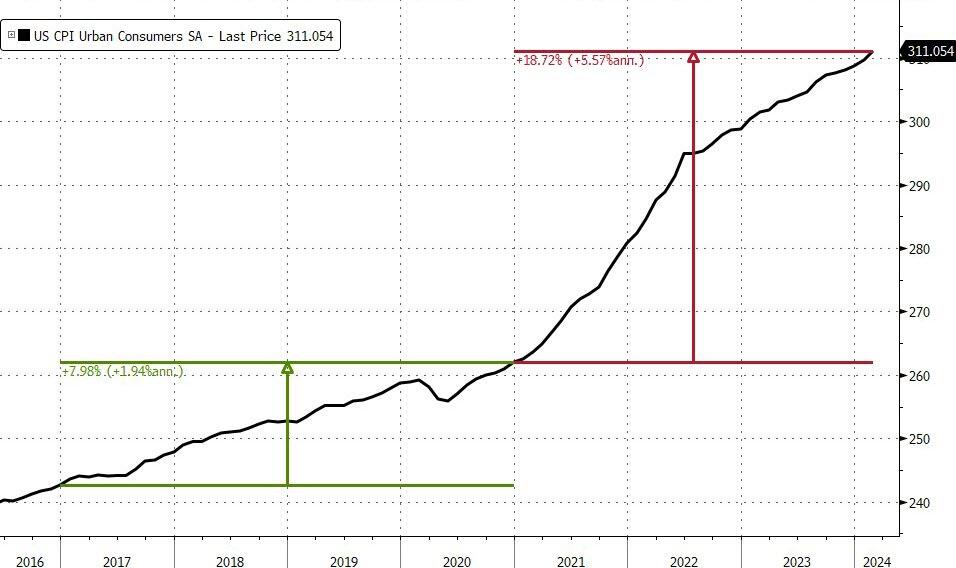
The painful inflation of the last three years has increased prices throughout the economy, distorting the signals that prices are supposed to convey to buyers and sellers. For example, the cost to own a median-price home today has doubled since January 2021, but it’s still the same house.

This phenomenon represents the monetization of housing, where a dwelling becomes a much better store of value than the currency, even if the real value of the house hasn’t improved.

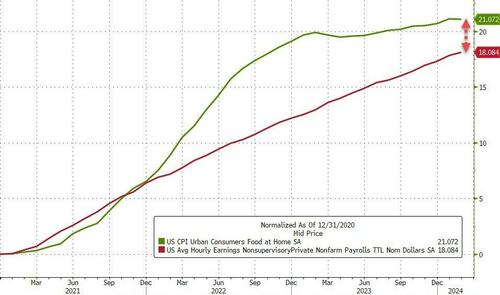
Likewise, Americans’ earnings have increased substantially over the last three years, but not in the most meaningful sense—that is, what they can buy. Instead, the opposite has happened, and today’s larger incomes buy less.

What would have been a decent salary in 2019 is no longer enough to even get by in many places, and it’s certainly not enough to ever fulfill the American dream of homeownership.

A family earning the median household income can afford a median-price home in only a handful of major metropolitan areas in the entire country. In many cities, the cost to own a median price home exceeds the take-home pay from the median household income. Even if you didn’t spend a dime on other necessities such as food, you still wouldn’t have enough for your mortgage payment.

It’s truly a condemnation of the status quo when even those with seemingly high incomes cannot afford a typical house.

Worse, as prices continue marching upward, people can save less, making it harder to accrue a sufficient down payment. Even by the time a family reaches their goal, home prices have increased again, and they’re back on the hamster wheel, trying to save for an even larger down payment.

Meanwhile, inflation is steadily, though silently, taxing away the real value of the family’s savings as they sit in the bank.

This has left countless Americans as perpetual renters, with almost an entire generation of young people giving up on having the standard of living that their parents had. An artificial chasm has been constructed between those who already own capital, like housing, and the remaining Americans who can only borrow such assets, as they do by renting.

Similarly, many of those struggling to afford sharply increased rents are going deeply into debt to keep a roof over their head while those who locked in a mortgage with a fixed interest rate before both home prices and interest rates exploded have shielded themselves from one of the largest drivers behind the cost-of-living increases of the last three years.

Many homeowners could not afford to buy their same home today. The monthly mortgage payment on a median-price home has doubled since January 2021. Thus, even if two families have identical incomes, the one that bought a home three years ago has a nearly insurmountable advantage over the other family trying to do so today.

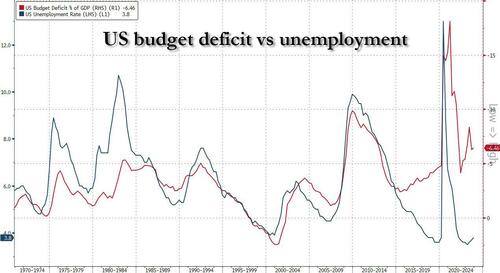
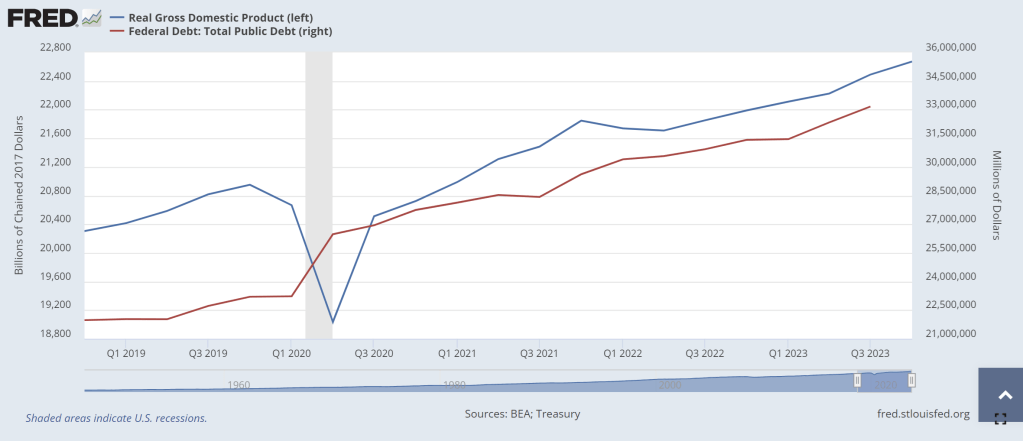
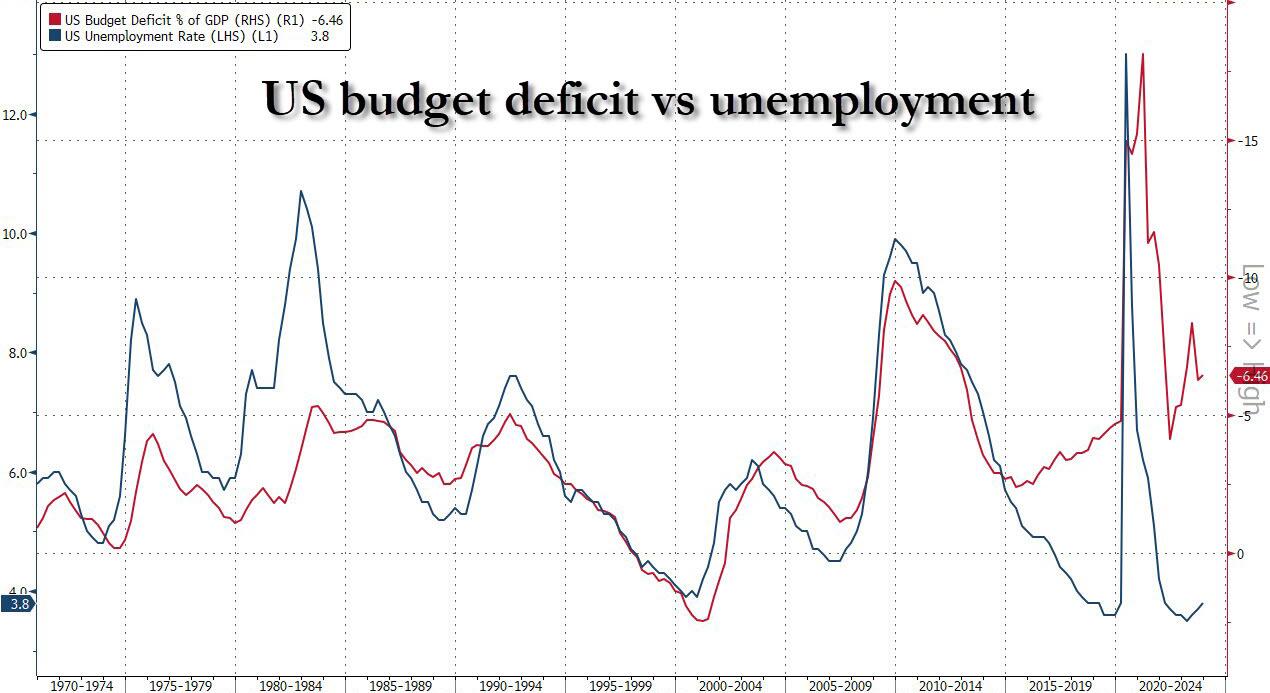
The Fed’s monetary manipulations have financed trillions of dollars in federal budget deficits, but they’ve also created a permanent American underclass, something antithetical to the Founders’ vision for the country.

Class mobility is at the heart of the American dream, and the Fed has turned it into a nightmare.

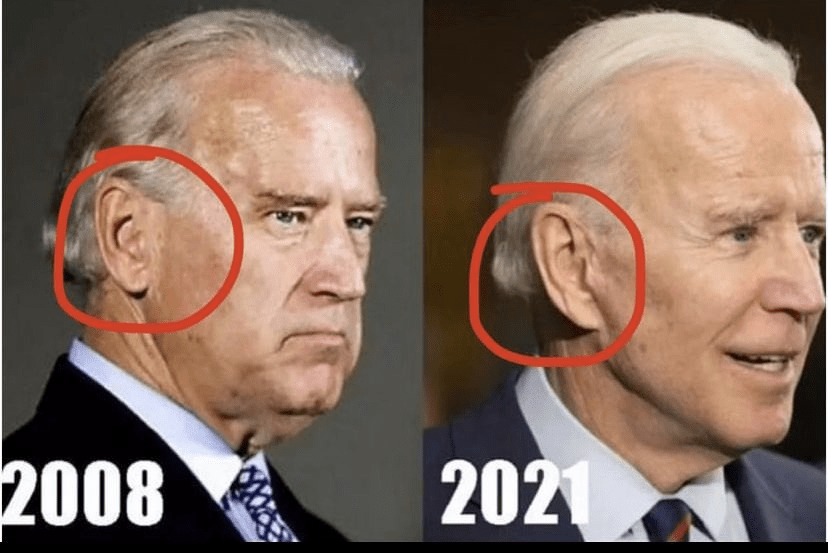
I was not comforted when I saw that Biden claims he had no idea who issued an pro-trans Executive Order for a Trans Awareness Day on Easter Sunday. Hey man, you are The President and have no idea who issued Executive Orders????

Here is a photo of Joe Biden with “Doctor” Jill on Easter Sunday flanked by Fed Chair Jerome Powell and Jared Bernstein (whom I once debated in Washington DC).

Update: KJP confessed that it was Obama who created the Trans Day of Awareness back in 2009 (although strangly not enacted until this part Easter Sunday).

Happy Easter! US Interest To Hit $1.6 Trillion By Year End, Making It The Largest US Government Outlay (Endless Wars And Exploding Entitlements Now Over $214 TRILLION)

Happy Easter! I mean Happy TRADITIONAL Easter, not a Biden weird trans celebration.

Biden and Congress (Schumer, Johnson, McConnell, etc) spend and borrow like its cottage cheese.

After hitting $1 trillion in late 2023, interest expense on US debt rose to a record $1.1 trillion in late March, and ii) while US debt is now rising at a pace of $1 trillion every 3 months, US interest expense is rising at a just as torrid $100 billion every 4 months (this interval will also shrink to three months very soon).

he Biggest Picture: $1.1tn in interest payments on US government debt past 12 months, doubled since COVID (Chart 2); trend in govt spending (up 9% YoY) & debt (up $1.0tn every 100 days)…big motivation for Fed to cut rates to constrain surge in interest costs (“ICC” or Interest Cost Control policy)… bear in bonds (if no recession), steeper yield curve, weaker US$, higher commodities/gold/crypto & TINA for stocks.

Of course, since Hartnett is one of those good strategists where one fact opens up a cascade of downstream observations, that’s precisely what happened this time and he fills out the balance of his latest report (available to pro subscribers in the usual place) with his tongue-in-cheek notes on why the US is on a doomsday date with a debt disaster, starting with why being a “dove means never having to say you’re sorry”:

  • US government spending past 5 months = $2.7tn, up 9% YoY… on course for $6.7tn in FY24; US national debt rising $1tn every 100 days…set to hit $35tn in May’24, $37tn by US election, $40tn in H2’25 (doubling in 8 years); spending up, deficits up (9% of GDP average past 4 years), debt up -> interest payments up = $1.1tn in past 12 months & set to rise by $150bn in next 100 days [ZH: this sounds familiar]
  • US Treasury has aggressively shifted refunding toward <1-year T-Bills ($21tn issuance past 12 months), lowering maturity of debt to ≈5 years, increasing sensitivity to short rates, incentivizing Fed to cut rates;

And the punchline: Hartnett takes our observations, and expands them to their logical, if absurd, extreme (which ironically takes places in just 9 months) to find that US annual interest costs are set to jump from $1.1 trillion to $1.6 trillion, which is a big deal…

  • Unchanged rates/yields & debt trend next 12 months & US refinancing rate is 4.4% & annual interest costs jump from $1.1tn to $1.6tn (Chart 5); in contrast 150bps of Fed cuts next 12 months and average refi rate is 3.2%, stabilizing/constraining interest payments to $1.2-1.3tn over next 2 years; call it “ICC”/Interest Cost Control but Fed must placate fiscal excess coming quarters…bear in bonds (if no recession), steeper yield curve, weaker US$, higher commodities/gold/crypto & TINA for stocks.

… because if the Fed does not cut rate by 150bps (as it may in an “ICC” scenario) should inflation prove to be sticky (something which Putin clearly has figured out realizing the fate of Biden’s re-election is in his oily hands), and total interest does rise to $1.6 trillion by year-end, that it will become the single biggest US government outlay by the end of the fiscal year; as a reminder, in fiscal 2023, Social Security spending was $1.354 trillion, Health was $889 billion, Medicare $848 and national defense, a paltry (by comparison) $821 billion.

Stepping briefly away from the looming US debt disaster, Hartnett makes three more observations on the current state of the market:

  • Tech regulation getting noisier:  DoJ vs Apple antitrust lawsuit, FTC vs Amazon antitrust lawsuit, FTC inquiry into AI deals of Amazon, Google, Microsoft; EU investigation into Apple, Meta, Google breach of Digital Markets Act; EU $2bn Apple antitrust fine, Japan FTC Apple & Google antitrust complaint et al…
  • “Magnificent 7” = 30% of SPX index & 60% of SPX gains past 12 months…investors love big tech “moats”, monopolistic ability to protect margins, market share, pricing power, finance & control AI arms race; but ≈$2tn of Magnificent 7 revenues past 12 months tempting target for regulators/governments struggling to pay bills;
  • Note tech historically the least regulated of sectors (the chart below uses data from 2017) and in past 12 months average tax rate of “Magnificent 7” was 15% vs 21% for rest of S&P 500… and regulation & rates the historic way sector bulls & bubbles end.

Now for the REALLY bad news. Unfunded liabilities (entitlements) have hit $214+ TRILLION. Given how voters hate paying more in taxes, look for the growing entitlements to add AT LEAST $214 trillion in NEW DEBT which will result in record high interest payments.

Hey big spender! How about NOT spending trilliions while pocketing 10% from foreign enemies?

Congress and The Biden Regime should select the now defunct British beer Watney’s Red Barrell (a truly awful beer) to symbolize their committment (or lack thereof) to fiscal responsibilty.

Let It Ride? Bidenomics Debt Market Meltdown With US Debt On “Unprecedented” Trajectory (Each US Citizen On The Hook For $636k In Unfunded Entitlements)

Part of the Bidenomics “plan” is not only green-energy spending, but plenty of freebies to gather voters from the masses. Like the $214 TRILLION in unfunded liabilities promised to the masses in the form of entitlements like Social Security, Medicare and Medicaid (why did they demand that all US citizens be forced to buy healthcare insurance, then give free healthcare to illegal immigrants??). In any case, each citizen is on the hook for $636,000!

What about the national debt with Ice Cream Joe at the helm? It has exploded in growth.

Not only has it gotten boring to be ahead of the curve by almost half a year, but pretty much every possible warning that could be said about the exponential increase in the US debt has been – well – said.

And yet, every now and then we are surprised by the latest developments surrounding the unsustainable, exponential trajectory of US debt. Like, for example, the establishment admitting that it is on an unsustainable, exponential trajectory.

That’s precisely what happened overnight when in an interview with the oh so very serious Financial Times (which has done everything in its power to keep its readers out of the best performing asset class of all time, bitcoin), the director of the Congressional Budget Office, Phillip Swagel, issued a stark warning that the United States could suffer a similar market crisis as seen in the United Kingdom 18 months ago, during former Prime Minister Liz Truss’s brief stint leading Britain – which briefly sent yields soaring, sparked a run on the pound, led to an immediate restart of QE by the Bank of England and a bailout of various pension funds, not to mention the almost instant resignation of Truss – citing the nation’s “unprecedented” fiscal trajectory.

The striking words from the head of the CBO, best known perhaps for publishing doomer debt/GDP projection charts such as this one…

… warned of the dangers of the U.S. facing “what the U.K. faced with former prime minister Truss — where policymakers tried to take an action, and then there’s a market reaction to that action”, comes as US government debt continues to break records, fueling concerns about the burden that places on the economy and taking a toll on America’s credit rating.

As a reminder, in September 2022, Truss roiled markets as she pressed for significant tax cuts, including changes lessening the tax burden on wealthier individuals without offsets, as well as other economic measures. The budget proposal spurred a major selloff of British debt, forcing U.K. interest rates to decades-long highs and causing the value of the pound to tank. While Truss defended her agenda as a means to spur economic growth, she stepped down as prime minister after less than two months on the job following the market revolt to her administration.

Meanwhile, it was up to the Bank of England to bail everyone out: the central bank intervened in the market, pledging to buy gilts on “whatever scale is necessary” with Dave Ramsden, a senior official at the central bank, saying at the time that “were dysfunction in this market to continue or worsen, there would be a material risk to UK financial stability.

Needless to say, by bringing up the catastrophic rule of Truss, who for at least a few days tried to impose a regime of fiscal and monetary austerity which immediately blew up the UK bond market and led to an instant market crisis, Swagel is admitting that there is nothing that can be done to reverse the growth of US debt and to make what is already an exponential chart less exponential. Quite the opposite, in fact.

And while Swagel said the U.S. is “not there yet,” he raised concerns of how bond markets could fare as interest rates have climbed. Specifically, he warned that as higher interest rates raise the cost of paying its creditors, on track to reach $1 trillion per year in 2026, bond markets could “snap back.”

Well, we have some bad news, because if one calculates total US interest on an actual, annualized basis… we don’t have to wait until 2026, we are there already and then some.

Indeed, it seems like it was just yesterday when everyone was talking about US debt interest surpassing $1 trillion (and more than all US defense spending). Well, hold on to your hats, because as of this month, total US interest is now $1.1 trillion, and rising by $100 billion every 4 months (we should probably trademark this before everyone else steals it too).

According to the CBO, US government debt is set to keep rising. “Such large and growing debt would slow economic growth, push up interest payments to foreign holders of US debt, and pose significant risks to the fiscal and economic outlook,” it said in a report last week. “It could also cause lawmakers to feel more constrained in their policy choices.”

Only that will never happen, because a politician who is “constrained” in their policy choices – one who doesn’t feed the entitlements beast in hopes of winning votes (while generously spreading pork for friends and family) – is a politician who is fired.

Perhaps afraid he would sound too much like ZeroHedge, the CBO director left a glimmer of hope, saying that the nation has “the potential for some changes that seem modest — or maybe start off modest and then get more serious — to have outsized effects on interest rates, and therefore on the fiscal trajectory.” But we doubt even he believes it.

In the CBO’s long-term budget outlook report released last week, the budget agency projected the national deficit would rise “significantly in relation to gross domestic product (GDP) over the next 30 years, reaching 8.5 percent of GDP in 2054.” Which of course, is laughable: the US deficit is already at 6.5% of GDP – a level that traditionally implied there is a major economic crisis – and yet here we are, with unemployment *reportedly* at just 3.8%. Said otherwise, the US deficit will – with 100% certainty – hit 8.5% of GDP during the next recession which will likely be triggered as soon as Trump wins the November election.

The budget scorekeeper attributed the projected growth to rising interest costs, as well as “large and sustained primary deficits, which exclude net outlays for interest.” In short, everything is already going to hell to keep “Bidenomics” afloat, but when you also throw in the interest on the debt, well.. that’s game over man.

Socialists, and other liberals who are only good at spending other people’s money and selling debt until the reserve currency finally breaks, quickly sprung to defense of the debt black hole that the US economy has become.

Bobby Kogan, senior director of federal budget policy at the communist-leaning Center for American Progress think tank, pointed to improved deficit projections in recent years, as well as forecasts from the CBO he said “don’t project anything that looks like a panic.”

“If someone were thinking about, ‘Should I panic or should I not panic?’ I would just say, ‘hey, the underlying situation has gotten better, right?’” Kogan said, adding “there’s been lower, long-term projected deficits in the Biden administration.”

Instead of responding, we will again just show the latest CBO debt forecast chart and leave it up to readers to decide if they should panic or not.

What Kogan said next, however, was chilling:  “You either should have been worried a long time ago, or you should be less worried now,” he said. “Because we’ve been on roughly the same path for forever, but to the extent that it’s different, it’s better.”

Actually no, it’s not better. It much, much worse, and the fact that supposedly “serious people” are idiots and make such statements is stunning because, well, these are the people in charge!

But he is certainly right that “you should have been worried a long time ago” – we were very worried, and everyone laughed at us, so we decided – you know what, it’s not worth the effort, may as well sit back and watch it all sink.

And now bitcoin is at a record $72,000 on its way to $1 million and gold is at a record $2,200 also on its way to… pick some nice round number…. in fact the number doesn’t matter if it is denominated in US dollars because very soon, the greenback will go the way of the reichsmark.

And just to make sure that nothing will ever change, even after the US enters the infamous Minsky Moment, shortly after the close we got this headline::

  • *UNITED STATES AA+ RATING AFFIRMED BY S&P; OUTLOOK STABLE

Because when nobody dares to tell the truth, why should anything change?

When asked about disastrous out of control spending and debt, Biden and Schumer broke into song: “Let it ride!”

Hey Big Spenders! Broken Money And Neverending Inflation (Inflation STILL At 18%)

Face it. The Federal government is broken. Congress and the Biden Administration are addicted to spending money and running up massive debts. There is no attempt at fiscal restraint because they will always argue that “More money must be spent!” On what exactly? Usually pet projects (aka, pork) like the LGBTQ retirement home in Boston for $850 thousand and $15 million for Egyptian college tuition.

How does “broken money” work? Badly. Without any fiscal restraint, politicians can just give away thousands/millions of dollars to the donor class (donate $1, get $1,000 in return). As you can see, the net worth of the top 0.1% has exploded with each ensuing “crisis.” There was the 2008/2009 financial crisis and the 2008 Covid crisis. With each crisis, the top 0.1% get richer and richer. You will note that net worth for the top 0.1% is closely related to M2 Money printing. Like, who gets the money printed by Uncle Spam? The 0.1%, of course!

Broken money leads people to store their value in sub optimal vehicles like housing. This drives the cost of real estate up unnaturally and increases the gap between the “haves” and the “have nots”. Sowing seeds of animosity. Seeds that, when left to germinate and grow via the further degradation of the money people use, blossom into ugly flowers of Anarcho Tyranny.

This has manifested in the trend of people claiming other’s houses by squatting in them when they are left unattended for an extended period of time. The preferential treatment that has been given to squatters over homeowners in recent years can be seen as the regime which controls the money printers throwing the plebs a bone as they struggle to get by, an attempt to push the productive class to violence against a state unwilling to respect private property rights, or a combination of the two.

Look at inflation if we use pre-1983 methods. Inflation is still roaring at 18%!

Broken money incentivizes governments to allow their borders to be bum rushed by cheap laborers who will take low paying jobs that enable the systemically fragile economy to keep chugging along while simultaneously increasing the chaos that already exists and diluting the values that the natives of this country believe in.

The excess and decadence enabled by a world run on broken easy money allows people to live in a detached reality that leads them to push objectively false narratives. This is why there are running debates about gender and a retreat from merit based compensation.

All of this stems from broken money.

The chart above should act as a reminder to you all that the biggest problem in the world right now is the money. The chart above should also prove to you that the most powerful people throughout the economy are going to fight tooth and nail to protect the broken money because they benefit massively from the fact that it is broken.

Keep this in mind as the chaos increases and narratives begin to form around using bitcoin as money. But we will never see inflation “normalizing” as long as Congress and Biden keep spending money.

Here are 3 of the BIG SPENDERS, Obama, Biden and Insider trader pro Pelosi. Do any of them look like the care about the bottom 50% of net worth or inflation??

Mortgage Woes Continue! Purchase Applications (Demand) Now Down 14% From Last Year

The woes for the mortgage market continue under President Magoo.

Mortgage applications decreased 1.6 percent from one week earlier, according to data from the Mortgage Bankers Association’s (MBA) Weekly Mortgage Applications Survey for the week ending March 15, 2024.

The Market Composite Index, a measure of mortgage loan application volume, decreased 1.6 percent on a seasonally adjusted basis from one week earlier. On an unadjusted basis, the Index decreased 1 percent compared with the previous week. The seasonally adjusted Purchase Index decreased 1 percent from one week earlier. The unadjusted Purchase Index decreased 1 percent compared with the previous week and was 14 percent lower than the same week one year ago.

The Refinance Index decreased 3 percent from the previous week and was 3 percent lower than the same week one year ago.

Between The Fed’s announcement of rate changes and The Biden Crime hearings in DC (where Hunter of course failed to appear), there is plenty to keep us occupied.

Hot, Hot, Hot? Inflation Hot, With Consumer Prices Up 19% Under Bidenomics (Shelter Index Increased 5.7% Over Last Year)

Unlike what Grand-dad Joey Biden screamed at the State of The Union (SOTU) address, inflation is NOT been defeated. In fact, inflation has defeated Biden and The Federal Reserve.

After January’s surprised upside shiftexpectations have been adjusted up over the last month for another sizable MoM move in headline CPI. But that was not enough as the 0.4% MoM rise in the headline (as expected – highest since August) lifted CPI YoY up to +3.2% (hotter than the 3.1% exp)…

Source: Bloomberg

The 3-month annualized CPI rate was rose to 2.8% from 1.9%. The 6-month annualized core rate dropped to 3.2% from 3.3%.

Energy costs surged MoM as Core Services inflation slowed MoM…

Source: Bloomberg

Full CPI MoM breakdown:

The index for all items less food and energy rose 0.4 percent in February, as it did the previous month.

  • The shelter index increased 0.4 percent in February and was the largest factor in the monthly increase in the index for all items less food and energy.
  • The index for rent rose 0.5 percent over the month, while the index for owners’ equivalent rent increased 0.4 percent.
  • The lodging away from home index increased 0.1 percent in February, after rising 1.8 percent in January.
  • The airline fares index rose 3.6 percent in February, following a 1.4-percent increase in January.
  • The index for motor vehicle insurance increased 0.9 percent over the month.
  • The medical care index was unchanged in February after rising 0.5 percent in January.
  • The index for hospital services decreased 0.6 percent over the month and the index for physicians’ services decreased 0.2 percent.
  • The prescription drugs index fell 0.1 percent in February.
  • The index for dental services was among those that rose in February, increasing 0.4 percent.
  • The index for personal care fell 0.5 percent in February, following a 0.6-percent increase in January.
  • The household furnishings and operations index fell 0.1 percent over the month, as did the new vehicles index.
  • Among other indexes that rose in February were apparel, recreation, and used cars and trucks.

Full CPI YoY breakdown:

The index for all items less food and energy rose 3.8 percent over the past 12 months.

  • The shelter index increased 5.7 percent over the last year, accounting for roughly two thirds of the total 12-month increase in the core CPI index
    • Feb Shelter inflation: 5.74% down from 6.04% in Jan
    • Feb rent inflation: 5.77%, down from 6.09% in Jan
  • Other indexes with notable increases over the last year include motor vehicle insurance (+20.6 percent), medical care (+1.4 percent), recreation (+2.1 percent), and personal care (+4.2 percent).

Core CPI rose 0.4% MoM (hotter than the +0.3% exp) and up 3.8% YoY (hotter than the +3.7% exp), but still the lowest since April 2021…

Source: Bloomberg

The 3-month annualized Core CPI rate was rose to 4.1% from 3.9%. The 6-month annualized core rate rose to 3.8% from 3.5%.

Core Goods actually rose MoM for the first time since June 2023…

Goods deflation continues (-0.3% YoY) but has flattened out, while services inflation remains stubbornly high at +5.2% YoY…

Source: Bloomberg

And one step deeper – the so-called SuperCore: Core CPI Services Ex-Shelter index – soared 0.5% MoM up to 4.5% YoY – the hottest since May 2023…

Source: Bloomberg

While SuperCore CPI slowed MoM, there was a large jump in Transportation Services MoM…

Source: Bloomberg

Finally, we note that consumer prices have not fallen in a single month since President Biden’s term began (July 2022 was the closest with ‘unchanged’), which leaves overall prices up 19% since Bidenomics was unleashed. And prices have never been more expensive…

Source: Bloomberg

That is an average of 5.6% per annum (more than triple the 1.9% average per annum rise in price during President Trump’s term).

So, about that shrinkflation – did companies only ‘get greedy’ when Biden took office?

But it gets worse, real wage growth has lagged significantly for the average joe in America…

Source: Bloomberg

Despite a very modest decline in Feb, Food costs are up over 21% since Biden’s term began, but non-supervisory wages are up only 18%.

Bidenomics for the win!

Are we going to see a replay on the ’70s?

Source: Bloomberg

The market narrative of slow and steady disinflation just broke harder.

…or are we still set for a massive wave of depressionary deflation?

Inflation remains hot, hot, hot although Biden/Yellen will undoubtedly say that it is lower than last year. But remember, consumer prices are up a staggering 19% under Bidenomics. THAT is a major tax of those making under $200,000 per year, Joey.

The Ides Of March! New York Community Bancorp Collapsing (Small Bank Delinquency Rate Hits 7.80%, Highest On Record!)

Yes, it is the Ides of March. No, not Nikki Haley trying to sabotage Donald Trump’s campaign after Nikki got clobbered in all but two state primaries. So in a sour grapes move, Haley didn’t endorse Trump. But the Ides of March refers to the stabbing of Julius Caesar (led by Brutus).

Once the darling of the small banking crisis comeback, New York Community Bancorp has crashed 45% to fresh 30 year lows after The Wall Street Journal reports the bank is seeking to raise equity capital in a bid to shore up confidence in the troubled regional lender.

According to people familiar with the matter, NYCB has dispatched bankers to gauge investors’ interest in buying stock in the company.

There’s no guarantee there will be a deal, or that one would succeed in addressing the bank’s challenges, which as of Wednesday morning had led to a roughly 80% decline in its stock price since January.

This is not a good picture for a bank… Would you hold your deposits there?

Last month, DiNello laid out a series of options the bank could explore to bolster its balance sheet, including selling assets from certain non-core businesses. The bank has also considered turning to newfangled financial instruments that would share the risks of those loans with outside investors, people familiar with the matter said.

As WSJ reportsfinding takers for those assets, at least at prices that would make a deal worthwhile, has been challenging and U.S. officials have expressed reservations with banks pursuing credit-risk transfers that would shift the burden of potential losses to entities outside of the regulated banking system.

Finally, as a reminder, NYCB is not alone. The red line below shows ‘small banks’ are in trouble absent The Fed’s BTFP facility…

Oh, and this is fine…

The delinquency rate among large banks hits 3%, the highest in 11 years. The delinquency rate among small banks hits 7.80%, the highest on record.

And perhaps that’s why the broad regional bank index is also getting hit today…

Beware the Ides of March as RRP liquidity evaporates.

Think this is isolated? Please disburse. Nothing to see here!

Stall Speed! How Bidenomics Has Caused Mortgage Demand To Stall, Mortgage Applications Down 5.6% From Last Week (Inflation + Fed = Mortgage Rates Above 7%)

The mortgage market has reached stall speed thanks to Bidenomics (inflation begat Fed tightening that begat 7%+ mortgage rates).

Mortgage applications decreased 5.6 percent from one week earlier, according to data from the Mortgage Bankers Association’s (MBA) Weekly Mortgage Applications Survey for the week ending February 23, 2024.

The Market Composite Index, a measure of mortgage loan application volume, decreased 5.6 percent on a seasonally adjusted basis from one week earlier. On an unadjusted basis, the Index decreased 3 percent compared with the previous week.  The seasonally adjusted Purchase Index decreased 5 percent from one week earlier. The unadjusted Purchase Index decreased 1 percent compared with the previous week and was 12 percent lower than the same week one year ago.

The Refinance Index decreased 7 percent from the previous week and was 1 percent lower than the same week one year ago.

The average contract interest rate for 30-year fixed-rate mortgages with conforming loan balances ($766,550 or less) decreased to 7.04 percent from 7.06 percent, with points increasing to 0.67 from 0.66 (including the origination fee) for 80 percent loan-to-value ratio (LTV) loans.

Stop, Stop, Stop … Printing! Consumer Purchasing Power Down 97% Since Fed Creation (1913) And Down 16% Under Biden (M2 Money Velocity And Debt Velocity STINK!)

The Hollies said it best: Stop, stop, stop. FIAT Money Printing that is.

Typically, we look at M2 Money Velocity (GDP/M2) as a measure of how much the economy grows by expanding the money supply.

M2 Money Velocity is currently at 1.344, and still below where we were under Trump prior to Covid. After Powell printing palooza after Covid, M2 Money Velocity collapsed and is slowly rising, but remains low by historic standards.

Perhaps a more interest velocity is DEBT velocity (GDP/DEBT). Under Biden’s Reign of Error, Federal debt has increased by $6,539,359 million while real GDP has increased by only $1,948.731 billion (or roughly $2 trillion in GDP growth after $6.54 trillion in debt). Or a DEBT velocity of 0.3. Yikes! No wonder China is bailing on US debt!

This chart makes debt issuance look better than it really is. Again, the DEBT VELOCITY of 0.3 is terrible meaning that for every $1 of Federal debt, we get 30 cents in Real GDP under Biden. One of my macroeconomics textbooks stated that debt growth is fine as long as real GDP growth rises faster than debt growth. Apparently, Treasury Secretary Janet Yellen didn’t read that textbook! Real GDP has grown by 9.43% under Biden while Federal debt has grown by … gulp .. 24%.

Yes, the US is borrowing like the proverbial drunken sailor while they “invest” in green energy, wars in Ukraine and the Middle East, and massive social welfare programs (like the old breads and circuses from the dying Roman Empire). When watching the media’s obsession with Taylor Swift and Chief’s Tight End Travis Kelce at The Super Bowl, it reminded me of “Breads and Circuses” as our nation is collapsing like a dying star. (That is why I Iike Gold, Silver and Bitcoin!)

What about The Federal Reserve? It was created in 1913 after signed into existence by President Woodrow Wilson. Since The Fed’s inception, consumer purchasing power has declined by 97%.

And under Biden, inflation has been so bad that consumer purchasing power is down 16%.

In summary, The Federal Reserve has been printing like crazy (I would say Batshit Crazy, but I actually think bats are adorable). And Treasury (under former Fed Chair Janet Yellen) has been borrowing like crazy too. While politicians claim the economy is in great shape, it is really because The Fed is printing wildly, Yellen is borrowing wildly, and much of US GDP is not due to the private sector, but Federal government spending … to the donor class. This is NOT a sustainable and will eventually crash into a ravine.

Here is an excellent interview with Col. Douglas MacGregor who talks about Bitcoin.

Goodbye Free Markets! Biden’s EV Mandate “Vision” For America Is In Full Collapse (Gasoline Prices UP 46.25% Under Biden, Diesel Prices UP 55.6%)


Goodbye free markets! Hello heavy-handed government cronyism.

So, despite recent declines in energy prices, gasoline prices are still up 46.25% under “Green Joe” and the all important for shipping, diesel prices, are still up 55.6% under Brainless Joe.

One would think that massive rises in gasoline and diesel prices would make everyone buy an electric vehicle (EV). But alas, the high cost and unreliability of EVs is turning off consumers. (I own a hybrid and wish I didn’t).

Another one of the Biden administration’s “visions” for forcing people to own electric vehicles isn’t working out exactly as planned.

This time it deals with supply chain logistics, with Bloomberg reporting this week that in the year and a half since passing the Inflation Reduction Act, automakers are finding out the hard way that the rigorous criteria for manufacturing batteries using materials from the United States and its free-trade allies could render them cost-inefficient compared to global competitors.

Companies like Tesla are instead taking advantage of a temporary shift in the rules to stock up with cheaper batteries from countries like China.

The Biden administration’s new rules will all but cut out China from the supply chain, however, which will make it tougher to find affordable metal suppliers.

This, in turn, will threaten President Biden’s goal to boost the domestic electric vehicle market. Bloomberg writes that mining companies and labor unions insist that without curtailing the influx of cheaper, Chinese-subsidized materials, the U.S. can’t develop a competitive EV market.

Meanwhile, the higher costs are driving automakers away from EVs. And as battery material requirements are set to double by 2027, fulfilling these mandates will be increasingly difficult, putting Biden’s ambitious EV strategy at risk.

The demand side of the equation also looks less than favorable. We wrote just hours ago about how Ford was slashing prices on its Mach E and Lightning 150. Tesla has been slashing prices to stoke demand for nearly a year now. 

Both Ford and GM have said they’re going to curtail their investment in EVs. General Motors, who posted better than expected earnings earlier this month, said that it plans on changing its product lineup to include more hybrid vehicles, drifting away from pure electric vehicles. 

CEO Mary Barra said on the earnings call: “Let me be clear, GM remains committed to eliminating tailpipe emissions from our light-duty vehicles by 2035, but, in the interim, deploying plug-in technology in strategic segments will deliver some of the environment or environmental benefits of EVs as the nation continues to build this charging infrastructure.”

Recall, a report from Consumer Reports last year found that electric vehicles have almost 80% more problems and are “generally less reliable” than conventional internal combustion engine cars. 

But hey, what good is a “free” market if the government doesn’t have complete and total control of consumer choice, right Joe? After all, Biden drives a gas guzzling Chevy Corvette. When Biden sells his Corvette and buys a Chevy Bolt, I might believe him. Nah!

So, the free market is standing up to Biden’s hard left tyranny.

My new nickname for Biden is Dopey. And Kamala Harris is Happy (because she laughs constantly). Mayorkas is Bashful (he doesn’t do anything). NY Senator Chuck Schumer is Grumpy. Jill Biden is Doc (for her pathetic PhD in Education). The intellectual seven dwarves are running our country into the ground.