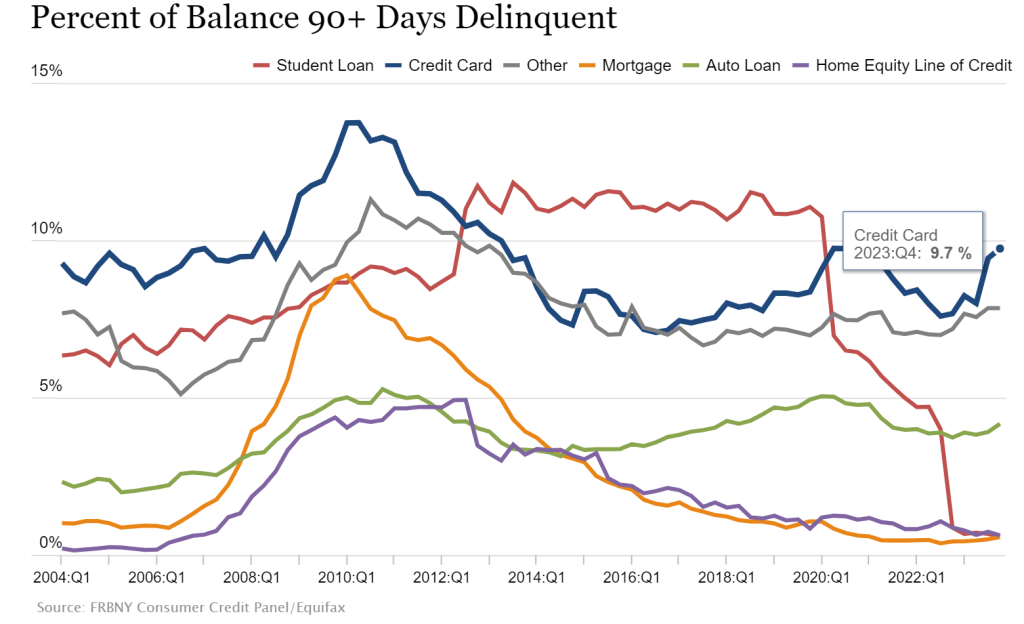
Credit card delinquecies (90+ days) rose to almost 10% in Q4 2023.
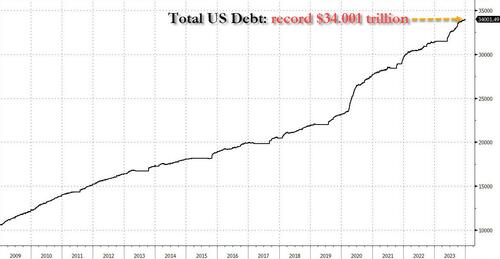
Credit card delinquencies surged more than 50% in 2023 as total consumer debt swelled to $17.5 trillion, the New York Federal Reserve reported Tuesday.
Debt that has transitioned into “serious delinquency,” or 90 days or more past due, increased across multiple categories during the year, but none more so than credit cards.
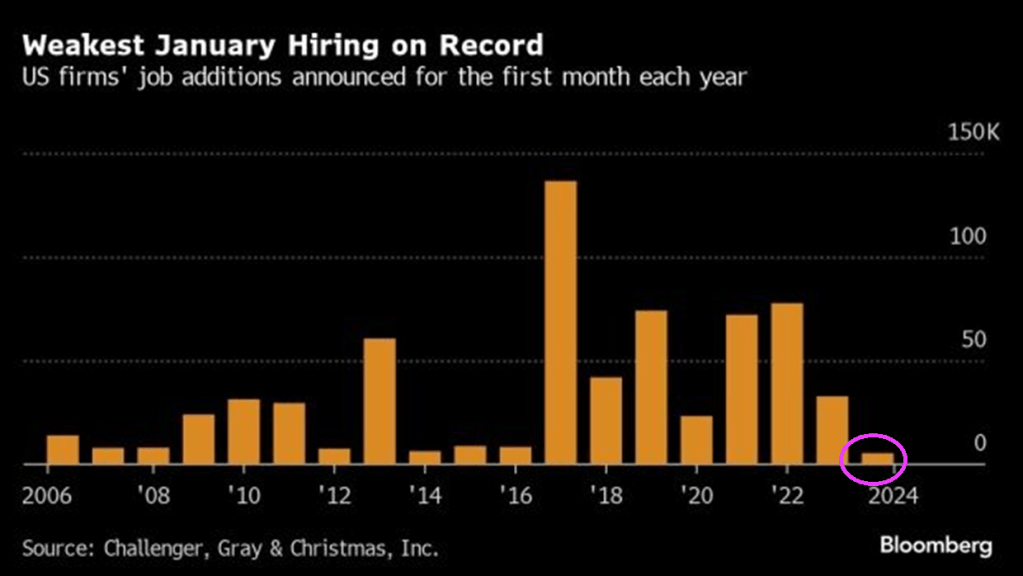
Rising credit card delinquencies combined with the worst job additions in January on record.
But at least the 10Y-2Y US Treasury yield curve is ALMOST flat (h
The great Will Rogers once said he never met a man he didn’t like. US President Joe Biden and Democrats have never met a spending opportunity they didn’t like (except for US border security, of course).
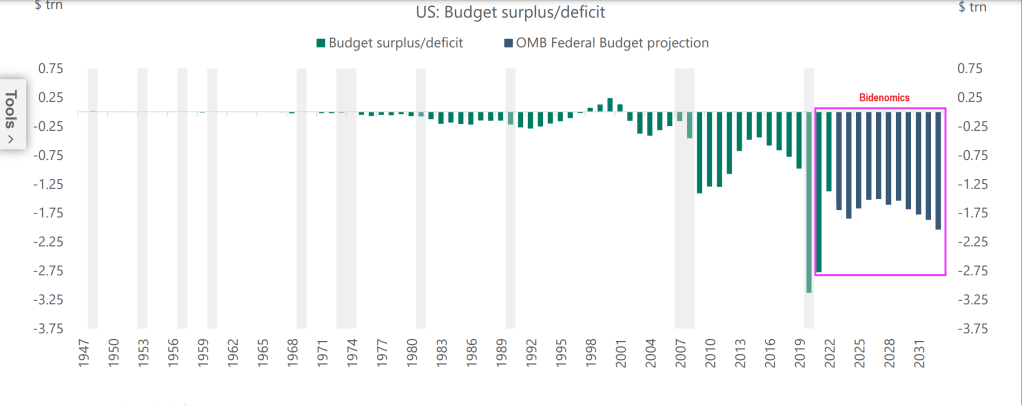
Under “Deficit Joe” Biden, Federal budget deficits have soared! And deficits are projected to grow!
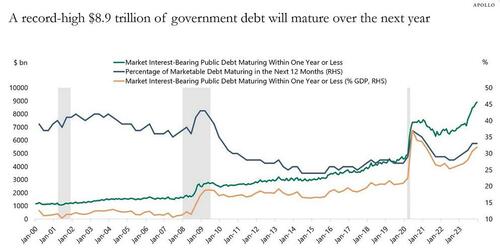
The problem, as Apollo’s gloomy chief strategist Torsten Slok points out, is that this feverish pace will only accelerate further, as a record $8.9 trillion of government debt will mature over the next year.
Meanwhile, the government budget deficit in 2024 will be $1.4 trillion according to the CBO (realistically expect this number to hit $2.0 trillion), and the Fed has been running down its balance sheet by $60 billion per month.
The bottom line is that someone will need to buy more than $10 trillion in US government bonds in 2024. That is more than one-third of US government debt outstanding. And more than one-third of US GDP.
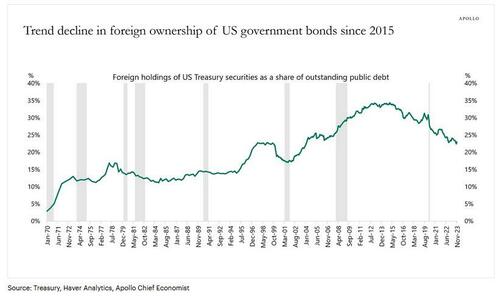
This may be a particular challenge when the biggest holders of US Treasuries, namely foreigners, continue to shrink their share.
More fundamentally, Slok muses, “interest rate-sensitive balance sheets such as households, pension, and insurance have been the biggest buyers of Treasuries in 2023, and the question is whether they will continue to buy once the Fed starts cutting rates.”
(Spoiler alert: no… but that’s what QE is for, and sooner or later, it’s coming back).
Apollo’s latest updated outlook on Treasury demand is below (pdf link).
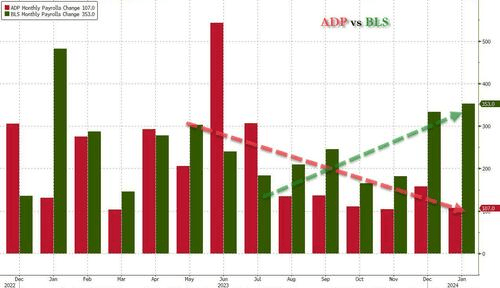
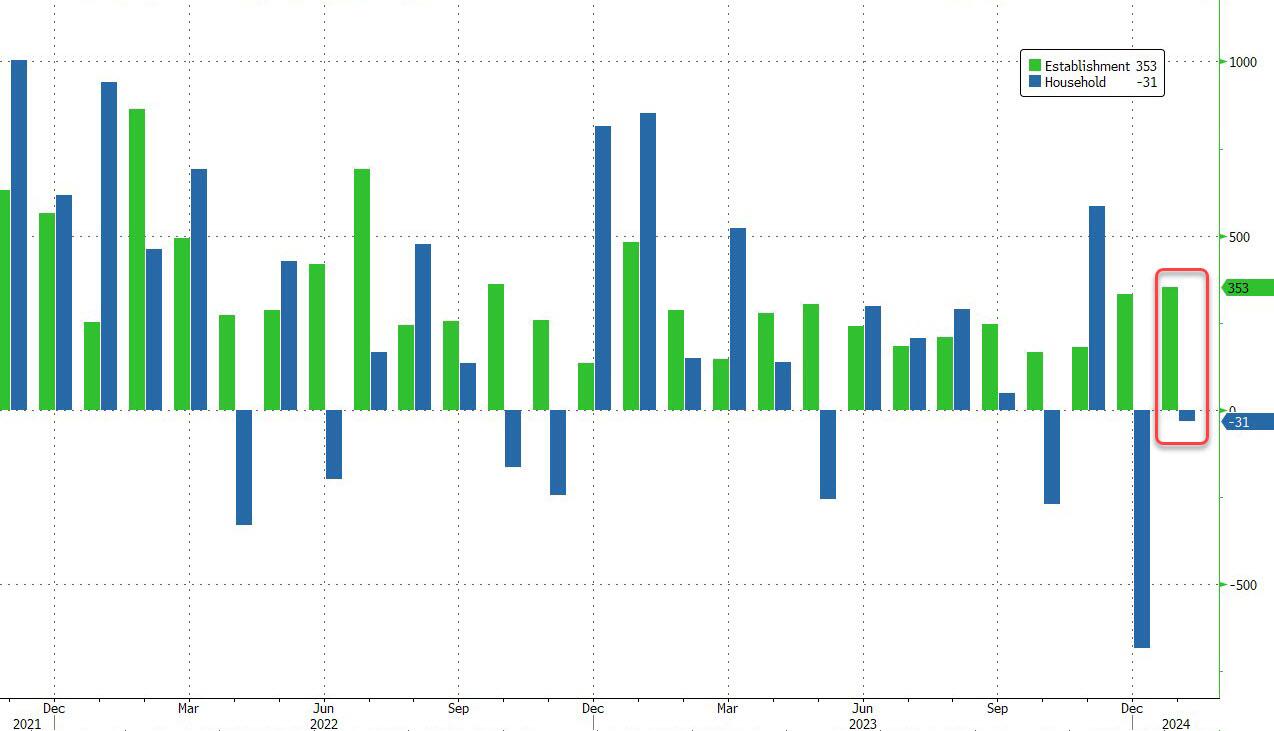
Today’s jobs report was UGLY! How when the US unexpectedly added 353K “jobs” – the most since January 2023. Remember, Biden is President. And apparenty El Presidente of Latin America, Africa and Asia.
Let me start with the official Biden jobs report versus the ADP jobs report from yesterday. BLS showed an amazing surge while ADP was sigalling a slowdown. Obviously, BLS is measuring employment differently (this is an election year after all). Like seasonal adjustments (always econometric voodoo).
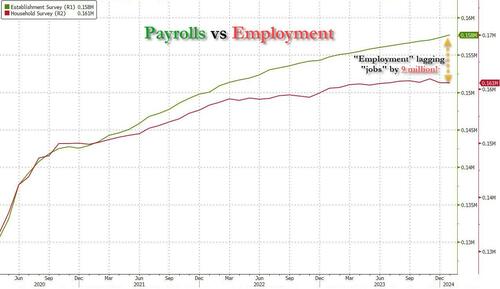
But it’s more than just the Biden admin hanging its “success” on seasonal adjustments: when one digs deeper inside the jobs report, all sorts of ugly things emerge… such as the latest divergence between the Establishment (payrolls) and much more accurate Household (actual employment) survey. To wit, while in January the BLS claims 353K payrolls were added, the Household survey found that the number of actually employed workers dropped again, this time by 31K (from 161.183K to 161.152K).
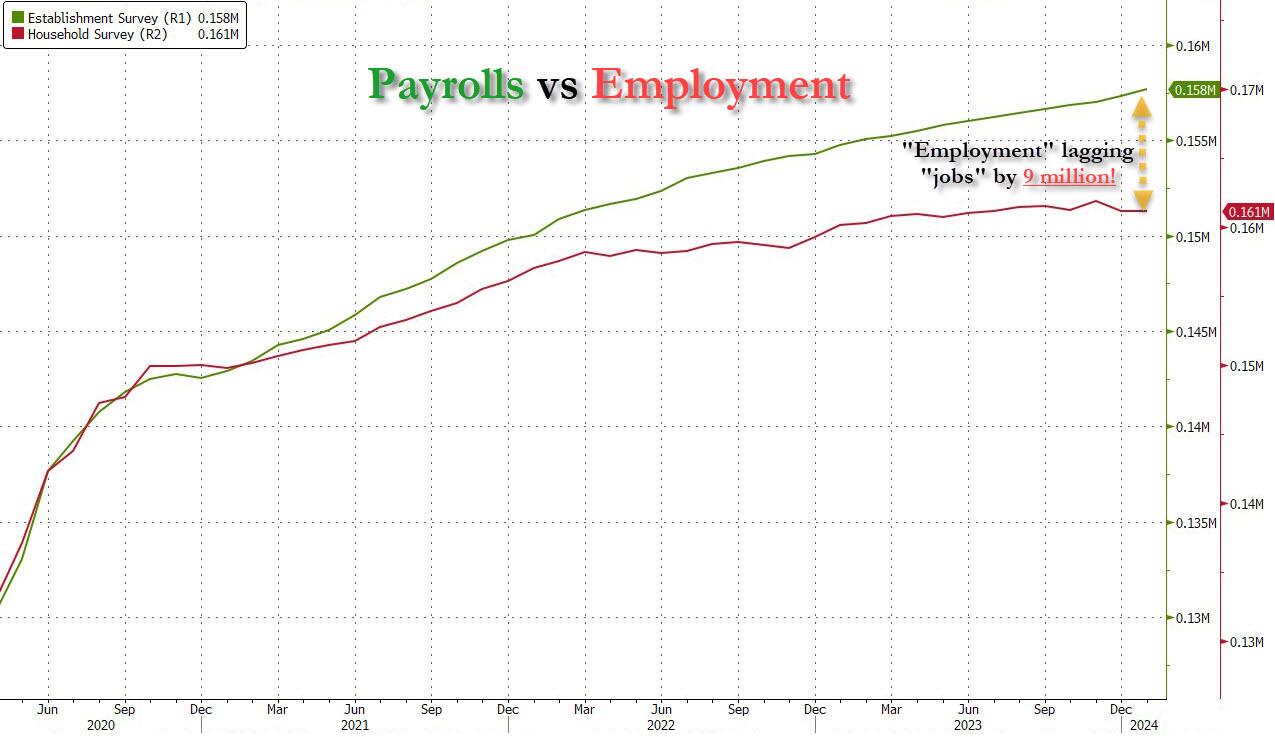
This means that while the Payrolls series hits new all time highs every month since December 2020 (when according to the BLS the US had its last month of payrolls losses), the level of Employment has barely budged in the past year. Worse, as shown in the chart below, such a gaping divergence has opened between the two series in the past 4 years, that the number of Employed workers would need to soar by 9 million (!) to catch up to what Payrolls claims is the employment situation.
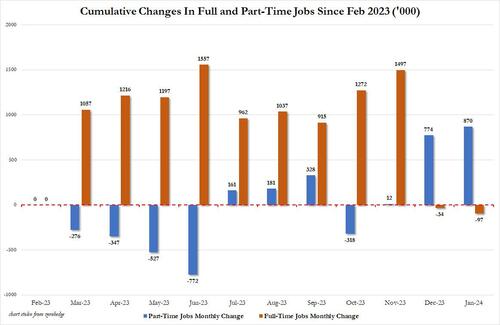
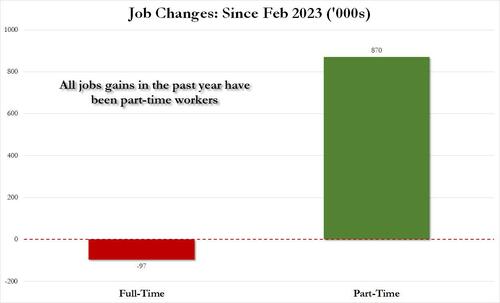
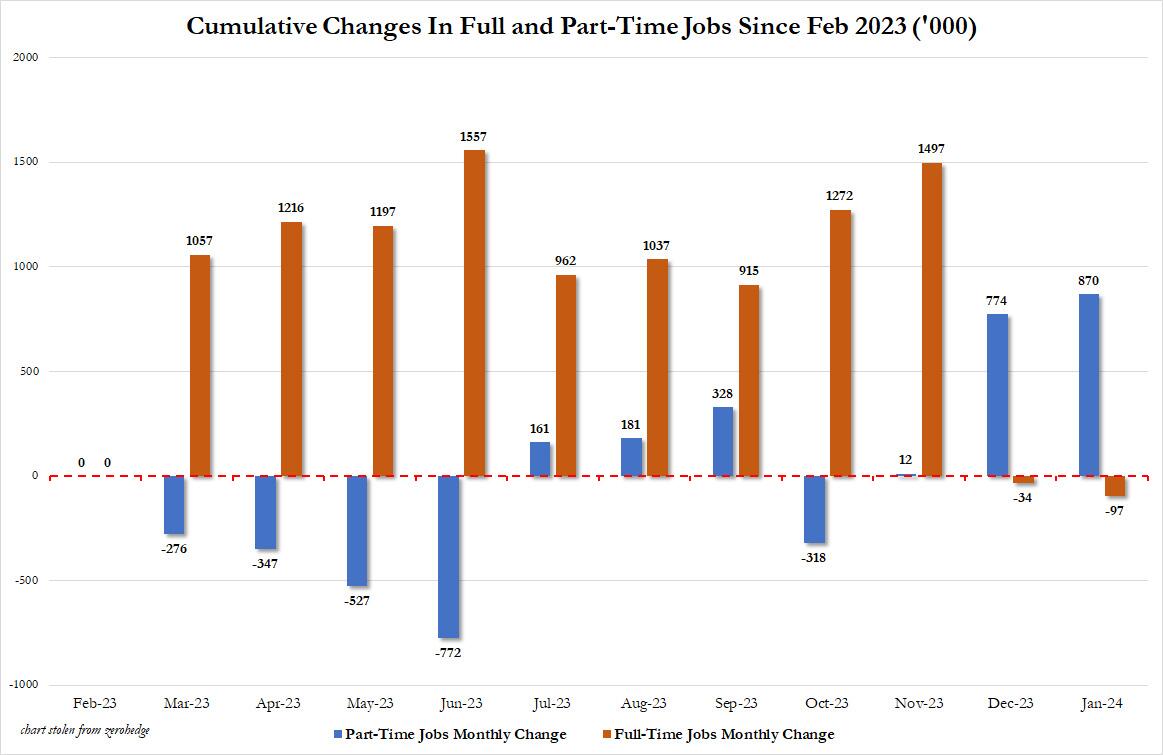
There’s more: shifting from a quantitative to a qualitative assessment, reveals just how ugly the composition of “new jobs” has been. Consider this: the BLS reports that in January 2024, the US had 133.1 million full-time jobs and 27.9 million part-time jobs. Well, that’s great… until you look back one year and find that in February 2023 the US had 133.2 million full-time jobs, or more than it does one year later! And yes, all the job growth since then has been in part-time jobs, which have increased by 870K since February 2023 (from 27.020 million to 27.890 million).
Here is a summary of the labor composition in the past year: all the jobs have been part-time jobs!
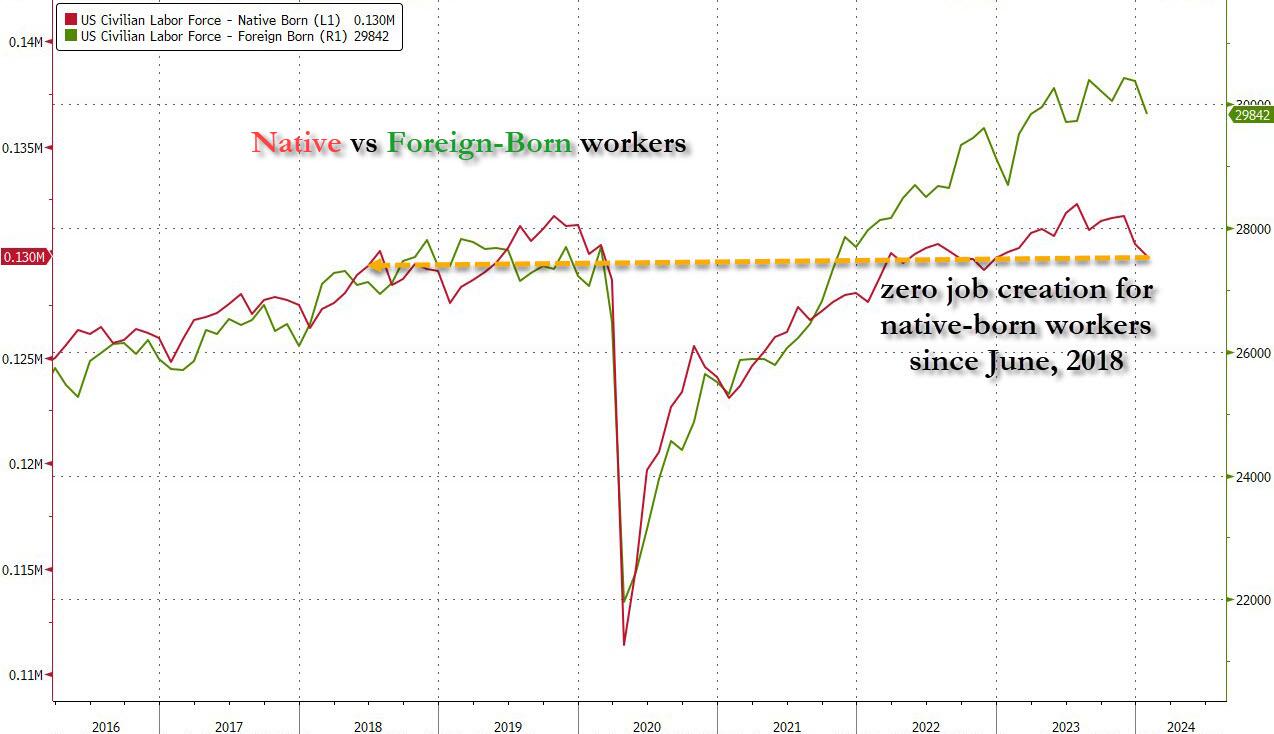
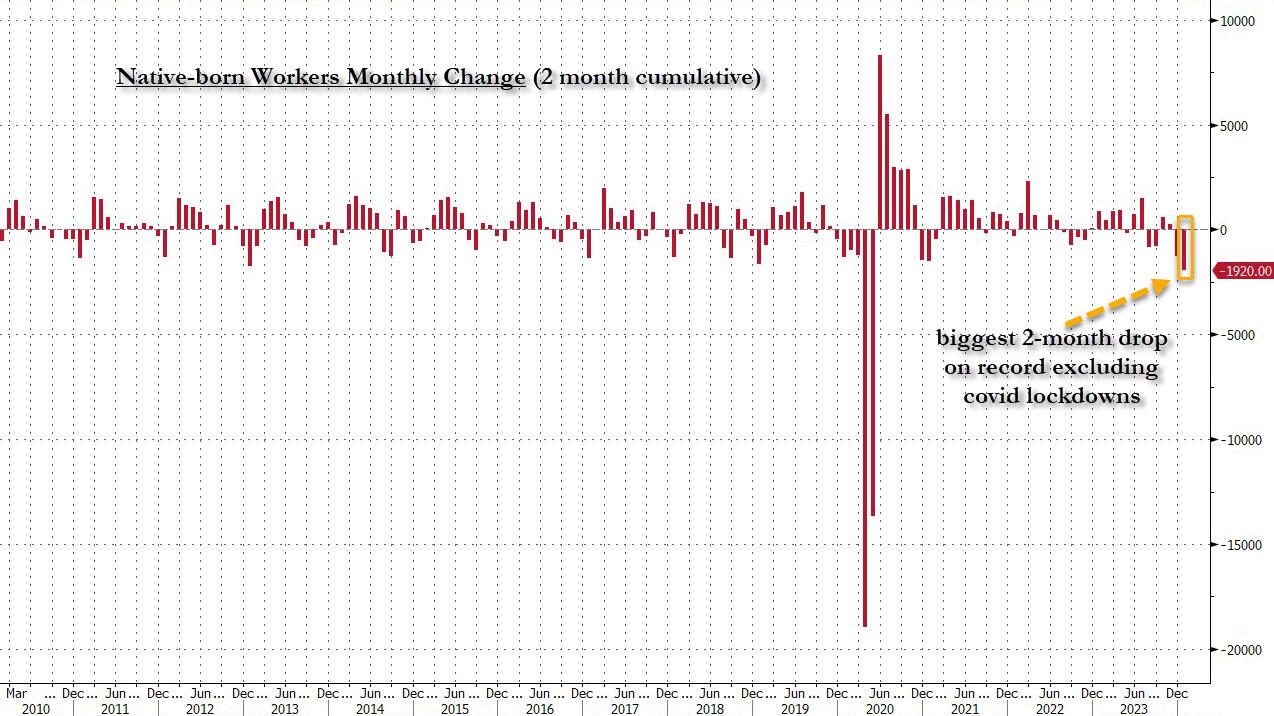
But wait there’s even more, because just as we enter the peak of election season and political talking points will be thrown around left and right, especially in the context of the immigration crisis created intentionally by the Biden administration which is hoping to import millions of new Democratic voters (maybe the US can hold the presidential election in Honduras or Guatemala, after all it is their citizens that will be illegally casting the key votes in November), what we find is that in January, the number of native-born worker tumbled again, sliding by a massive 560K to just 129.807 million. Add to this the December data, and we get a near-record 1.9 million plunge in native-born workers in just the past 2 months!
Said otherwise, not only has all job creation in the past 4 years has been exclusively for foreign-born workers, but there has been zero job-creation for native born workers since July 2018!
This is a huge issue – especially at a time of an illegal alien flood at the border – and is about to become a huge political scandal, because once the inevitable recession finally hits, there will be millions of furious unemployed Americans demanding a more accurate explanation for what happened – i.e., the illegal immigration floodgates that were opened by the Biden admin.
Which is also why the Biden admin will do everything in his power to insure there is no official recession before November… and is why after the election is over, all economic hell will finally break loose. Until then, however, expect the jobs numbers to get more and more ridiculous.
I wonder if “Union Joe” is telling US labor union about no growth for native (American born) workers.
“Progress on inflation has brightened the economic picture despite a slowdown in hiring and pay. Wages adjusted for inflation have improved over the past six months, and the economy looks like it’s headed toward a soft landing in the U.S. and globally,” says Nela Richardson, Chief Economist, ADP.
ADP National Employment Report
The ADP National Employment Report shows Private Sector Employment Increased by 107,000 Jobs in January; Annual Pay was Up 5.2%
Job Switching Payouts
Year-over-year pay gains for job-stayers reached 5.2 percent in January, down from 5.4 percent in December.
For job-changers, pay was up 7.2 percent, the smallest annual gain since May 2021.
Median Change in Annual Pay (ADP matched person sample) Job-Stayers 5.2%, Job-Changers 7.2%
ADP Notice
January’s report presents the scheduled annual revision of the ADP National Employment Report, which updates the data series to be consistent with the annual Quarterly Census of Employment and Wages (QCEW) benchmark data for March 2023. In addition, this revision introduces technical updates, namely, in re-weighting of ADP data to match QCEW data. The historical file was updated to reflect these revisions.
Notice Translation
ADP revises its data to match annual BLS data from March of 2023. The BLS will do the same in its annual revisions.
The BLS does not even back adjust the numbers so its historical record is bogus. And despite being incredibly lagging, the Fed makes key decisions on the data.
Job Openings Rise in December But Quits Tell the Real Story
There’s lots of meaningless chatter yesterday about job openings. However, actions speak louder than openings.
This report comes after Fed Chair Jerome Powell said “No Sugar Tonight” as in no expected rate cuts. That is, until it becomes obvious that Biden will lose the election, THEN The Fed will start cutting rates like crazy.
An example of the trash that Biden and Democrats are importing from Latin America, Africa and China. Among other sewers. I am sure that employers are lining up to hire this guy. … NOT! Correction: Biden may appoint this creep to his cabinet with the other losers.
Constitution Avenue in Washington DC is actually becoming Tobacco Road. No, not the dysfunctional family of Georgia sharecroppers during the Great Depression, but the Treasury Borrowing Advisory Committee (TBAC).
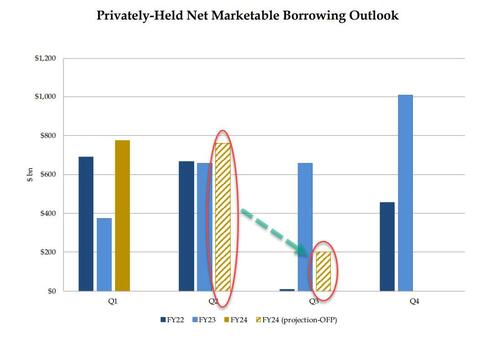
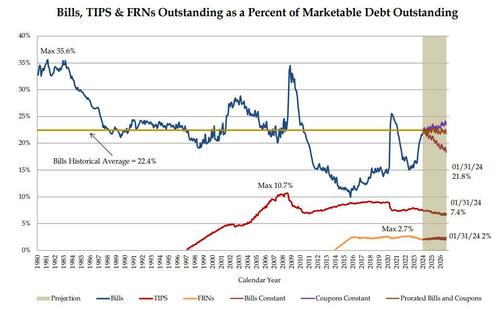
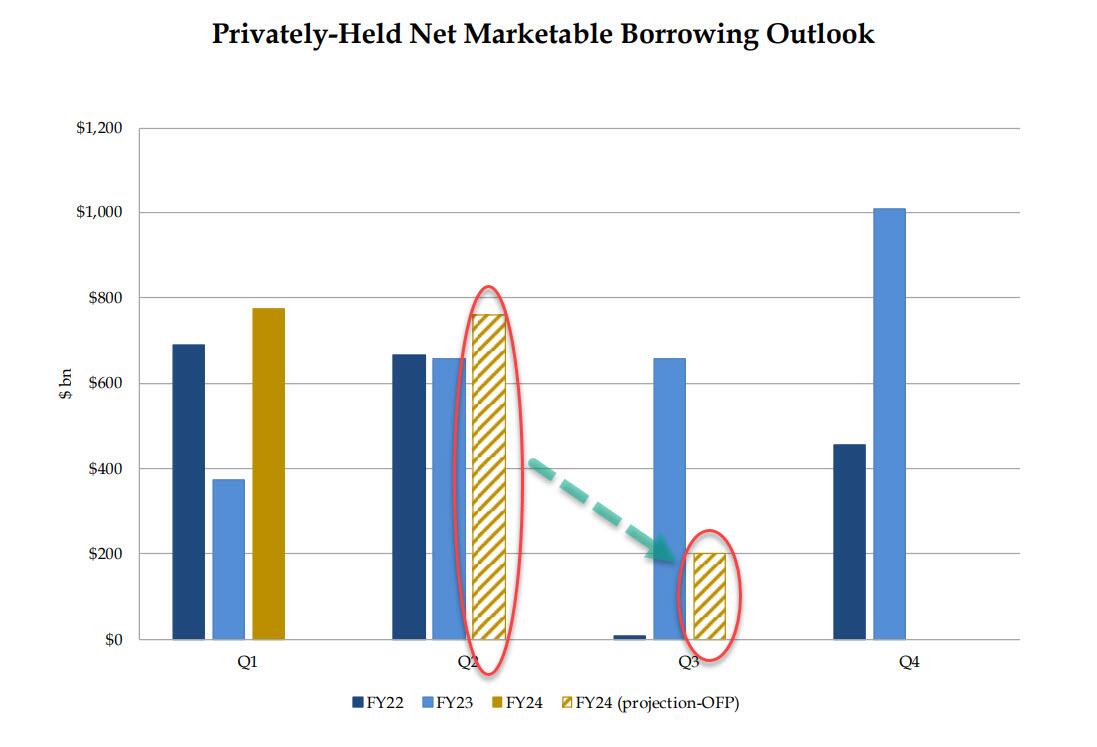
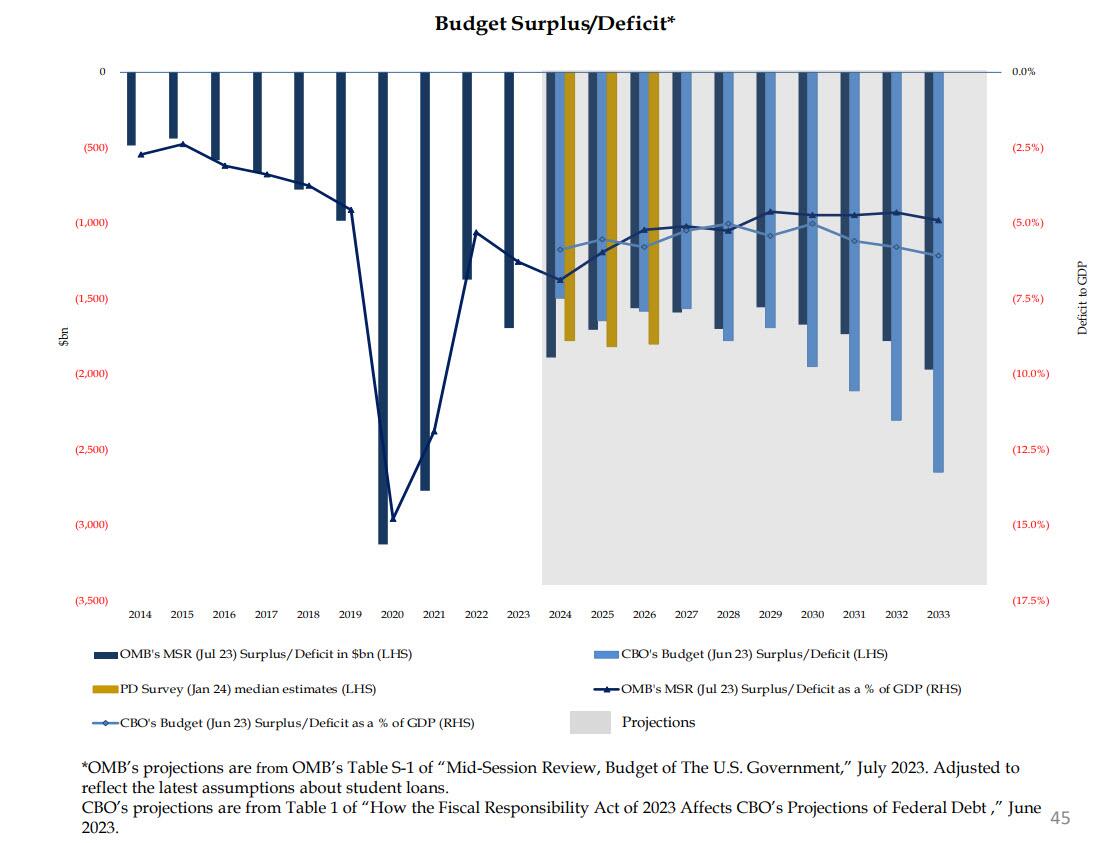
… yields tumbled as this was viewed as an aggressively dovish outlook on the future of i) the US fiscal deficit and ii) the debt needed to fund said deficit. Here is another way of visualizing the US historical and projected marketable debt funding needs:
Commenting on this surprise drop in expected borrowing, on Monday we said that “the numbers also mean that the Reverse Repo facility will be fully drained by Q2, and we expect that on Wednesday we will learn that the bulk of the reduction in Q1 and Q2 estimates will be due to sharply lower Bill issuance for one simple reason: there is just no more Reverse Repo cash to buy it all.“
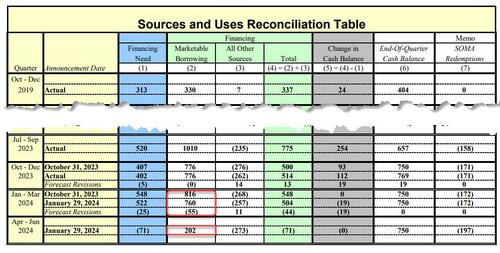
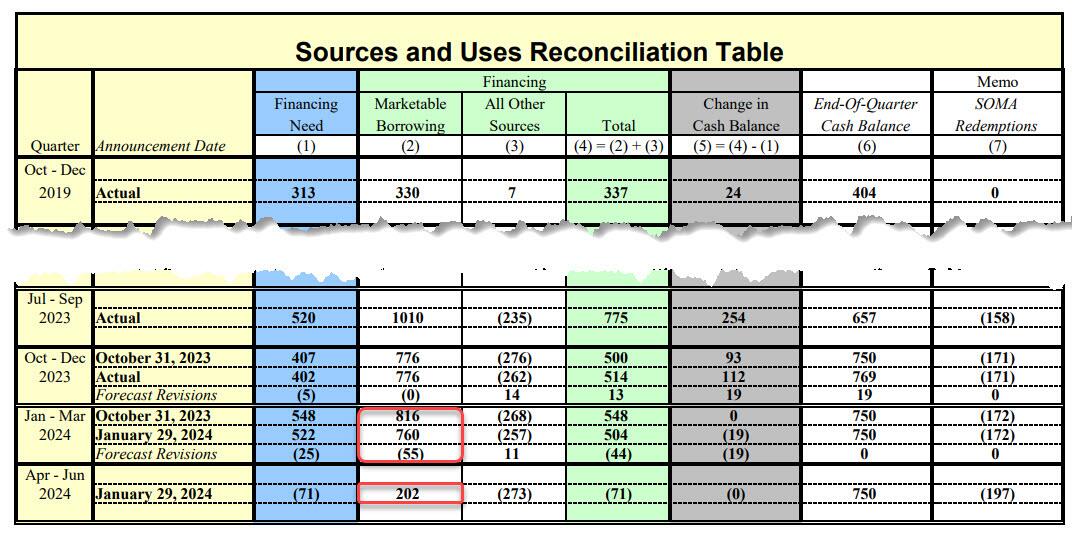
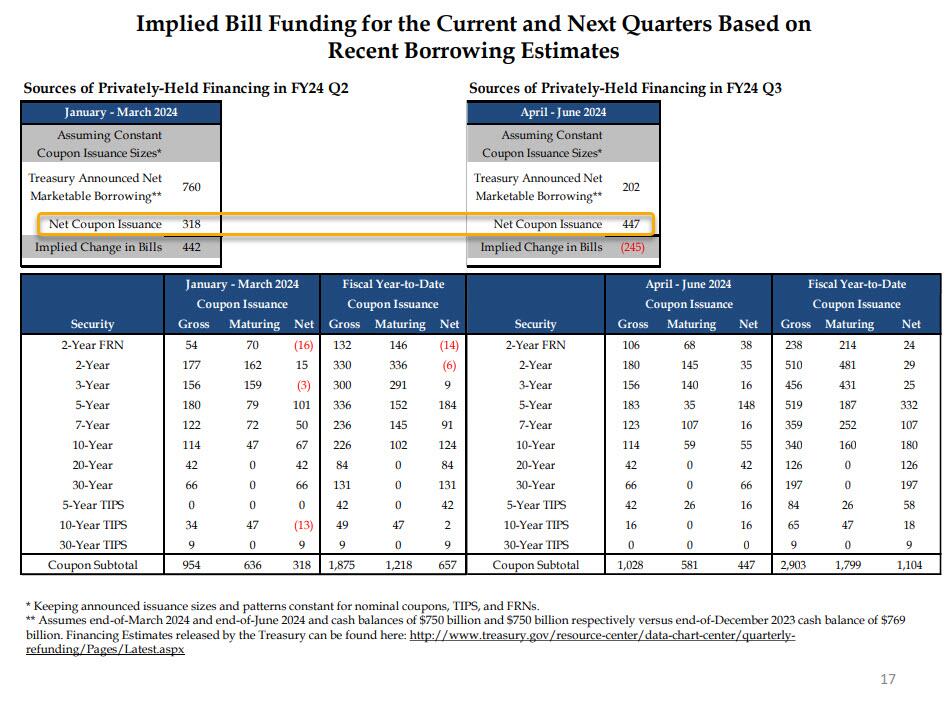
Boy, were we right: earlier today, in the Treasury’s presentation to the Treasury Borrowing Advisory Committee (TBAC) as part of the Quarterly Refunding, Janet Yellen revealed what the composition of this sharp drop in Q2 funding needs would be. As we expected, it was all bills!
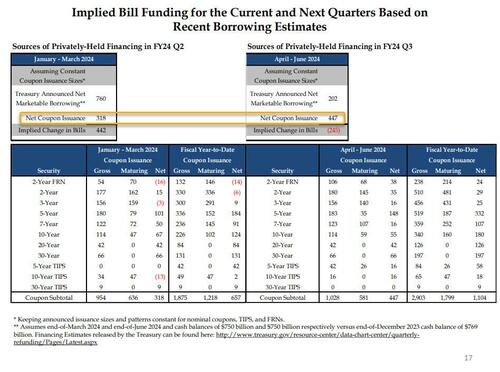
In fact, as the chart below – which we have dubbed the scariest chart in the Treasury’s presentation to TBAC today (link here) – shows, with Bills expected to fund some $442 Billion of the $760BN funding deficit in the Jan-March quarter (the balance of $318BN funded by coupons), in Q2 the Treasury now anticipates a $245BN DECLINE in net Bills outstanding (i.e., not only no incremental Bill funding but a quarter trillion maturity in Bills outstanding). In other words, while we expected a “sharply lower” Bill issuance in Q2, the Treasury is actually expecting a $245BN drawdown in Bills.
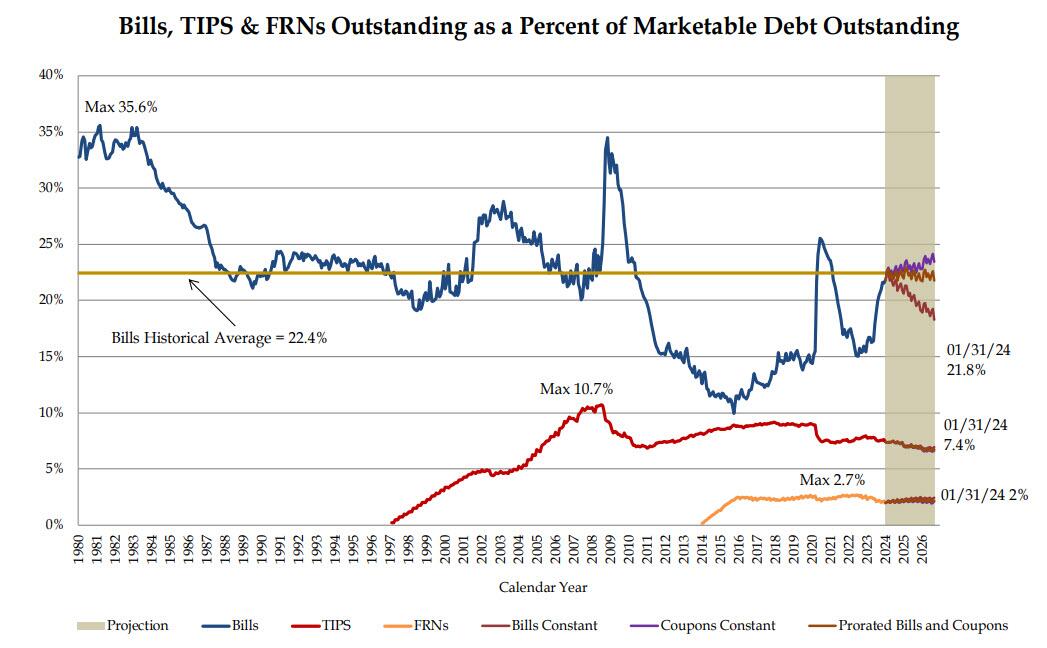
But wait, there’s more: because while the market was expecting some pro rata decline in coupon issuance to go with the slide in net Bills (we were not) in Q2 to justify the sharp drop in long-end yields, it was not meant to be. In fact, just the opposite, because as highlighted in the chart above, net Coupon issuance in Q2 is actually expected to increase by $130BN to $447BN from $318BN in Q1. This is a huge shift in higher duration supply, and is hardly what all those who were buying 10Y bonds on Monday were expecting, and yes, that too was to be expected: with Bills now well above the “comfortable” ceiling of 20% as a percentage of total debt outstanding, the Treasury had no choice but to roll it back, especially since the Reverse Repo is already mostly drained. And sure enough, in its presentation, the Treasury no longer anticipates a flood of Bill issuance in the future.
That’s not all: while the Treasury said it does “not anticipate needing to make any further increases in nominal coupon or FRN auction sizes, beyond those being announced today, for at least the next several quarters”, the TBAC politely disagreed, stating that “it may be appropriate over time to consider incremental increases in coupon issuance depending on how the current uncertainty regarding borrowing needs evolves” (translation: as the need to bribe the population with more fiscal stimmies ahead of November rises, so will borrowing needs).
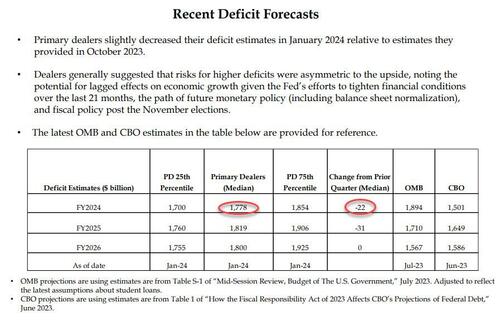
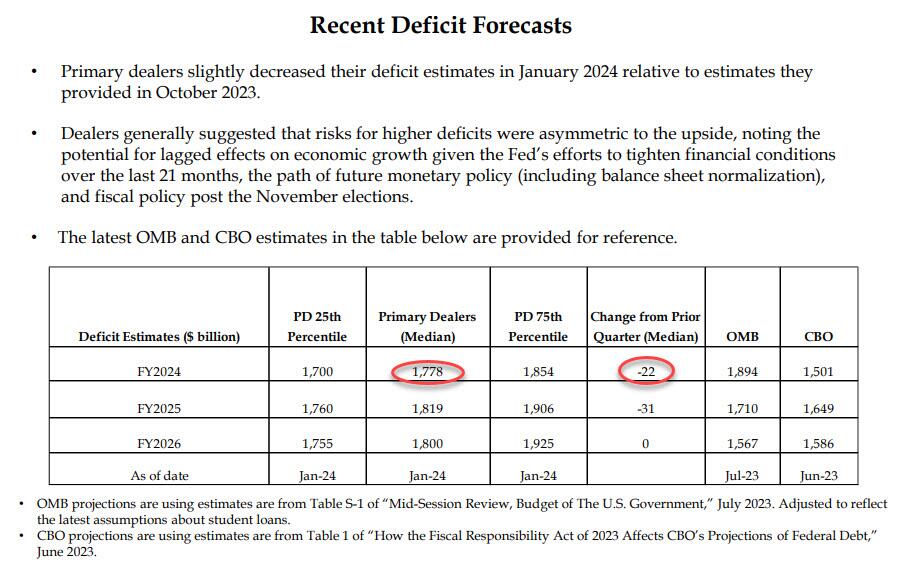
As for any naive expectations that any decline in issuance in structural instead of merely shifting away from Bills to Coupons, we have some more bad news: as the table below confirms, the Primary Dealer estimate of the US 2024 budget deficit dropped just $22BN in the past quarter, from $1.8 trillion to $1.778 trillion, a meaningless change (expect this number to rise sharply as the full brunt of fiscal stimulus in an election year become visible).
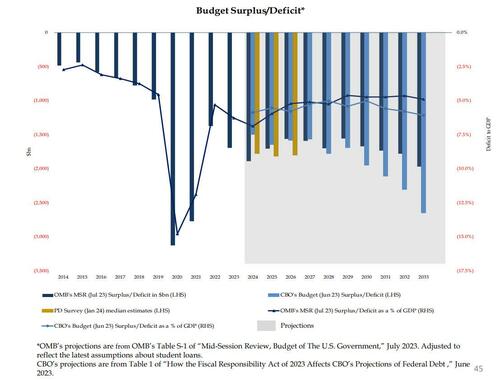
As for the bigger picture, well you can listen to either the Primary Dealers…
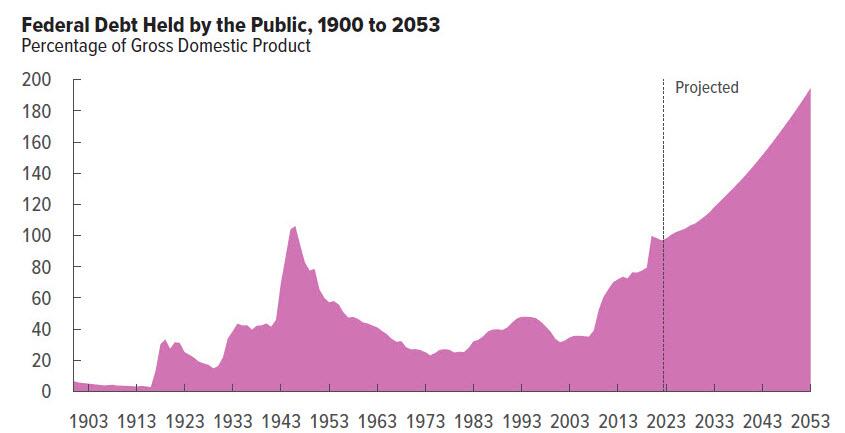
… or the CBO:
Both reach the same sad conclusion, the same one voiced by Nassim Taleb on Monday when he said that “we need something to come in from the outside, or maybe some kind of miracle…. This makes me kind of gloomy about the entire political system in the Western world.”
Sorry, Nassim, no miracles… just lots and lots of money printing coming.
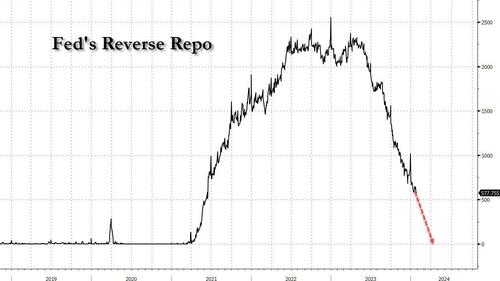
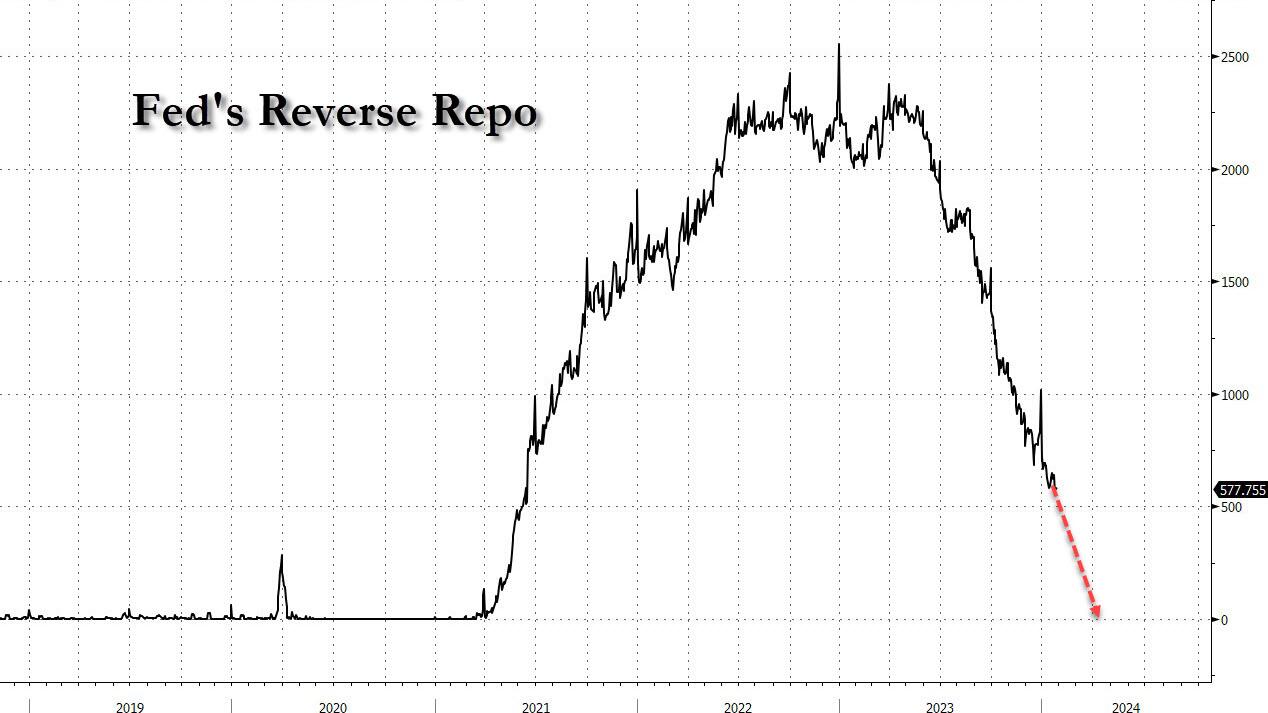
And speaking of money printing, the fact that Bill issuance is about to grind to a halt in Q2 means that, just as we expected, reverse repo balances will tumble in the remaining two months of Q1…
… bringing it effectively to zero (which means the Treasury’s stock market liquidity pump is now almost drained), at which point the Fed will have to take over and taper QT as the alternative would be draining some $100BN in reserves every month at a time when total Fed reserves are already at the level which Waller hinted may be the infamous LoLCR floor which is a hard constraint at “10-11% of GDP.” The alternative is simple: a stock market crash just months before the November election, hardly the stuff Biden’s handlers or the anti-Trump Deep State would approve of.
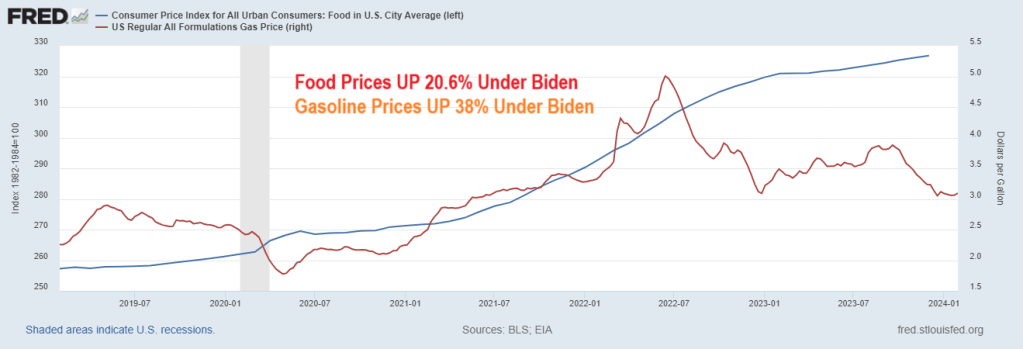
Treasury Secretary Janet Yellen just admitted what the rest of Americans already knew: high prices are here to stay. Example? Food prices (CPI) are up over 20% under Inflation Joe while gasoline prices are up 38% under Clueless Joe.
On the housing front, the Case-Shiller National Home Price Index is up 33.2% under Biden. And Freddie Mac’s 3-year mortgage rate is up 154% under Biden’s leadership (c’mon man! Obama is pulling the strings on Puppet Joe).
For months officials in the Biden administration have falsely claimed prices on everyday goods and services were going down. In reality, they’re getting more expensive at a slower pace.
During a briefing at the White House last week, Press Secretary Karine Jean Pierre had trouble explaining complaints from Biden when he purchased a smoothie that cost $6.
“Last Friday, the president was at a coffee shop in Pennsylvania, and he seemed to be surprised that the smoothie was $6 and how expensive it was,” a reporter asked. “I’m curious. So is the president now realizing the costs that Americans are bearing?”
“So, look, when he went over to you all, to the press corps, he was having a good time, right? And offered, as you know, offered to buy them coffee,” Jean Pierre responded. “There was a big group there, and he made sure everyone got coffee and pastries. So I just want to make that really clear.”
That is wonderful, KJP! The White House Press Corps got free coffee and pastries! Yippee!!!
But the rest of us in America are suffering from Bidenomics and inflation. Like food prices having risen 21% under Biden, gasoline prices UP 38%, home prices UP 33.2% and mortgage rates UP 154%.
Joe, are you kidding about the sizzling economy? Karine Jean Pierre is also guilty of comedy or gross propaganda.
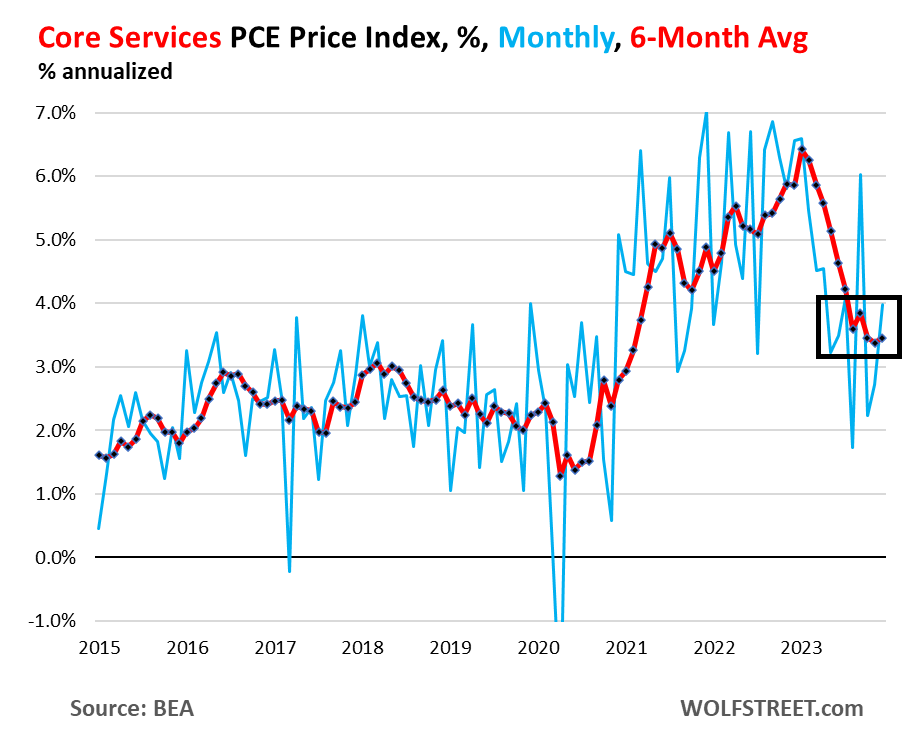
So right up front – and the Fed has been talking about this, though no one listens: The “core services” PCE price index has gotten stuck at 3.5% over the past six months annualized, and accelerated to 4.0% month-to-month annualized in December, with housing inflation stuck at about 6.7% over the past six months annualized, and with other core services components still red-hot.
The core services PCE price index rose by 0.33% in December from November, the second acceleration in a row, according to data from the Bureau of Economic Analysis today. This amounts to an increase of 4.0% annualized (blue).
The six-month moving average, which irons out the huge ups and downs of the month-to-month data, accelerated to 3.5%, and has been in this range since August, after the sharp deceleration in early 2023 (red).
Core services is where consumers spend the majority of their money, and they matter. Which is why Fed governors have said in near unison that they’re in no hurry to cut rates, but have taken a wait-and-see approach, with an eye on core services. And if it goes away, fine.
But on the surface, the PCE price index looks encouraging, and this has been the trend for months, with the overall PCE price index at +2.6% year-over-year in December, the lowest since March 2021; and with the core PCE price index at +2.9% year-over-year, also the lowest since March 2021, and aiming for the Fed’s 2% target.
The factors for the year-over-year cooling in these inflation measures have been the same for months: plunging energy prices, sharply dropping prices of durable goods after the huge spike in 2020 and 2021, cooling food inflation (with prices still rising from very high levels, but slowly), and favorable “base effects” when compared to a year ago.
But energy prices don’t plunge forever, so that will go away; durable goods prices don’t drop sharply forever either, though they can drop for a while longer to unwind some more of the price spike they’d been through in 2020 and 2021; and the base effects are going to get timed out this year, when the base of the year-over-year comparisons become the lower inflation figures of 2023.
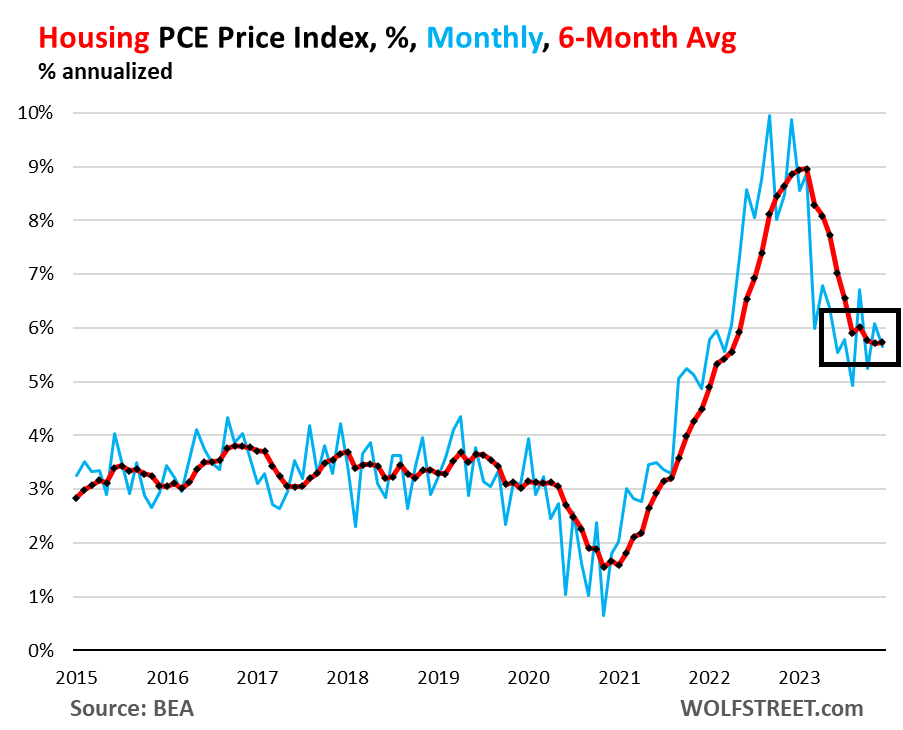
Housing inflation, still red hot and not cooling anymore. The PCE price index for housing rose by 0.46% in December from November and has been in this range since March, after the sharp slowdown early in 2023. This amounts to 5.7% annualized (blue in the chart below).
The housing index is broad-based and includes factors for rent in tenant-occupied dwellings; imputed rent for owner-occupied housing, group housing, and rental value of farm dwellings. It’s the largest component of core services.
The six-month moving average annualized, which shows the more recent trends, also rose by 5.7% in December, and has been in the same range since August (red).
So it looks like the PCE price index for housing has gotten stuck at 5.7%. This stubborn inflation in housing is a blow to theories trotted out for 18 months that housing was lagging, and that we know it will go away as an issue, etc., etc. The increases are less hot than they had been, but remain hot and have become persistent.
The major categories of core services in the PCE price index, as a six-month average of month-to-month changes, annualized:
Core services, major categories, 6-month average, annualized
Housing
5.7%
Description and chart above
Non-energy utilities
2.5%
Water, sewer, trash
Health care
2.5%
Physicians, outpatient, hospital, nursing care, dental, etc.
Transportation services
6.1%
Auto repair & maintenance, auto leasing & rentals, public transportation, airfares, etc.
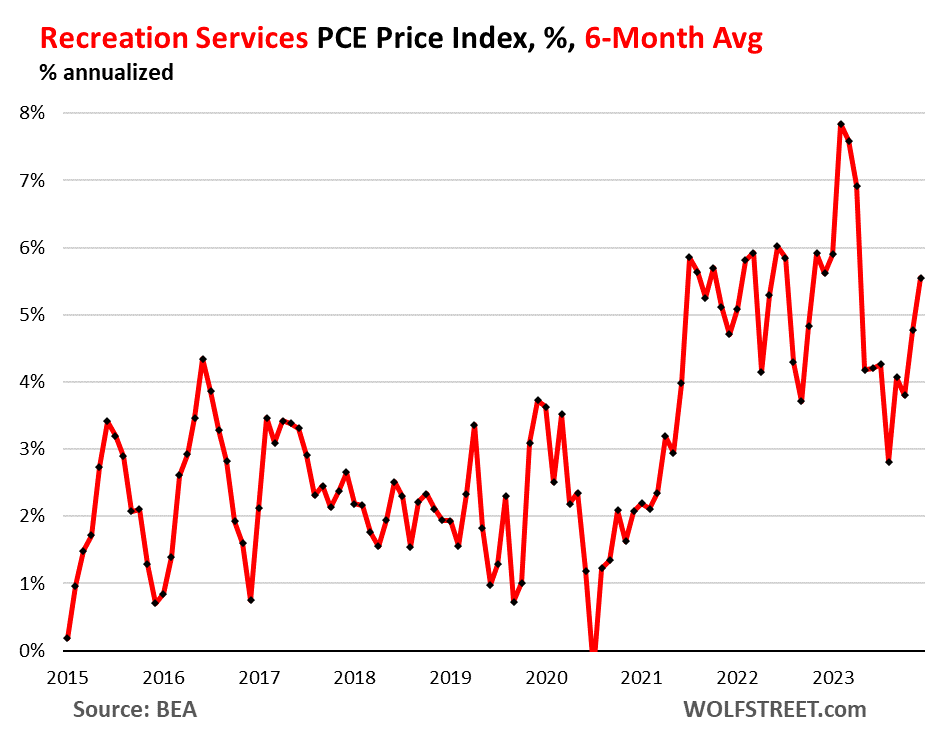
Recreation services
5.6%
Concerts, sports, movies, gambling, streaming, vet services, package tours, etc.
Food services, accommodation
2.8%
Meals & drinks at restaurants, bars, schools, cafeterias, etc.; accommodation at hotels, motels, schools, etc.
Financial services
3.5%
Fees & commissions at banks, brokers, funds, portfolio management, etc.
Insurance
2.8%
Insurance of all kinds, including health insurance
Other services
0.1%
Collection of other services
Inflation in Transportation services and Recreation services is accelerating on the basis of the 6-month moving average, with the PCE price index for Transportation services rising by 6.1%, and the index for Recreation services rising by 5.6%:
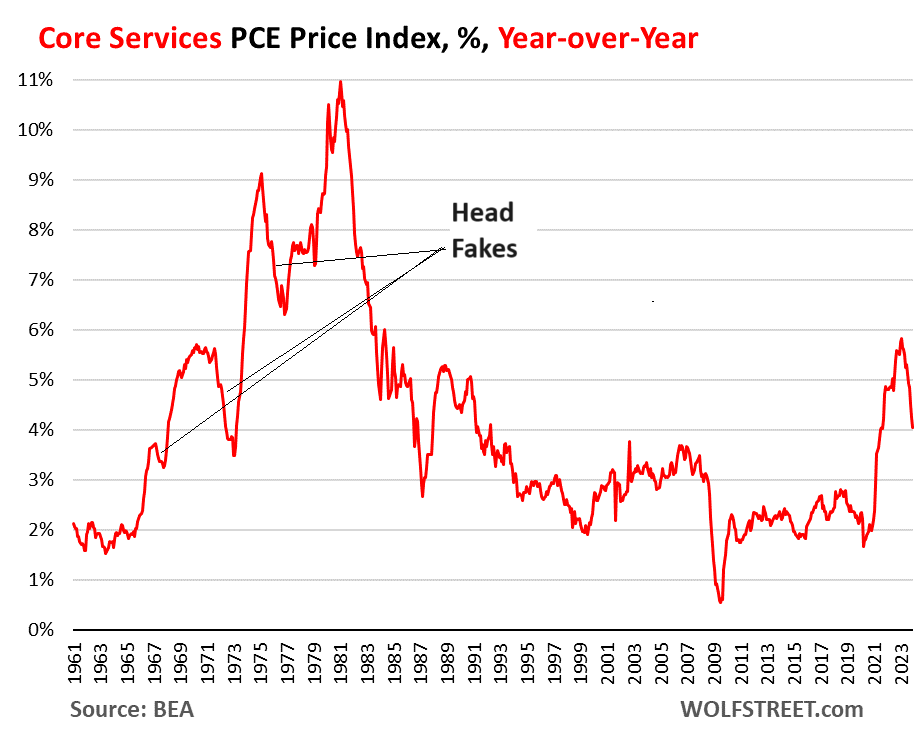
The head-fakes last time.
Inflation in services turns out to be tough to beat, and it can dish up big head-fakes. Last time we had this type of surge of inflation, so that was in the 1970s and 1980s, we thought repeatedly that we had inflation licked, only to find out that we’d fallen for an inflation head-fake. There were three head-fakes in core services on the way to the peak of 11% in 1981:
But Democrats are desperate to stay in power and rake in billons of dollars. Their strategy? Nobody But Joe. Well, except maybe Mike Obama.
Isn’t it wonderful to be 81 years old like Biden and a have a credit card with seemingly no credit limit? And partner with other octogenarians like Pelosi and McConnell to bankrupt the US? Free-spending US Senate Demagogue Democrat Chuck Schumer is only 73. But all these elderly politicians are heaping debt on to backs of younger Americans.
The “surprise” Q4 GDP report showed GDP rising by $182.6 billion. Unfortunately, Biden had to borrow $834 billion to get $182.6 in GDP.
Graphically, we can Biden’s folly where Q4 public debt grew almost 5 times faster than real GDP.
Remember the massive bank bailout of “subprime” mortgage securities back that resulted in the Dodd-Frank banking legislation of 2010? Yes know, where they promised NO MORE BANK BAILOUTS EVER??? Particularly if Disease X is unleashed and we start shutting down economies and schools again. Will we see ANOTHER bank bailout??
Cantor Fitzgerald CEO Howard Lutnick spoke with Fox Business host Maria Bartiromo on the sidelines at the World Economic Forum in Davos, Switzerland, last week. He offered a bleak outlook on the commercial real estate sector, warning a “very ugly” two years is ahead.
“Coming due in the next two and a half years at these higher rates – you’re not going to get proceeds, meaning when you have a $120 million loan on a building, and someone says I’ll give you 90 million at a much higher rate – than it throws the keys back to the lenders – and there’s going to be a lot of them that are going to get wiped out,” Lutnick told Bartiromo.
“I think $700 billion could default … The lenders are going to have to do things with them. They’re going to be selling. It’s going to be a generational change in real estate coming at the end of 2024 and all of 2025. We will be talking about real estate being just a massive change,” Lutnick said.
He warned: “I think it’s going to be a very, very ugly market in owning real estate over the next, you know, 18 months, two years.”
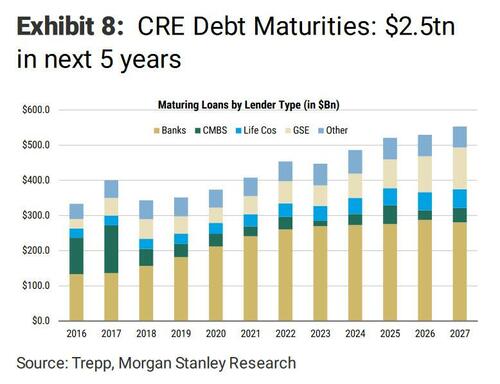
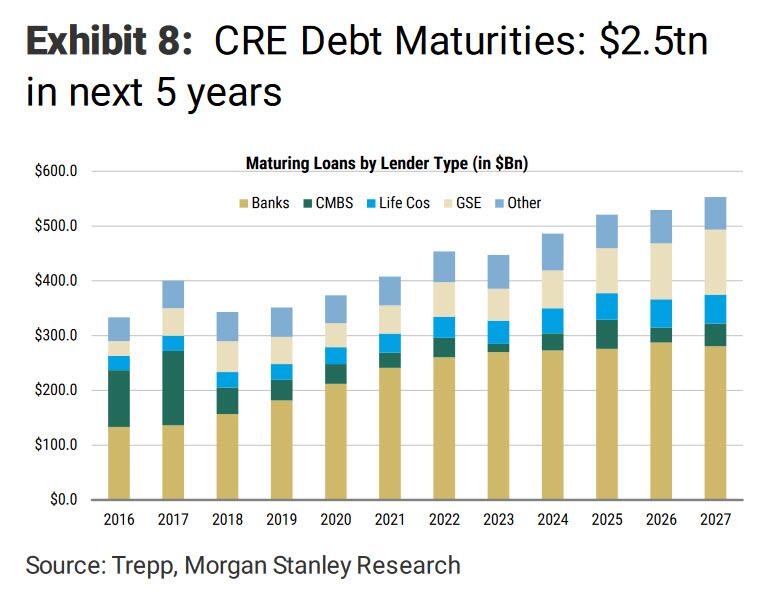
Lutnick noted that loan sales are set to become a major business opportunity with the upcoming maturity of CRE mortgages. He highlighted that an estimated trillion dollars of CRE debt is coming due over the next 2.5 years.
Shortly after the regional bank implosion in March 2023, Morgan Stanley penned a note to clients about a $2.5 trillion wall of CRE debt coming due over five years.
A recent survey of Terminal users by Bloomberg’s Markets Live found most respondents believe the office tower market needs a deeper correction before a rebound materializes.
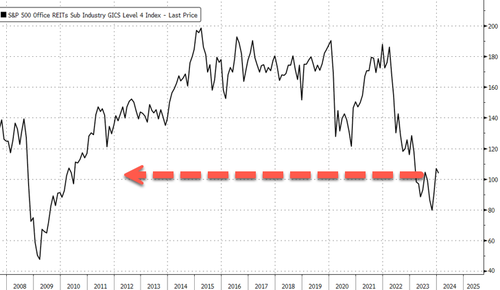
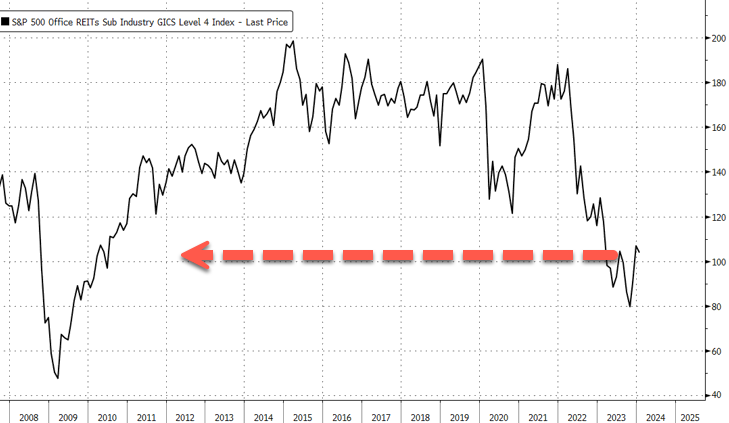
Lutnick pointed out, “Real estate equity, REITS, are going to be in trouble … a lot of them are going to be wiped out, so many defaults, I think.”
Bloomberg office REITs have been plunging since early 2022 when the Federal Reserve embarked on the most aggressive interest rate hiking cycle in a generation to tame inflation.
“Commercial real estate is experiencing a meaningful repricing as cap rates correlate to long-term to interest rates,” Morgan Stanley told clients in a recent report, adding, “Patience is required while refinancing to higher debt costs gradually triggers valuation adjustments.”
Lutnick’s not the only one with a dismal outlook on CRE.
In a recent interview, Scott Rechler, Chairman and CEO of RXR Realty, told Goldman’s Allison Nathan that the CRE downturn is still in the early innings.


You must be logged in to post a comment.