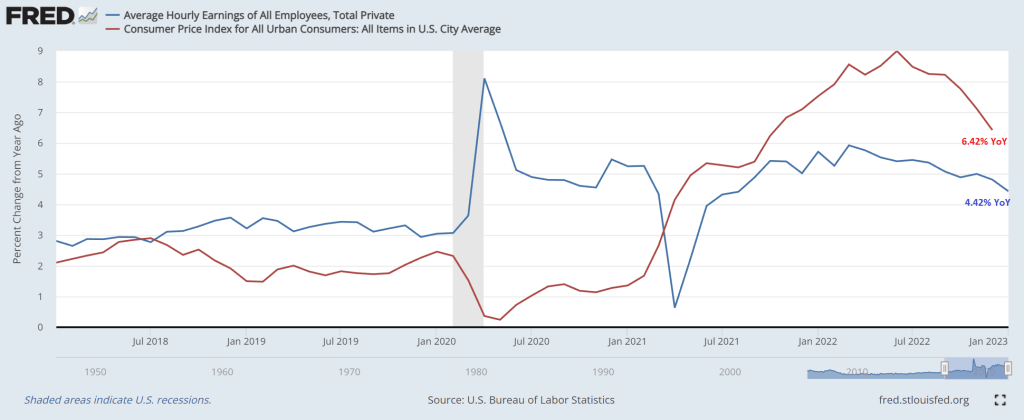
The one statement that Biden made in his State of the Union Address that was factually accurate was that inflation is coming down. Of course, he then blew it by saying he inherited inflation from Trump which was not true. Headline inflation (CPI YoY) was only 1.4% when Biden was sworn-in as President and rose to 9.1% YoY by June 2021 before finally starting to decline.
But despite the cooling of inflation (and M2 Money growth), The Fed seems hell bent on increasing their target rate, now forecast by Fed Funds Futures to peak in July 2023 at 5.123% before pivoting.
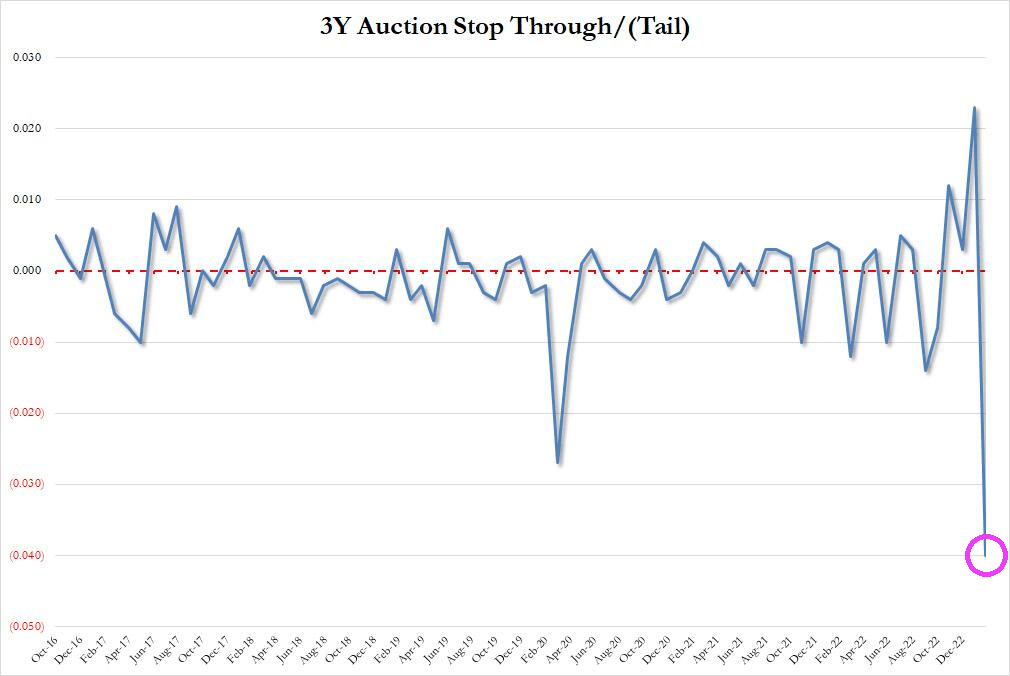
After Jerome Powell raved about the strong US labor market and oddly ignored the staggering crowding-out of US interest payments on its massive debt, the US Treasury’s 3-year debt auction was … a Hinderburg moment.
First, the high yield at today’s auction of 3-year Treasury notes was 4.073%. This occured as the allotment to brokers and dealers collapsed along with M2 Money growth YoY.
Then we have this horrible chart of the 3Y auction stop through, crashing into uncharted waters. A stop-through indicates when the highest yield the Treasury sold in the auction is below the highest yield expected when the auction began – the “when issued” level.
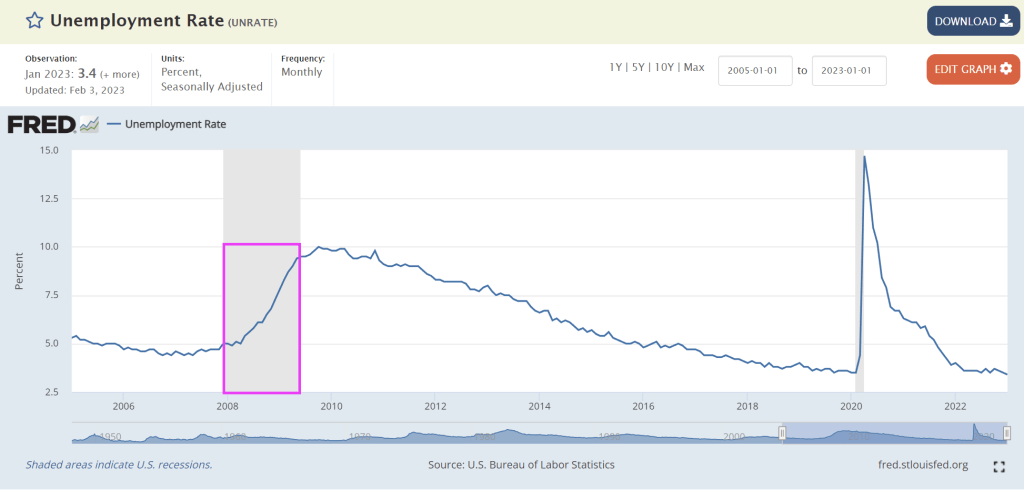
“The U.S. economy added 517,000 jobs in January, more than doubling Wall Street expectations and turning up its nose at prognosticators of an imminent recession. The unemployment rate dropped to 3.4 percent, the lowest level since 1969. Analysts were expecting it to move in the opposite direction, ticking up to 3.6 percent.”
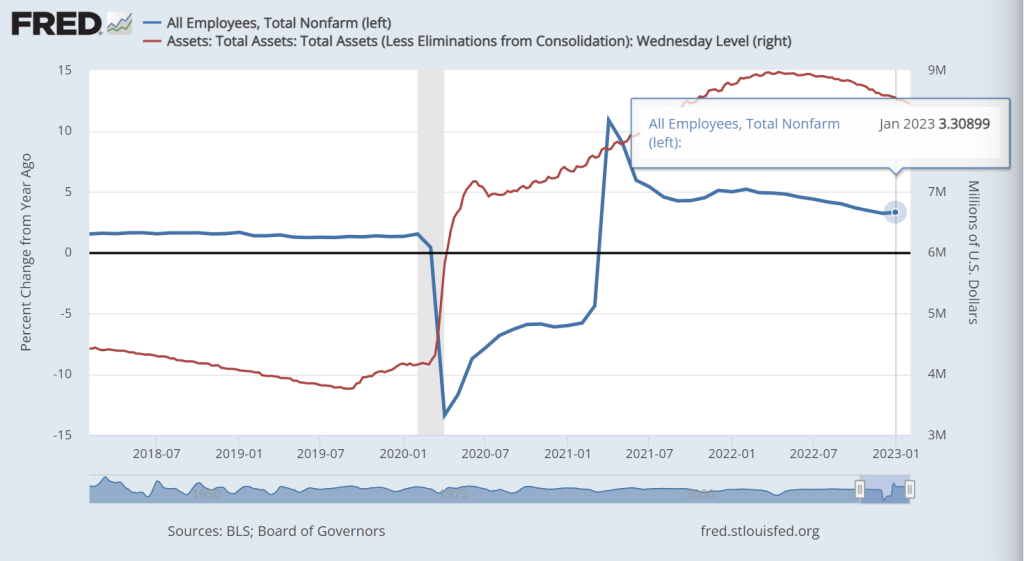
Yes, I was expecting U-3 unemployment to increase to 3.6% as well. What happened? Seasonal adjustments (BLS doens’t provide non-seasonally adjusted data). But the shocking headline (mostly due to seasonal adjustements) was not as surprising if we consider that jobs added in January grew at 3.309% year-over-year. Well, THAT isn’t all that surprising. Particularly since The Fed is slow walking its shrinking of The Fed balance sheet.
And with over 100 MILLION not in the labor force (apparently, the US labor force never really recovered from the Wuhan China virus), the U-3 unemployment rate touted by the media is misleading.
Bear in mind that employment is a LAGGING indicator. For example, the unemployment rate was 4.7% in November 2007 just prior to the beginning of the 2008-2009 Great Recession. So Biden’s bragging about the lowest unemployment rate since 1969 is meaningless in predicting recessions.
So, the January jobs report isn’t as surprising and strong as talking heads screamed about. I wish BLS would release non-seasonally adjusted (raw) data. But since we have a dysfunctional Federal government, I am not holding my breath.
And I wouldn’t consider averrage hourly earnings growth YoY of 4.42% when headline US inflation is 6.42% particularly brag worthy.
Of course, Biden lied about inheriting inflation from Trump. Inflation was 1.28% YoY in December 2020 just before Biden was sworn-in as President. Then again, Biden lies about everything. At least he just refused to comment on the Chinese Spy Balloons.
President Biden had better give his State of the Union Address before the economy worsens any more.
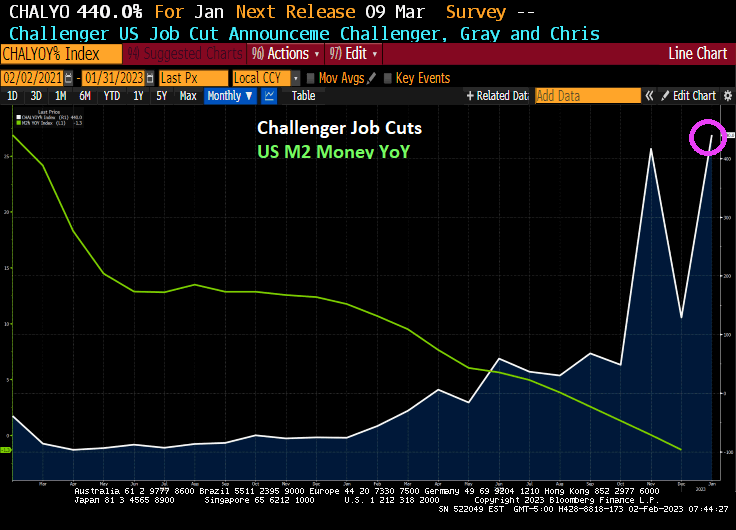
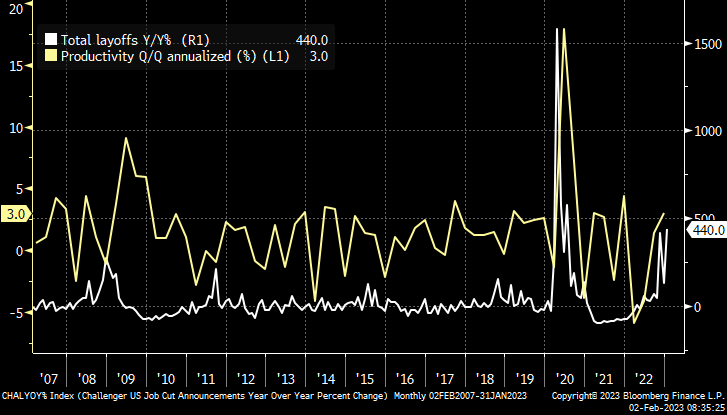
In January, the Challenger, Gray and Christmas jobs cuts index was a doozy. Jobs cuts rose 440%. This is happening as The Federal Reserve keeps its feet on the monetary brake pedal.
The Challenger report shows a big jump of 135.8 percent in layoff intentions to 102,943 in January, up from 43,651 in December and 440.0 percent higher than the 19,064 in January 2022. Many of the job cuts are in the tech sector, but job cuts are now spreading across the economy as a recession looms.
This morning, the US Treasury 10-year yield is down only -3.5 basis points, but it is Europe where the action is. UK is down -16.2 basis points and Italy is down -14.8 bps. UPDATE: US 10Y yield down -5.3 BPS, Italy 10Y down -29 bps.
Today’s GDP report from the BEA reminds me of the Peggy Lee song “Is That All There Is?” Between the massive Fed monetary stimulus since late 2008 (and particularly since Covid in 2020) and all the Federal spending (Covid relief, Inflation reduction, Omnipork spending bill, etc.), US real GDP rose by only 2.9% in Q4 from Q3.
But signs of slowing underlying demand mounted as the steepest interest-rate hikes in decades threaten growth this year.
Gross domestic product increased at a 2.9% annualized rate in final three months of 2022 after a 3.2% gain in the third quarter, the Commerce Department’s initial estimate showed Thursday.
Personal consumption, the biggest part of the economy, climbed at a below-forecast 2.1% pace (forecast was for 2.9%). Again,
The report also showed some signs of stress for American consumers whose wages have failed to keep up with inflation and continued to encourage them to draw down savings accumulated from government pandemic-relief programs. The burden of elevated prices and higher borrowing costs is mounting, pointing to a tenuous outlook for the economy.
A key gauge of underlying demand that strips out the trade and inventories components — inflation-adjusted final sales to domestic purchasers — rose an annualized 0.8% in the fourth quarter after a 1.5% gain.
Core PCE growth grew at 3.9%, but is slowing already as M2 Money growth dies.
Stock-index futures and Treasury yields remained higher and the dollar was little changed after the GDP report and better-than-expected weekly jobless claims. Applications for unemployment insurance dropped to 186,000 last week, the lowest since April.
Recent data show cracks are developing more broadly. Retail and motor vehicle sales data showed households are starting to retrench, the housing market continues to weaken and some businesses are reconsidering capital spending plans.
As the Federal Reserve continues to hike interest rates to ensure inflation is extinguished, housing and manufacturing have deteriorated quickly while industries including banking and technology are carrying out mass layoffs.
The GDP report showed the personal consumption expenditures price index, a key inflation metric for the Fed, rose at an annualized 3.2% rate in the fourth quarter, down from a 4.3% pace in the prior three months. The core index that excludes food and energy climbed at a 3.9% rate compared with 4.7% paces in the prior two quarters. Monthly data for December will be released Friday.
The moderation in price pressures is consistent with forecasts that the Fed will further scale back its tightening campaign next week, when it’s expected to raise rates by 25 basis points. Policymakers boosted the benchmark rate by 50 points in December after 75 basis-point hikes at their previous four meetings.
The world’s largest economy expanded 2.1% last year. In 2021, when demand snapped back from pandemic-related shutdowns, the economy grew 5.9% — the best performance since 1984.
The GDP data showed services spending increased at 2.6% annualized rate in the October-December period, the slowest since last year’s first quarter. Outlays on goods rose at a 1.1% pace, the first advance since 2021.
Business investment slowed sharply after a third-quarter surge. Spending on equipment declined an annualized 3.7%, the most since the second quarter of 2020. Outlays for structures rose at a 0.4% pace.
Let’s hope the BEA isn’t padding the numbers like the BLS was caught doing in the first half of 2022.
Lastly, US Real GDP growth YoY FELL to only 0.95925% as M2 Money growth disappears.
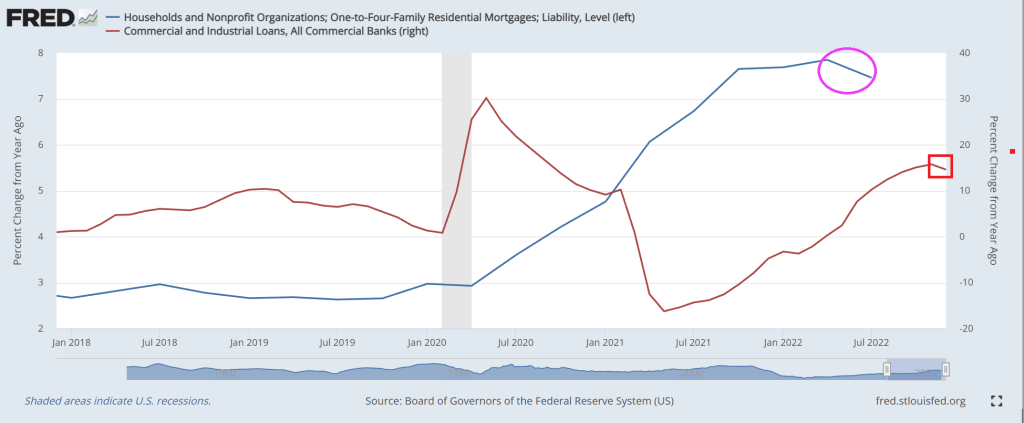
Falling mortgage rates are having a predictible effect on mortgage refinancing applications, but not so much for mortgage purchase applications.
Mortgage applications increased 7.0 percent from one week earlier, according to data from the Mortgage Bankers Association’s (MBA) Weekly Mortgage Applications Survey for the week ending January 20, 2023. This week’s results include an adjustment for the observance of Martin Luther King, Jr. Day.
The Refinance Index increased 3.15 percent from the previous week and was 77 percent lower than the same week one year ago.The unadjusted Purchase Index decreased 1 percent compared with the previous week and was 39 percent lower than the same week one year ago.
Generally speaking, declining mortgage rates are due to declining 10-year Treasury yields. And 10-year Treasury yields decline as the economy weakens. Of course, M2 Money growth YoY is now 0% as The Fed tightens.
Three regional Fed reports I like to watch are New York’s Empire State Outlook, Philly Fed’s Outlook and Richmond Fed’s outlook. Today, The Richmond Fed released their manufacturing outlook and … it declined to -11.
So the big three are all down (Philly down to -8.9 while NY’s Empire State outlook is down to -32.9.
On the Treasury front, the US 10Y-3M yield curve inverted further (a signal of impending recession) just tanked to -126.462 basis points.
The Conference Board’s Leading Indicator should be called The Bleeding Indicator given that the leading index has declined to 10 straight months. This is happening as The Fed tightens monetary policy to combat inflation.
Leading indicators include economic variables that tend to move before changes in the overall economy. These indicators give a sense of the future state of an economy.


You must be logged in to post a comment.