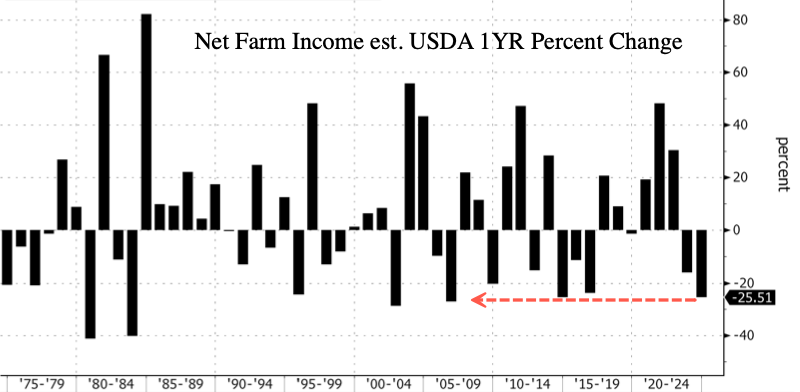
USDA forecasts net farm income, a broad measure of profits, to plunge $39.8 billion, or 25.5%, to $116.1 billion in 2024. This follows a forecasted decrease of $29.7 billion, or 16%, from 2022 to $155.9 billion in 2023.
If the estimate holds, farmers face the largest income drop since 2006 and back-to-back years of financial pain.
“With this expected decline, net farm income in 2024 would be 1.7 percent below its 20-year average (2003–22) of $118.2 billion and 40.9 percent below the record high in 2022 in inflation-adjusted dollars,” USDA wrote in the report.
Simultaneously, farmers are witnessing a rapid decline in their leading role in the global grain market. Decades of corn export dominance were shredded by Brazil last year.
Bidenomics is failing blue-collar workers who put food on America’s table.
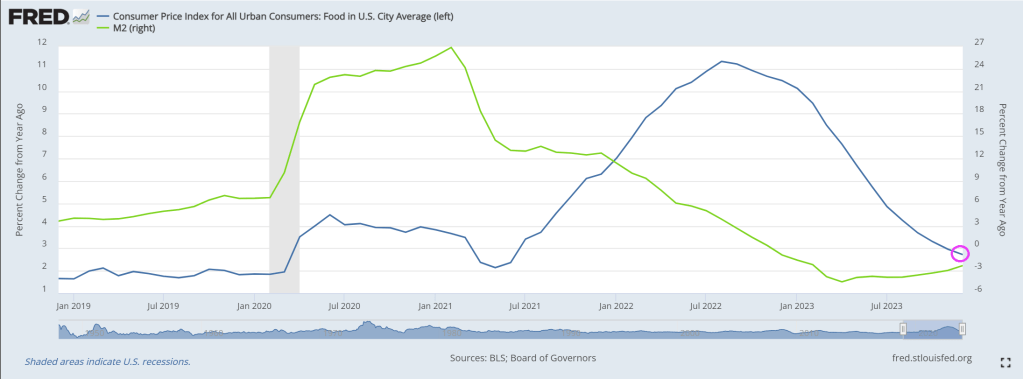
Food prices (CPI) are up 21% under listless, dementia Joe Biden.
I am surprised that Orin from Parks and Recreation hasn’t been appointed to Biden’s cabinet as Secretary of Agriculture.
Like Offenbach’s “Orpheus in the Underworld,” the US economy under Joe Biden is going to hell. Like the tech sector! Thanks to the massive hiring surge related to Covid and Covid spending, now trimming the bloat.
1. Twitch: 35% of workforce 2. Roomba: 31% of workforce 3. Hasbro: 20% of workforce 4. LA Times: 20% of workforce 5. Spotify: 17% of workforce 6. Levi’s: 15% of workforce 7. Xerox: 15% of workforce 8. Qualtrics: 14% of workforce 9. Wayfair: 13% of workforce 10. Duolingo: 10% of workforce 11. Washington Post: 10% of workforce 12: Snap: 10% of workforce 13. eBay: 9% of workforce 14. Business Insider: 8% of workforce 15. Paypal: 7% of workforce 16. Charles Schwab: 6% of workforce 17. Docusign: 6% of workforce 18. UPS: 2% of workforce 19. Blackrock: 3% of workforce 20. Citigroup: 20,000 employees 21. Pixar: 1,300 employees
And here’s the government-supplied statistics…
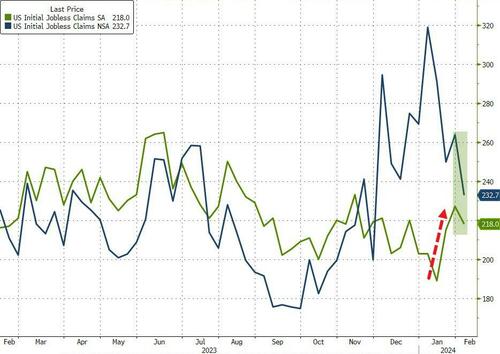
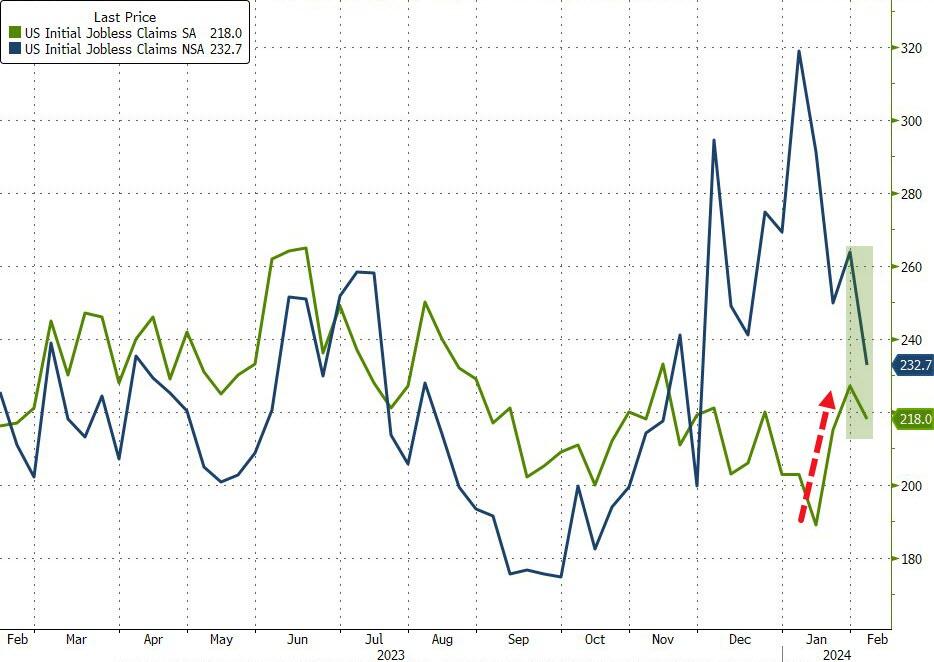
The number of Americans filing for jobless benefits for the first time last week dropped from 227k to 218k (below the 220k exp). On an NSA basis, claims tumbled even more…
Source: Bloomberg
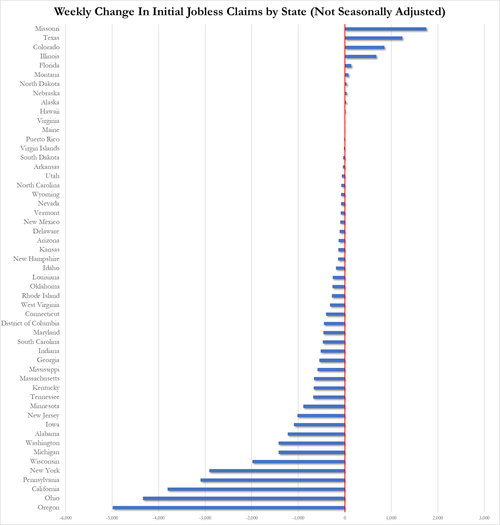
We assume there was some impact in here from the ice storms, but still, Oregon, Ohio, and California saw the biggest declines in claims while Missouri and Texas saw the biggest increase…
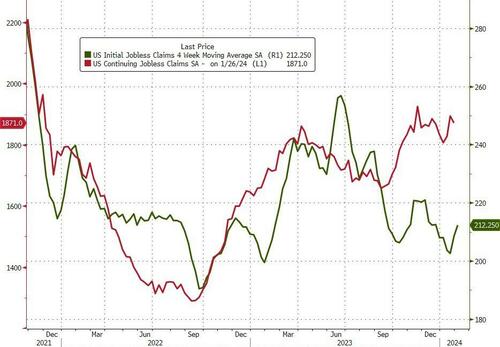
Continuing jobless claims also decline (of course, it’s an election year) from 1.894mm to 1.871mm…
Source: Bloomberg
We give the Richmond Fed’s Tom Barkin the last word:
“I am cautious about accuracy of numbers around the turn of the year.”
Cautious is one word…
Not to mention 2024 is an election year, so expect mega nonsense spewing from The White House and the BLS and other government agencies.
With massive job cuts in the real world (unlike the protected, ivory tower of Biden and Congress), the serious delinquency rate on credit cards.
The cumulative number of jobs reported each month was 1,255,000 less than previously thought, with new seasonal and census data affecting total employment estimates, according to data from the BLS calculated by the Daily Caller News Foundation. The huge downward revisions are in spite of a 115,000 upward revision in December, the only month that saw an upward revision to the employment level in 2023.
The biggest revision was for March, which was revised down by a total of 266,000 jobs, followed by January at 234,000 and April at 205,000, according to the BLS. The lowest downward revision was in November, with only 2,000, followed by 11,000 in October.
“Revisions are a normal part of the reporting process, but large changes, or adjustments that consistently move in the same direction, are not normal,” E.J. Antoni, a research fellow at the Heritage Foundation’s Grover M. Hermann Center for the Federal Budget, told the Daily Caller News Foundation. “Instead, they’re indicative of something problematic with the BLS’ methodology. That can happen when market conditions change drastically enough to be outside of the assumptions used in their models.”
The revisions are due in part to an overestimate of the number of jobs in the U.S. economy in January 2023 at 155,007,000 instead of the revised 154,773,000, according to the BLS. The job level increased to a revised 157,347,000 by December, totaling an increase of 2,340,000 positions in the year.
The most recent jobs report in February also released an adjustment to the total jobs level, lowering March by 266,000 positions, according to the BLS. The jobs totals were also adjusted to recent census data, throwing off past estimates.
Recent years have not seen the same high downward revisions as 2023, with 2022 only seeing negative revisions in five months, equating to a downward revision of 66,000 for the year. March was the only month that was revised down in 2021, with the total number for the year being revised up by nearly 2 million as the country recovered from the COVID-19 pandemic.
Growth in government positions has bolstered recent job numbers, adding a total of 601,000 jobs to the U.S. economy in the past 12 months. The gains have led to an all-time record for government positions at 23,091,000, outdoing a surge in hiring from the 2010 census collections.
“When the economy was rapidly deteriorating at the onset of the Great Recession, the BLS repeatedly and consistently overestimated job levels, which then had to be revised down,” Antoni told the DCNF. “The worsening economic conditions fell outside of the assumptions used by the BLS statisticians, so the estimates became inaccurate. There could be similar problems today due to fallout from the government-imposed recession in 2020 because the labor market still hasn’t recovered.”
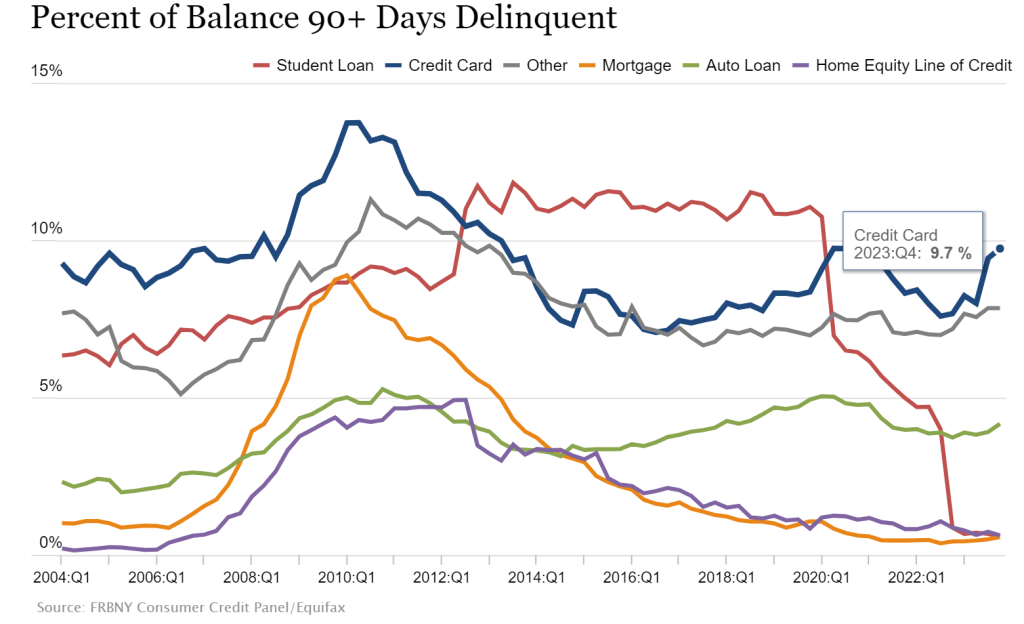
Credit card delinquecies (90+ days) rose to almost 10% in Q4 2023.
Credit card delinquencies surged more than 50% in 2023 as total consumer debt swelled to $17.5 trillion, the New York Federal Reserve reported Tuesday.
Debt that has transitioned into “serious delinquency,” or 90 days or more past due, increased across multiple categories during the year, but none more so than credit cards.
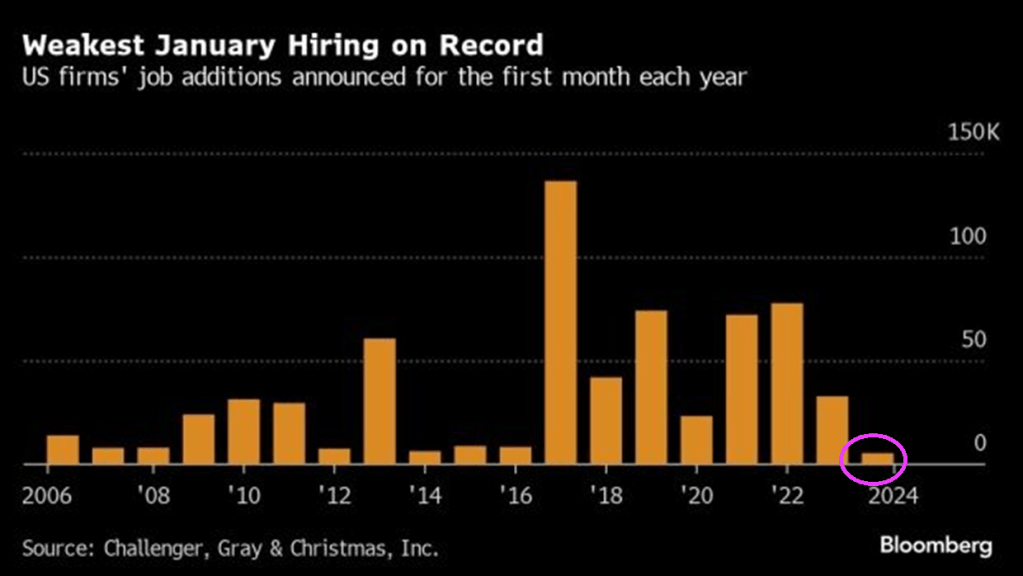
Rising credit card delinquencies combined with the worst job additions in January on record.
But at least the 10Y-2Y US Treasury yield curve is ALMOST flat (h
Well, the anticipated Establishment, and anti-middle class “Boader Security” bill has been released. It is all about military spending for Ukrainse (of course), grudging spending for Israel and peanuts for the border patrol to MONITOR, not stop the illegal immigrant caravans.
Independent US Senator Kyrsten Sinema told reporters the legislation would secure the US southern border (OMG, that is hilarious!!), including by requiring the Department of Homeland Security to close the border if there are an average of more than 5,000 crossing attempts per day over seven days.
In addition to $20.23 billion for border security, the bill included $60.06 billion to support Ukraine in its war with Russia, $14.1 billion in security assistance for Israel, $2.44 billion to US Central Command and the conflict in the Red Sea, and $4.83 billion to support US partners in the Indo-Pacific facing aggression from China, according to figures from US Senator Patty Murray.
An additional $10 billion would provide humanitarian assistance for civilians in Gaza, the West Bank, and Ukraine.
The US would provide $4.83 billion to support key regional partners in the Indo-Pacific where tensions have risen between Taiwan and China, as well as $2.33 billion for Ukrainians displaced by Russia’s invasion and other refugees fleeing persecution.
Millions for the military to keep Zelensky and his family in mansions while American veterans are homeless. But we expect massive Ukraine funding and the important US border security begins on page 62.
Example: $404,000,000 shall be for Immigration Judge Teams, in16 cluding appropriate attorneys, law clerks, paralegals, court 17 administrators, and other support staff, as well as necessary court and adjudicatory costs, and $36,000,000 shall be for representation for certain incompetent adults pursuant to section 240(e) of the Immigration and Na21 tionality Act (8 U.S.C. 1229a(e)).
What? Homeless vets live on the streets, but Schumer/McConnell want to QUICKLY process illegal immigrants.
Nobody spends other people’s money like Biden and Congress!
$47,500,000 for the procurement and deployment of mobile surveillance capabilities, including mobile video surveillance systems and for obsolete mobile surveillance equipment replacement, counter-UAS, and small unmanned aerial systems; – $25,000,000 for subterranean detection capabilities; – $7,500,000 for seamless integrated communications to extend connectivity for Border Patrol agents; and – $10,000,000 for the acquisition of data from long duration unmanned surface vehicles in support of maritime border security.
Other than helping the border patrol with surveillance, there are NO FUNDS FOR A WALL and just a lot of gibberish on reporting crossings, but NOTHING TO SLOW THE MIGRANT CROSSINGS.
In other words, it is a BIG DEFENSE SPENDING BILL … for Ukraine and Israel and peanuts for the US border. Child slavery and Fentanyl will continue unabated as will murders by illegal immigrants. Why? Illegals rarely live near Biden, Clintons, Obamas, McConnell, Thune and other frauds in the US House of Lords (aka, Senate).
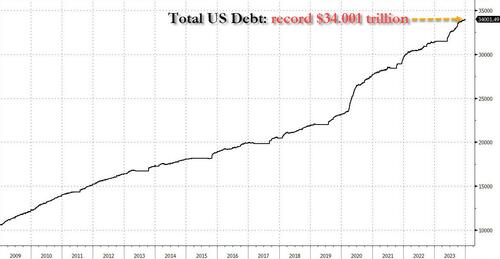
And you wonder why the US is careening off the debt cliff?
The great Will Rogers once said he never met a man he didn’t like. US President Joe Biden and Democrats have never met a spending opportunity they didn’t like (except for US border security, of course).
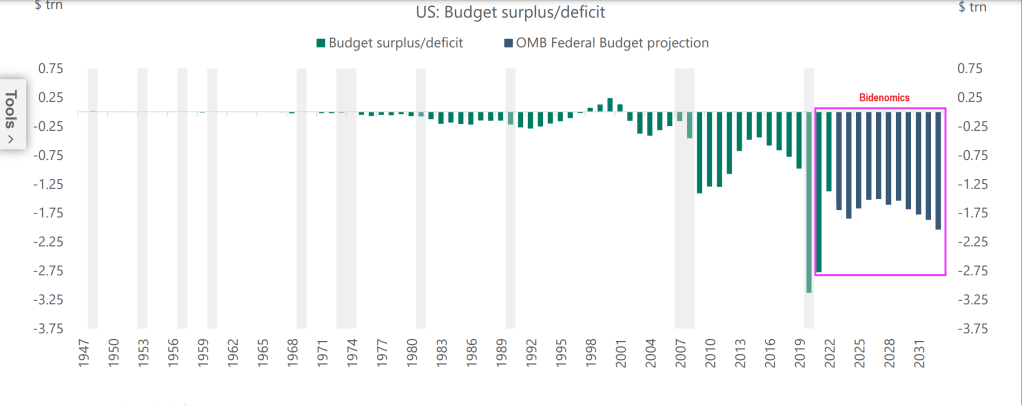
Under “Deficit Joe” Biden, Federal budget deficits have soared! And deficits are projected to grow!
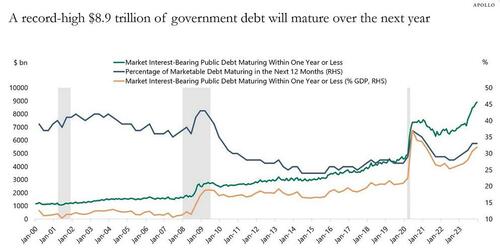
The problem, as Apollo’s gloomy chief strategist Torsten Slok points out, is that this feverish pace will only accelerate further, as a record $8.9 trillion of government debt will mature over the next year.
Meanwhile, the government budget deficit in 2024 will be $1.4 trillion according to the CBO (realistically expect this number to hit $2.0 trillion), and the Fed has been running down its balance sheet by $60 billion per month.
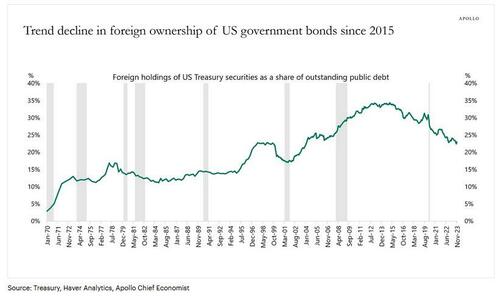
The bottom line is that someone will need to buy more than $10 trillion in US government bonds in 2024. That is more than one-third of US government debt outstanding. And more than one-third of US GDP.
This may be a particular challenge when the biggest holders of US Treasuries, namely foreigners, continue to shrink their share.
More fundamentally, Slok muses, “interest rate-sensitive balance sheets such as households, pension, and insurance have been the biggest buyers of Treasuries in 2023, and the question is whether they will continue to buy once the Fed starts cutting rates.”
(Spoiler alert: no… but that’s what QE is for, and sooner or later, it’s coming back).
Apollo’s latest updated outlook on Treasury demand is below (pdf link).
The Biden Administration which motto should be “Make Crime Great Again!” with awful crime in big cities, and millions pouring over the border, not to mention providing jobs for foreign workers and not native born Americans, is likely breathing a sigh of relief as food inflation falling to 2.7% year-over-year, still higher than pre-Covid levels under Trump. But at least food price inflation is slowing as The Fed’s money stimulus recedes.
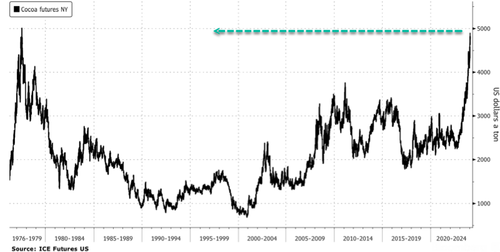
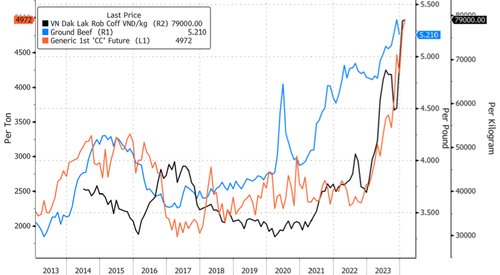
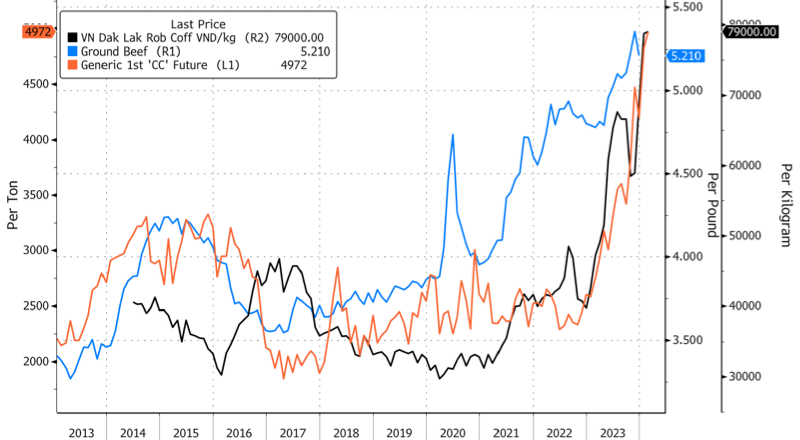
Cocoa prices climbed to a 46-year high this week in New York as concerns about dry conditions across West Africa could reduce yields for the Ivory Coast, the world’s largest producer of cocoa beans, ahead of the mid-crop in April.
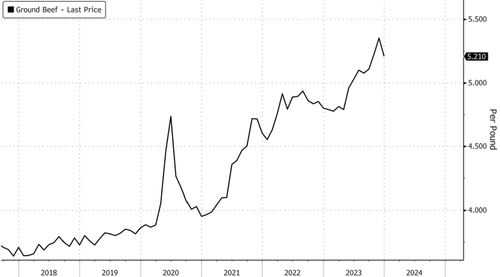
In the US, a rapidly shrinking cattle herd, now at the lowest levels in seven decades, has pushed the supermarket price of beef to a record of $5.21 per pound. Rising food prices are the central bank’s worst enemy.
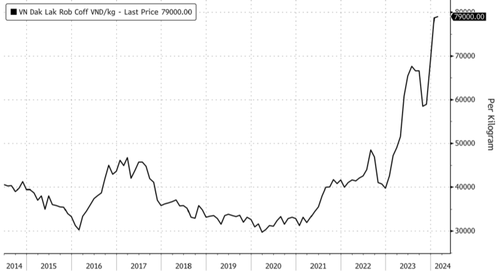
To end the week, breakfast lovers will be disappointed to learn robusta bean prices in Vietnam, the world’s largest producer of the bean, are absolutely out of control.
Local robusta prices in Vietnam hit a record on Thursday, topping nearly 80,000 per kilogram.
“That’s threatening to push prices in London up further, even after the benchmark capped its own all-time high this week at $3,336 a ton,” Bloomberg said, adding the surge in prices was primarily due to farmers “hoarding” the bean.
To recap this week, cocoa bean, beef, and robusta bean prices have been marching higher.
More bad news for Biden. Even though overall food inflation has receded, voters have long memories.
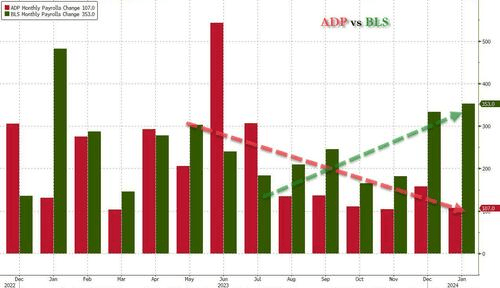
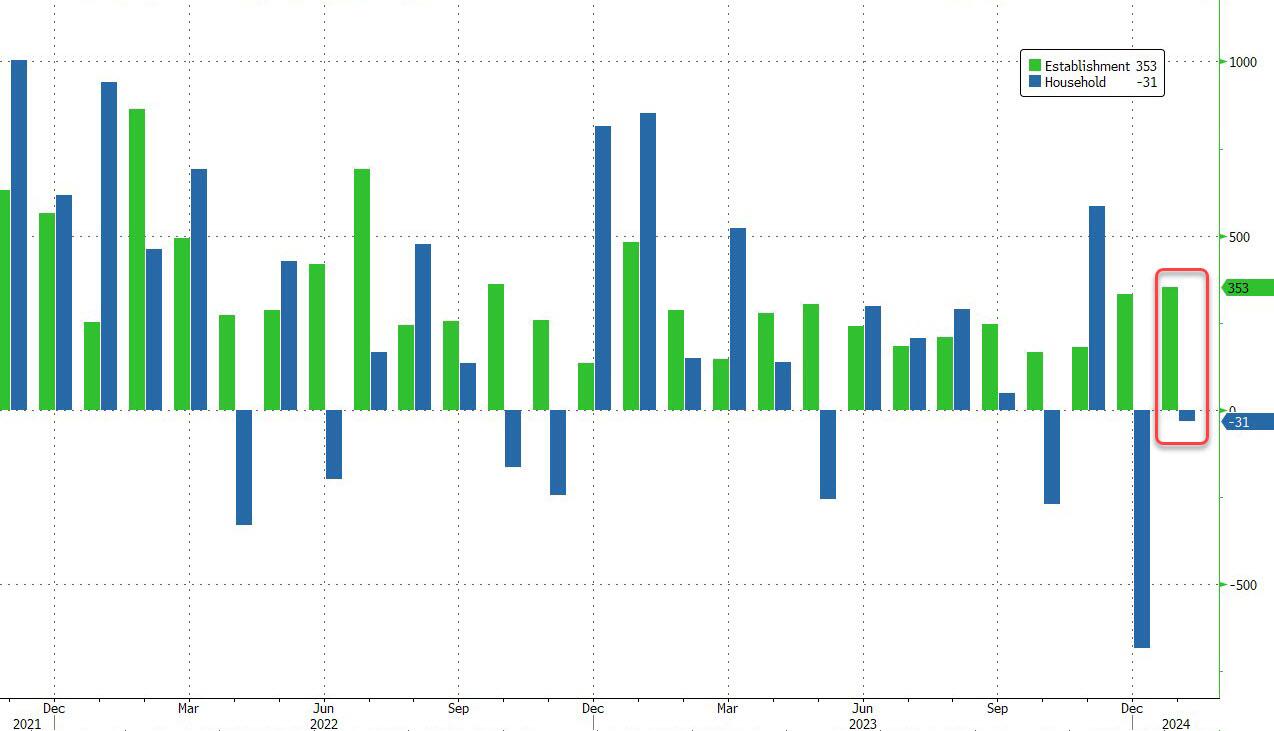
Today’s jobs report was UGLY! How when the US unexpectedly added 353K “jobs” – the most since January 2023. Remember, Biden is President. And apparenty El Presidente of Latin America, Africa and Asia.
Let me start with the official Biden jobs report versus the ADP jobs report from yesterday. BLS showed an amazing surge while ADP was sigalling a slowdown. Obviously, BLS is measuring employment differently (this is an election year after all). Like seasonal adjustments (always econometric voodoo).
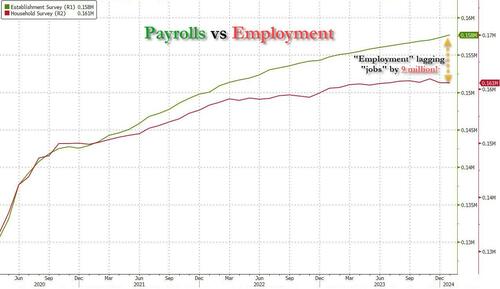
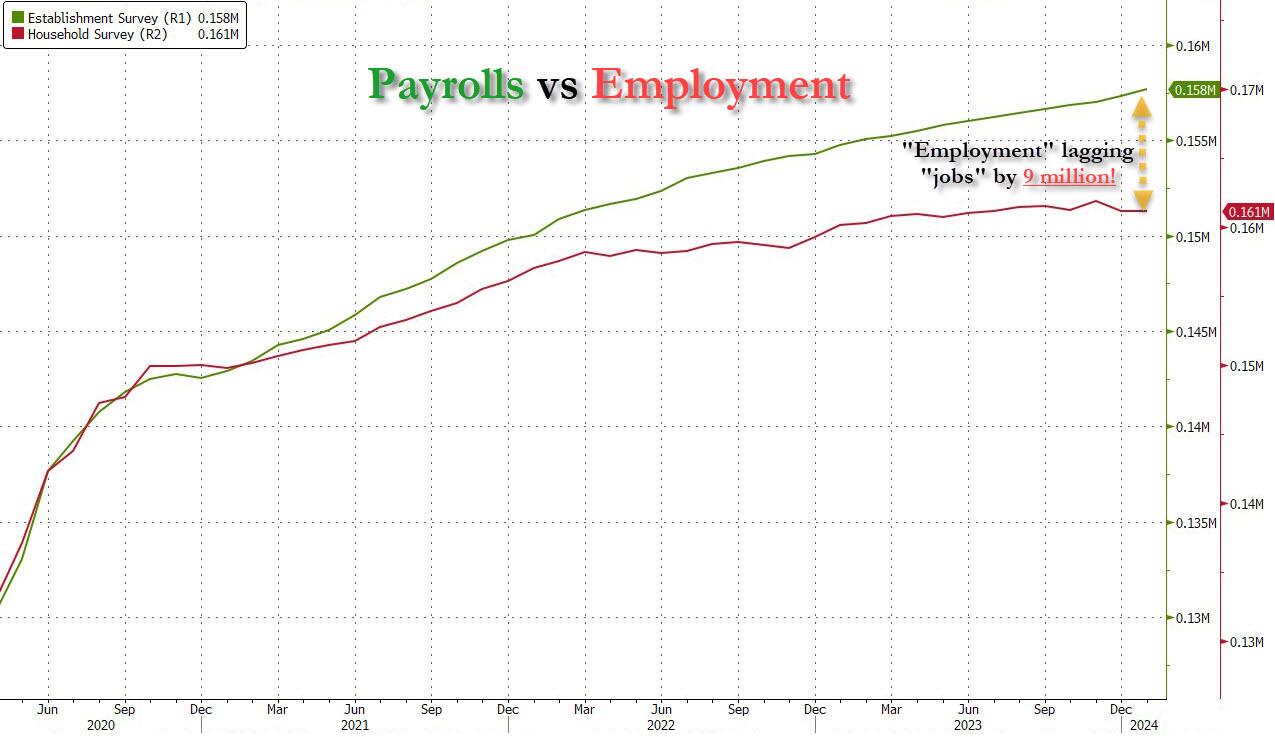
But it’s more than just the Biden admin hanging its “success” on seasonal adjustments: when one digs deeper inside the jobs report, all sorts of ugly things emerge… such as the latest divergence between the Establishment (payrolls) and much more accurate Household (actual employment) survey. To wit, while in January the BLS claims 353K payrolls were added, the Household survey found that the number of actually employed workers dropped again, this time by 31K (from 161.183K to 161.152K).
This means that while the Payrolls series hits new all time highs every month since December 2020 (when according to the BLS the US had its last month of payrolls losses), the level of Employment has barely budged in the past year. Worse, as shown in the chart below, such a gaping divergence has opened between the two series in the past 4 years, that the number of Employed workers would need to soar by 9 million (!) to catch up to what Payrolls claims is the employment situation.
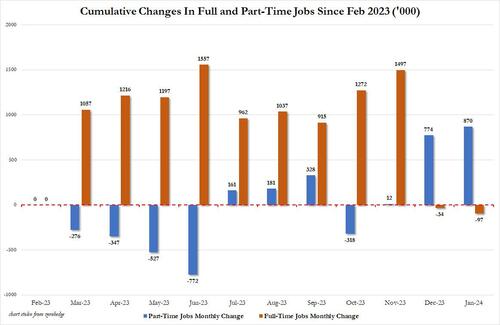
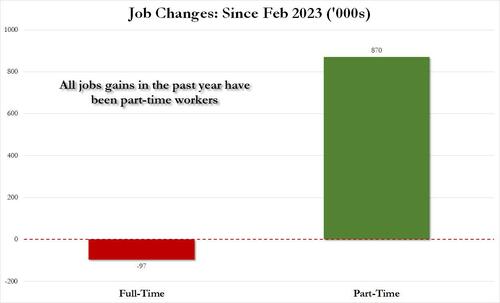
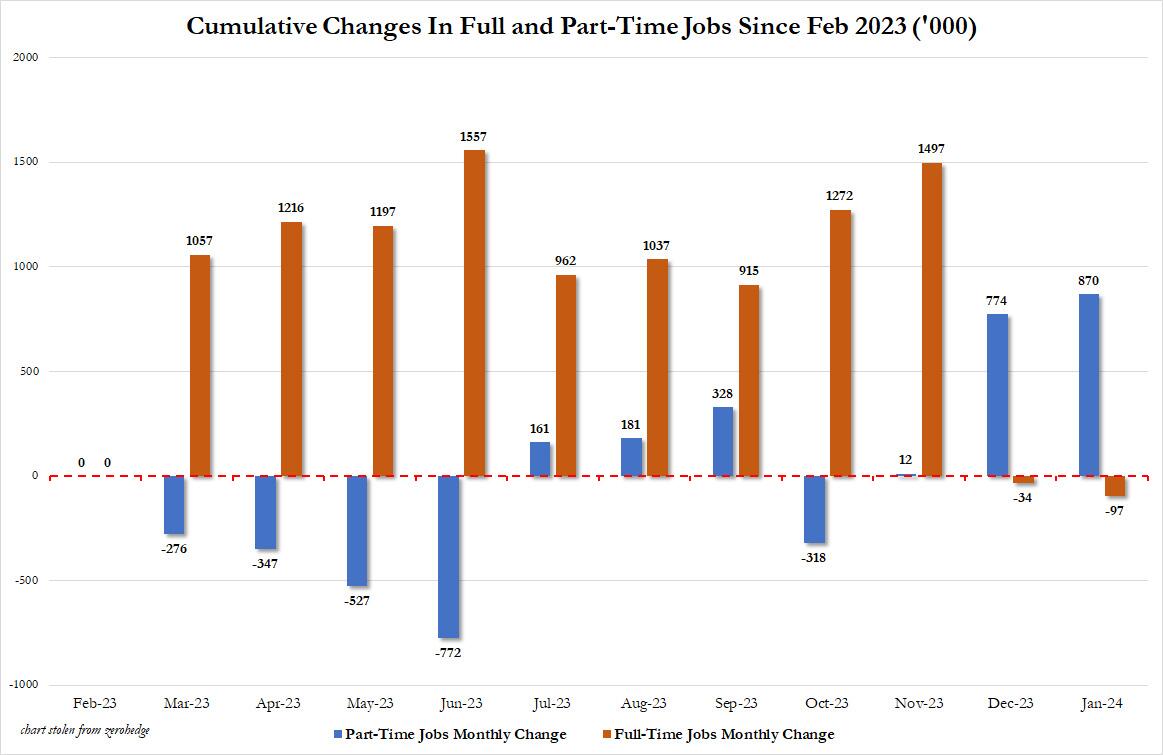
There’s more: shifting from a quantitative to a qualitative assessment, reveals just how ugly the composition of “new jobs” has been. Consider this: the BLS reports that in January 2024, the US had 133.1 million full-time jobs and 27.9 million part-time jobs. Well, that’s great… until you look back one year and find that in February 2023 the US had 133.2 million full-time jobs, or more than it does one year later! And yes, all the job growth since then has been in part-time jobs, which have increased by 870K since February 2023 (from 27.020 million to 27.890 million).
Here is a summary of the labor composition in the past year: all the jobs have been part-time jobs!
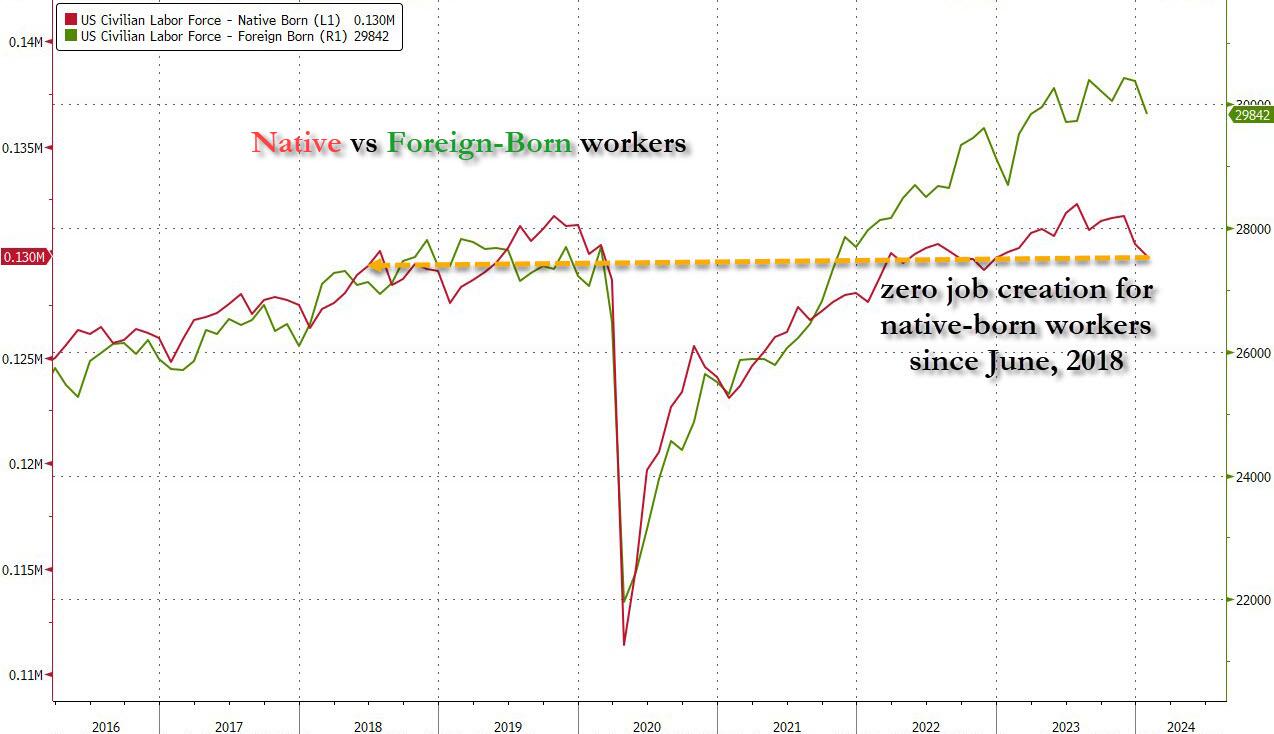
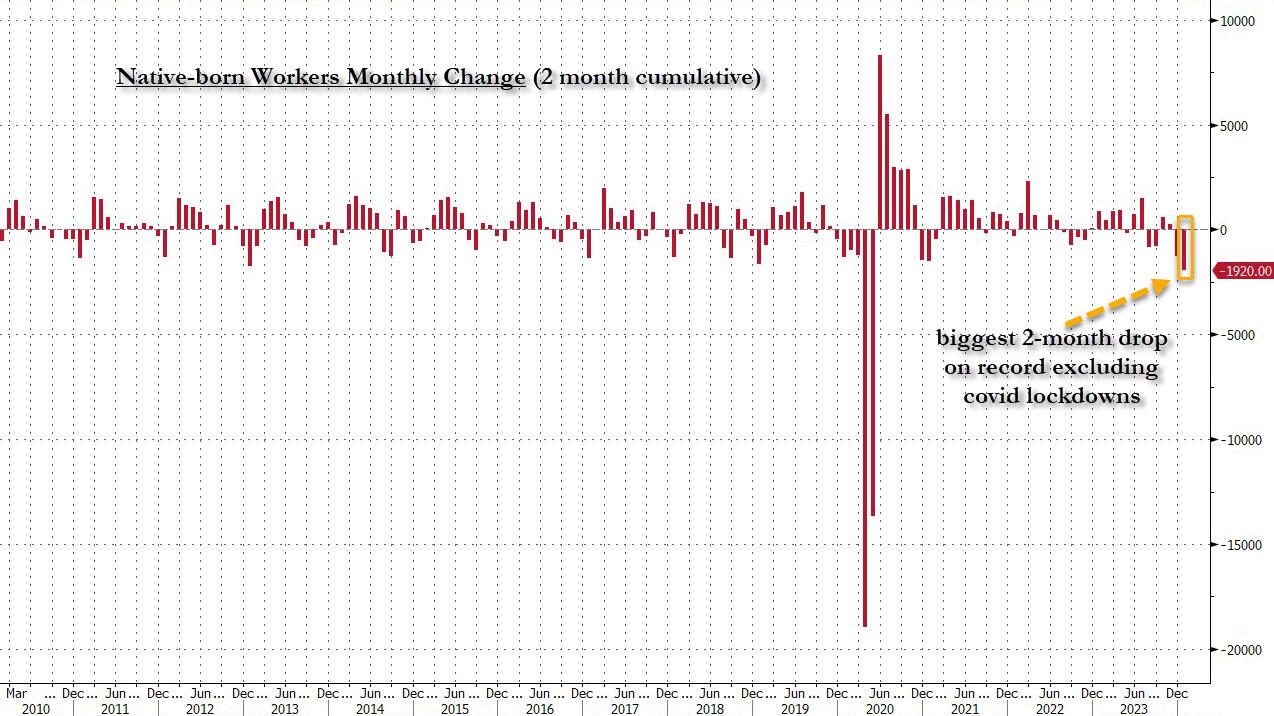
But wait there’s even more, because just as we enter the peak of election season and political talking points will be thrown around left and right, especially in the context of the immigration crisis created intentionally by the Biden administration which is hoping to import millions of new Democratic voters (maybe the US can hold the presidential election in Honduras or Guatemala, after all it is their citizens that will be illegally casting the key votes in November), what we find is that in January, the number of native-born worker tumbled again, sliding by a massive 560K to just 129.807 million. Add to this the December data, and we get a near-record 1.9 million plunge in native-born workers in just the past 2 months!
Said otherwise, not only has all job creation in the past 4 years has been exclusively for foreign-born workers, but there has been zero job-creation for native born workers since July 2018!
This is a huge issue – especially at a time of an illegal alien flood at the border – and is about to become a huge political scandal, because once the inevitable recession finally hits, there will be millions of furious unemployed Americans demanding a more accurate explanation for what happened – i.e., the illegal immigration floodgates that were opened by the Biden admin.
Which is also why the Biden admin will do everything in his power to insure there is no official recession before November… and is why after the election is over, all economic hell will finally break loose. Until then, however, expect the jobs numbers to get more and more ridiculous.
I wonder if “Union Joe” is telling US labor union about no growth for native (American born) workers.
“Progress on inflation has brightened the economic picture despite a slowdown in hiring and pay. Wages adjusted for inflation have improved over the past six months, and the economy looks like it’s headed toward a soft landing in the U.S. and globally,” says Nela Richardson, Chief Economist, ADP.
ADP National Employment Report
The ADP National Employment Report shows Private Sector Employment Increased by 107,000 Jobs in January; Annual Pay was Up 5.2%
Job Switching Payouts
Year-over-year pay gains for job-stayers reached 5.2 percent in January, down from 5.4 percent in December.
For job-changers, pay was up 7.2 percent, the smallest annual gain since May 2021.
Median Change in Annual Pay (ADP matched person sample) Job-Stayers 5.2%, Job-Changers 7.2%
ADP Notice
January’s report presents the scheduled annual revision of the ADP National Employment Report, which updates the data series to be consistent with the annual Quarterly Census of Employment and Wages (QCEW) benchmark data for March 2023. In addition, this revision introduces technical updates, namely, in re-weighting of ADP data to match QCEW data. The historical file was updated to reflect these revisions.
Notice Translation
ADP revises its data to match annual BLS data from March of 2023. The BLS will do the same in its annual revisions.
The BLS does not even back adjust the numbers so its historical record is bogus. And despite being incredibly lagging, the Fed makes key decisions on the data.
Job Openings Rise in December But Quits Tell the Real Story
There’s lots of meaningless chatter yesterday about job openings. However, actions speak louder than openings.
This report comes after Fed Chair Jerome Powell said “No Sugar Tonight” as in no expected rate cuts. That is, until it becomes obvious that Biden will lose the election, THEN The Fed will start cutting rates like crazy.
An example of the trash that Biden and Democrats are importing from Latin America, Africa and China. Among other sewers. I am sure that employers are lining up to hire this guy. … NOT! Correction: Biden may appoint this creep to his cabinet with the other losers.
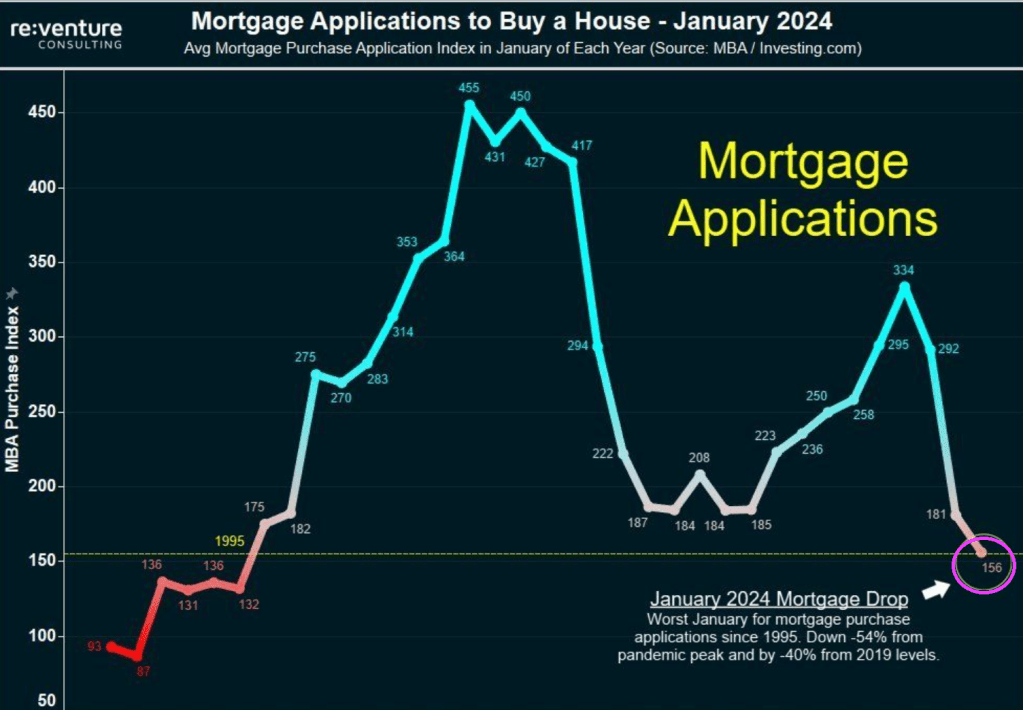
Yikes! Bidenomics is a disaster! MBA mortgage purchase applications are down 54% from Pandemic Peak. I was going to play “The Wreck of the Edmund Fitzgerald” by Gordon Lightfoot and rename it “The Wreck of The US Economy.”
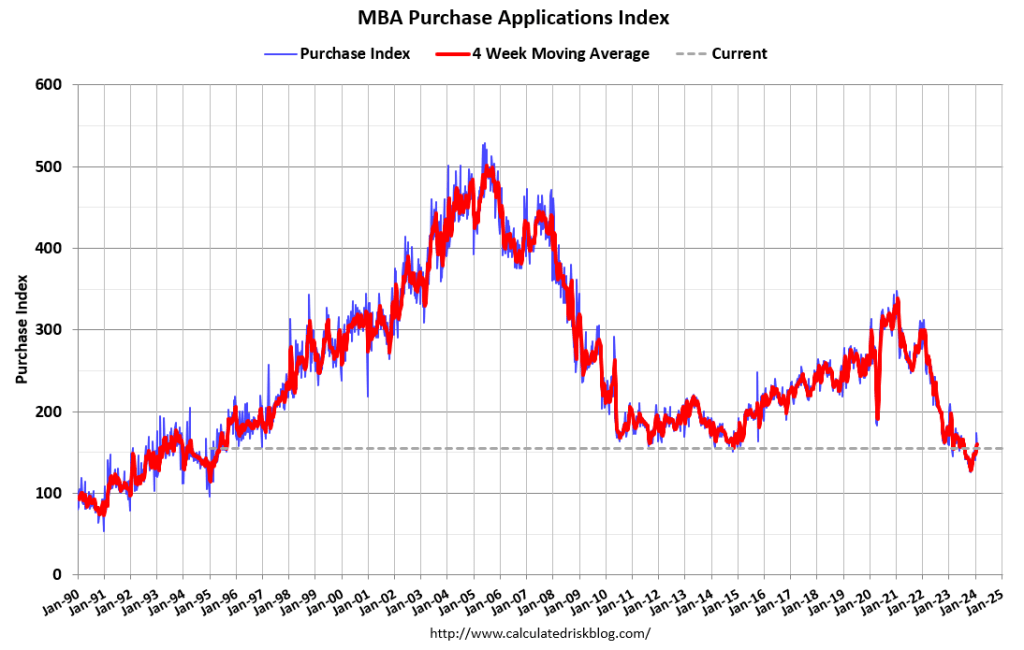
Mortgage demand fell to a new 30-year low in January 2024, down 54% from the pandemic peak. Mortgage demand is down 14% over the last year and 40% from pre-pandemic levels.
Mortgage applications decreased 7.2 percent from one week earlier, according to data from the Mortgage Bankers Association’s (MBA) Weekly Mortgage Applications Survey for the week ending January 26, 2024. Last week’s results included an adjustment to account for the MLK holiday.
The Market Composite Index, a measure of mortgage loan application volume, decreased 7.2 percent on a seasonally adjusted basis from one week earlier. On an unadjusted basis, the Index increased 8 percent compared with the previous week. The Refinance Index increased 2 percent from the previous week and was 3 percent higher than the same week one year ago. The seasonally adjusted Purchase Index decreased 11 percent from one week earlier. The unadjusted Purchase Index increased 6 percent compared with the previous week and was 20 percent lower than the same week one year ago.


You must be logged in to post a comment.