Alarm! US Existing Home Sales Fall For A Sixth Month (-19% YoY), Median Price Growth Of EHS Falls To +10.55% YoY As M2 Money Growth Slows

In honor of Wolfgang Peterson who passed away yesterday, the Director of the classic WWII movie “Das Boot!” …. ALARM!

Sales of previously owned US homes fell for a sixth straight month in July in the latest indication of how high borrowing costs and waning demand are propelling the housing market’s rapid decline. In fact, existing home sales fell -19% YoY in August.

Contract closings fell 5.9% in July to an annualized 4.81 million, the weakest since May 2020, figures from the National Association of Realtors showed Thursday. The median estimate called for 4.86 million in a Bloomberg survey of economists. Sales fell 22.4% from a year ago on an unadjusted basis.

The nearly 26% decline in previously owned home sales since January marks the steepest six-month plunge in records back to 1999 and underscores a housing market that’s reeling from elevated mortgage rates and prices. The industry is also experiencing a slowdown in construction, and more buyers are backing away from deals. 

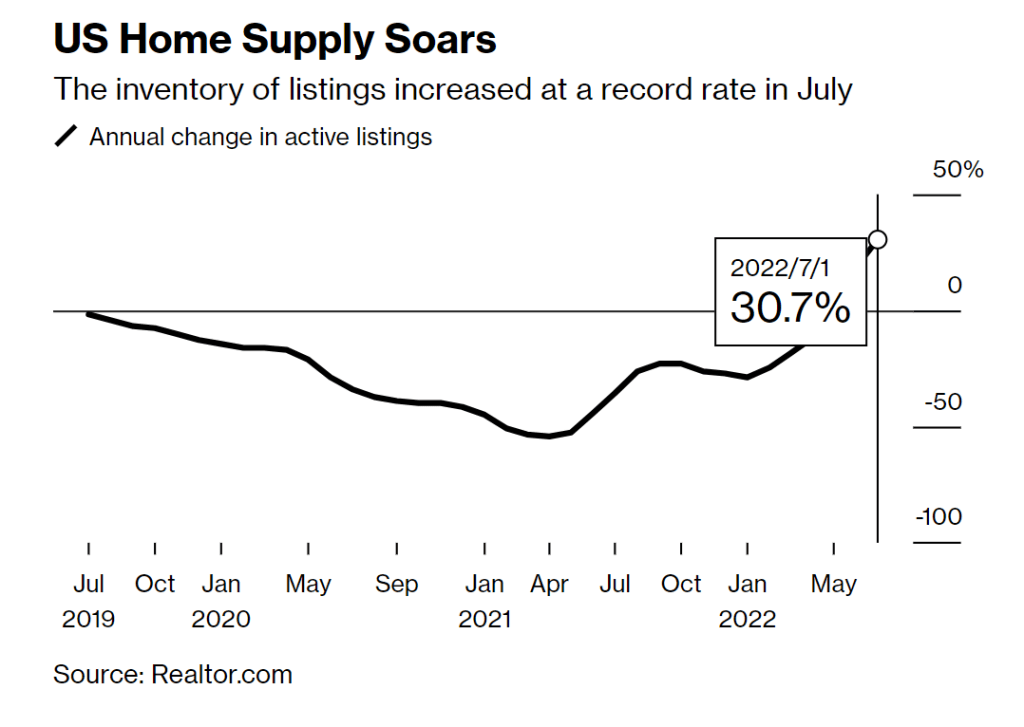
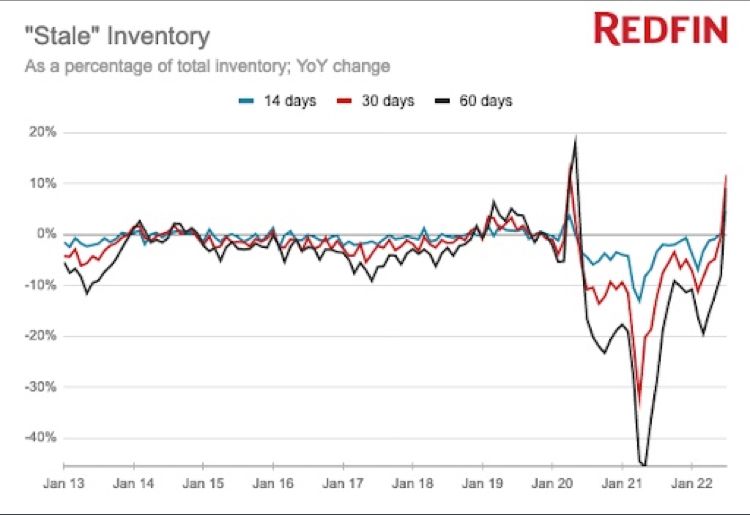
Weaker demand has led to a pickup in inventory, which may help to cool home prices in coming months.

The median price of existing home sales growth fell to 10.55% YoY as M2 Money growth slows.

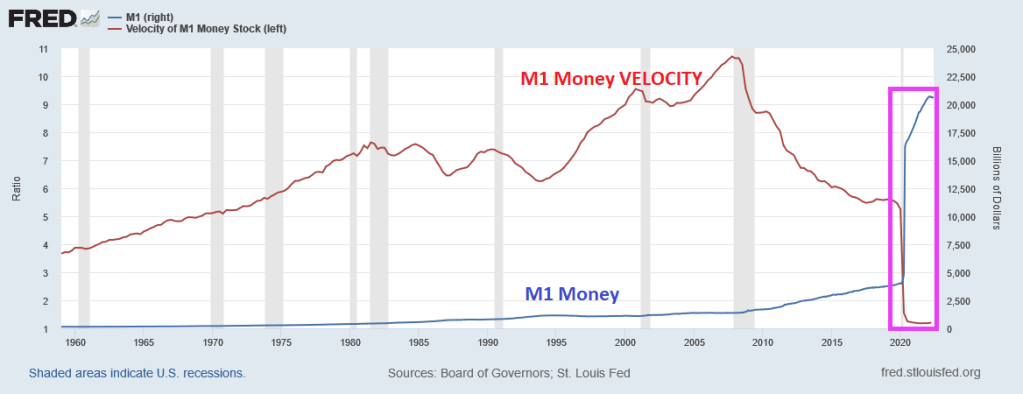
Its all about The Federal Reserve.

Alarm! US Home Builder Index Falls Below 50 As Fed Tightens Monetary Noose

Alarm!

The National Association of Home Builders Market Index slipped into darkness … that is, dropped below 50 to 49 in August as The Federal Reserve continues to tighten its uber-loose monetary policy, resulting in rising mortgage rates.

Note the plunge in the NAHB market index as mortgage rates began rising.

Jay’s Famous Chili! M1 And M2 Money Velocity Crushed By Covid “Relief” As US Treasury Yield Curve (10Y-2Y) Remains Inverted

The 2020 Covid outbreak led to a massive (and generally awful) reaction. There were economic shutdowns that caused extensive damage (particularly to small firms), but it was the massive overreaction by The Federal government in terms of Covid relief and The Federal Reserve’s expansion of the money supply that caused considerable damage.

One truly horrific chart is that of M1 Money and M1 Money Velocity (M1/GDP). M1 Money surged with Covid driving M1 Money Velocity down to levels never seem before.

The broader measure of money, M2, isn’t as dramatic, but we also see that M2 Money VELOCITY has plunged to levels never seen before.

What does low money velocity indicate? Simply put, The Fed is printing trillions of dollars, but GDP isn’t moving much. But that won’t stop Congress from spending (and using The Fed to buy its debt).

So, here we sit. This morning, the US Treasury yield curve (10Y-2Y) remains inverted. This AM, the curve inverted another -.591 basis points to -42.725, a sign of impending recession.

Yes, we are living through Jay Powell’s famous chili episode where money velocity is near historic lows and we have an inverted yield curve.

BTW, congratulations to Will Zalatoris (aka, Happy Gilmore’s caddy) for his first PGA Tour victory at the FedEx St. Jude Championship!

Winter Is Coming! Mortgage Rates, Gasoline Prices, Food Price Growth Slowing As Money Printing Slows (Just Wait For Winter!)

Politicians like to (falsely) take credit for things, such as Biden bragging about gasoline prices declining. Bear in mind that regular gasoline prices were $2.88 when Biden was inaugurated as President, rose to over $5 a gallon in June and now have declined to $3.98 for which Biden is taking credit. So, regular gasoline prices are still up 34% under Biden. Ouch!

But other rates and prices are dropping too. Bankrate’s 30yr mortgage rate started at , broke the 6% plane on June 21, 2022 only to drop to 5.53% on Friday. CRB’s foodstuffs price index started at 370.58 on Biden’s inauguration as President, rose to 606.71 on May 17, 2022 then retreated to 561.32 on Friday, August 13th. Even headline inflation (CPI YoY) is cooling … slightly.

You can see the recent declines in mortgage rates, gasoline and food prices (pink box) that corresponds to a shrinking of the US M2 Money stock growth. M2 Money is still growing at torrid pace (8.5% YoY) almost back to pre-Covid stimulypto levels of 6.8% YoY. So shrinking M2 Money growth is helping reduce mortgage rates and inflation, food/gasoline prices.

Instead of trying to remove Fed stimulus even more, Biden and Congress passed the “Inflation Reduction Act” which will barely scratch inflation and raises taxes across the board (despite Biden’s promise that no one making under $400,000 will see a cent of increase taxes). And Biden’s preposterous promise ignores the inflation tax which has been severe and still growing at 8.5% YoY. Not 0% as Biden and Harris claimed.

But wait for winter as food, gasoline and heating prices start to soar again.

My favorite dim-witted explanation of inflation belongs to Democrat Representative Pramila Jayapal who recently claimed that “inflation is a theoretical word that economists use.” Like the brilliant Milton Friedman???

US 30Y Mortgage Rate Climbs To 5.54% While 5/1 ARM Rate At 4.20% (134 Basis Point Spread)

Mike Lea and I wrote a paper entitled “Do We Need The 30yr FRM (Fixed-rate Mortgage)”. We argue that millions of Americans would benefit from an adjustable-rate mortgage like the 5/1 ARM for a host of reasons.

One good reason for a 5/1 ARM is the fact that it 134 basis points less expensive than the 30yr fixed-rate mortgage.

Mortgage rates have risen dramatically with the expectation of Fed rate tightening (green line).

Yes, there is a “fear factor” built in the 30r FRM (“OMG! The mortgage market will collapse without the 30yr FRM!!!!) Hogwash. Or malarkey, as Joe Biden likes to say. The mortgage market actually see the US join the rest of the world in having adjustable-rate mortgage being the predominant mortgage product.

US ARM share peaked at 10.8% in June 2022 before retreating to 7.4% as the 30yr mortgage rate retreated.

The 5/1 ARM product can help the affordable housing crisis in the US if we just let markets work. But in Washington DC, the term “free markets” is like the old Dobie Gillis character Maynard G. Krebs and the word “Work.”

US Producer Price Index Cools To 9.8% YoY In July As M2 Money Growth Cools And Recession Probability Increases

Somehow I doubt if Biden, Harris and Jean-Pierre (Biden’s Press Secretary) will go on the talk show circuit talking about the Producer Price Index Final Demand at 9.8% YoY, meaning that inflation is still raging.

But the curious thing about the PPI Final Demand numbers. While lower than June’s reading of 11.3% YoY, it also coincides with declining gasoline prices and declining growth in M2 Money stock. Which is still growing at 5.9% YoY. The probability of recession is rising (even though technically the US is in recession after 2 consecutive quarters of negative GDP growth.

Here is the more striking chart.

So is the US “improving” on prices because of brilliant Biden strategies (I just laughed at my own “bon mot”)? Or are prices (PPI, gasoline) slowing because of declining demand as the US slips into recession?

Lawrence Summers was once again in the news saying that the way to cool inflation is to raises taxes (and cool demand). Only a true Statist would say something like that. Larry, how about Biden and Congress stop spending so much money that is helping to fuel inflation?

One Washington DC types would rest their hopes on cooling inflation by having the US slip into recession AND raises taxes.

Biden looking for a way out.

What Biden Meant When He Said Zero Inflation (July CPI Rose 0% In July) While REAL Earnings Growth Remains Negative And Rent CPI Soars

Joe Biden is without a doubt the worst communicator in Presidential history.

Here is clip of him explaining how wonderful the US economy is under his leadership. 0% CPI growth in July after a great jobs report where 528k jobs were added.

While President Biden is technically correct (CPI didn’t increase from June to July), he left out that headline inflation was still painful at 8.5% YoY and core inflation was 5.9% YoY. He also left out that CORE inflation rose 0.3% in July. And he left out that REAL earnings growth was still negative.

The midterm elections are approaching fast and, of course, Biden and his crew have to put the best face of his and the Democrats accomplishments. But seriously Joe, REAL weekly earnings growth is negative meaning that inflation is crushing wage growth. Meanwhile, CPI rent is skyrocketing and was 5.8% YoY in July.

As we know, the CPI measure of rent is terrible and does not reflect the actual rise in rents. Zillow’s Rent index YoY is slowing, but remains at 14.75% YoY, far higher than the CPI rent measure of 5.8%.

So, the Federal Government and Federal Reserve keeps pumping trillions into the economy, so it is not surprising that we have rampant inflation crushing renters.

US Treasury Yield Curve Descends Further Into Darkness (-48.4 BPS) As Supply Of Homes Increases 30.7% In June (Fed Is Cooling Off Housing Market)

The US Treasury 10Y-2Y yield curve is descending further into darkness (aka, inversion).

The 10Y-2Y yield curve hit the worst inversion since 2000 as the curve slope hit -47.7 basis points, inverting another -2.267 basis points today.

Yes, the 10Y-2Y Treasury yield curve is SCREAMING RECESSION.

(Bloomberg) – Prashant Gopal – The supply of homes for sale across the US grew at a record rate last month, another sign that higher mortgage costs are cooling down the housing market.

The number of active listings nationwide jumped 31% from a year earlier, a record-high increase for a third straight month, according to a report Tuesday by Realtor.com. 

And according to Redfin, stale inventory is accelerating.

The Federal Reserve is no friend of the US middle class and low wage worker.

Simply Unaffordable! Gap Between Real Home Price Growth (+11.17% YoY) And Real Wage Growth (-2.15% YoY) Near Highest Since 1988 (REAL 30Y Mortgage Rate Is Now -3.23%)

The US housing market is simply unaffordable for millions of Americans. To illustrate the problem, here is a chart of the Case-Shiller National home price index less CPI YoY graphed against Average Hourly Wages less CPI YoY.

The gap between the REAL national home price index YoY and REAL US average hourly earnings YoY is near the largest since 1988. Inflation is making matters far worse since REAL average hourly earnings growth continues to decline.

The only thing positive to say is that REAL home price growth YoY is lower now than at the peak of the 2005 home price bubble that burst catastrophically.

Another “positive” is that the REAL 30-year mortgage rate has fallen to -3.23%. At the peak of the house price bubble in June 2005, the REAL 30-year mortgage rate was +2.58%. THAT is one big difference between the pre-2008 recession and today’s impending recession.

US 10-year Treasury Yield Surges +14 Basis Points As Strange Jobs Report Spurs Fed Rate Hike Fears

Today’s jobs report was … strange. While the US economy added more jobs than expected, we also saw labor force participation contract and real wage growth decline again.

The reaction in the bond market? US Treasury 10-year yields exploded by +14 basis points. As I used to tell my fixed-income students, any basis point jump or decline of 10 basis points or more is a BIG DEAL.

The implied target rate for The Fed (based on Fed Funds Futures) is now lower for the Jan 1, 2024 FOMC meeting (3.025%) than it is for the Sept 21, 2022 FOMC meeting (3.034%).

Mortgage rates? They will go up as The Fed removes its Brawndo, the economy mutilator.