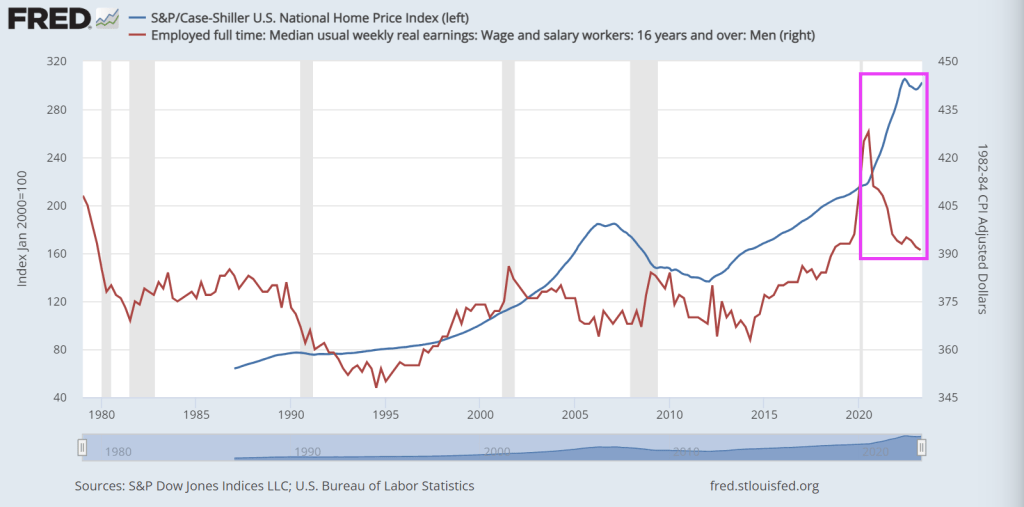
If we look at the Case-Shiller National home price index against real weekly wage growth, you can see the problem clearly. Since Covid and The Fed’s overreaction by providing staggering monetary stimulus, home prices shot up while real median weekly earnings collapsed.
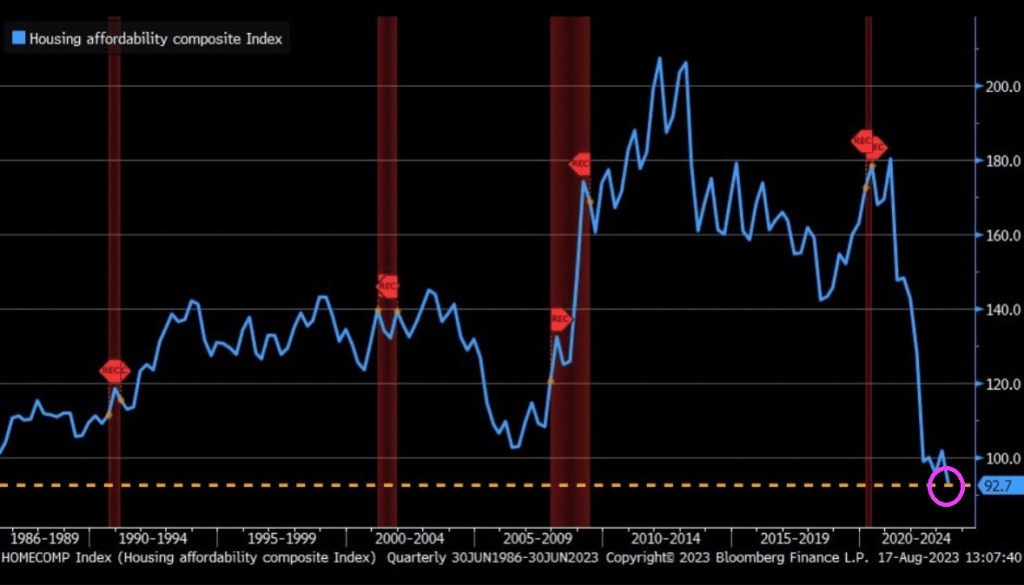
Buying a house requires a much bigger slice of people’s income now — making this the most unaffordable housing market since 1984, by one measure.
And that crushing lack of affordability isn’t expected to improve much in the near future.
At today’s rates, buying a median-priced home would require a monthly principal and interest payment of $2,440 for those making a 20% down payment, according to Black Knight, a mortgage technology and data provider.
That’s $1,172 a month more in mortgage payments from just two years ago, before the Federal Reserve raised its benchmark lending rate 11 times in 18 months, Black Knight found. It’s a 92% increase — and is taking a growing chunk out of household budgets already facing inflation on many fronts.
Currently, 38.6% of the median household income is required to make the monthly payment on the average home purchase, making housing the least affordable it’s been since 1984, according to Black Knight.
“To put today’s affordability levels in perspective, it would take some combination of up to a 28% decline in home prices, a more than 4% reduction in 30-year mortgage rates, or up to a 60% growth in median household incomes to bring home affordability back to its 25-year average,” said Andy Walden, vice president of enterprise research and strategy at Black Knight.
Must as well face it, we’re addicted to gov. Or at least Fed monetary stimulus.
Just look at Personal Interest payments under Bidenomics.
Joe Biden is an incredibly weak President. I am not talking about his age or his deteriorating mental faculties. I am talking about ordering his attorney general to indict his chief political opponent, Donald Trump. How does the world interpret this weakness? BADLY.
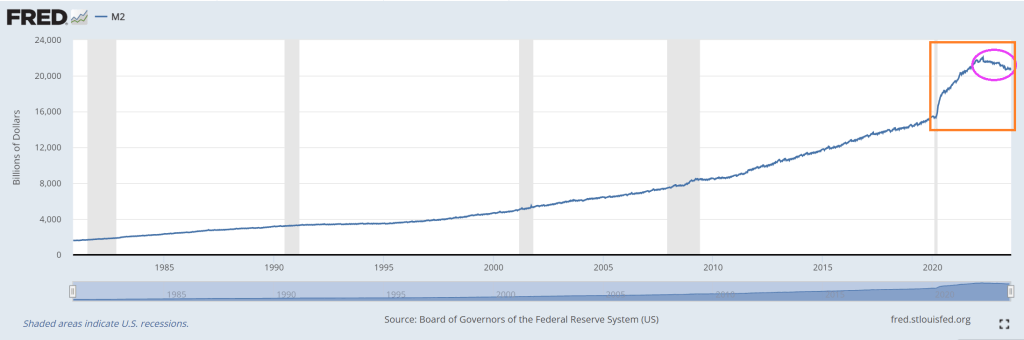
The US has gone off the rails in terms of printing money, particularly since COVID struck and money printing went wild.
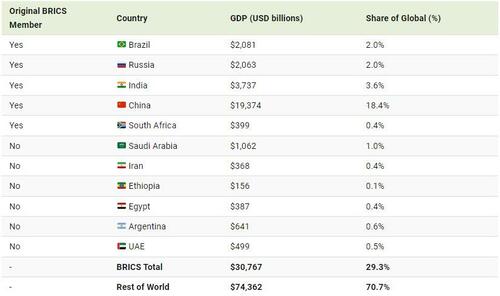
Under Biden’s Reign of Error and the US reckless money printing, more countries are abandoning King Dollar (based of fiat currency) and joining BRICS. Brazil, Russia, India, China, South Africa and a host of countries joining like Argentina, Saudi Arabia, Iran, Egypt, UAE, etc.
Now, the rest of the world is still stuck on the US Dollar as reserve currency … for now. But as Biden gets weaker and weaker, watch more countries join BRICs.
According to Reuters, there are over 40 countries that have expressed interest in joining BRICS. A smaller group of 16 countries have actually applied for membership, though, and this list includes Algeria, Cuba, Indonesia, Palestine, and Vietnam. Pretty soon, under Biden’s crazy leadership, we may be the last man standing in using the US Dollar as reserve currency.
Then we have the other shoe dropping with Bidenomics.
As soon as Biden took office, he set out to destroy industries that produce reasonably priced energy. He focused tremendous effort on deficit spending and borrowing to hand out “government goodies” to buy votes; recipients of this government largesse, in large part, included debt-saddled students, the green mafia, and leftist activists.
When Biden took office, inflation was under 2%, despite COVID and supply chain disruptions; shortly after, it skyrocketed to over 9%. Now inflation increases are “down” but prices remain exceptionally high compared to pre-Biden.
For example, crude oil prices, which affect almost everything and are used in over 6,000 products, are roughly double what they were when Biden took over.
President Trump focused on reduced regulations and energy independence, and implemented lower tax rates, all moves that greatly helped the American people. In contrast, Biden focuses on ensuring bureaucrats rapidly increase regulations which raises costs for everyday Americans; he’s waging economic war against us. Very few of Biden’s regulations go through Congress. From the White House archives:
Between FY 2017 and FY 2019, the Trump Administration has cut nearly eight regulations for every new, significant regulation….
The Council of Economic Advisers (CEA) estimates that this pro-growth approach to Federal regulation will raise real incomes by upwards of $3,100 per household per year.
Here are some recent reports of how well Biden policies are working:
Leading economic indicators have fallen for sixteen straight months. Maybe that is why people think the economy is moving in the wrong direction?
The current cost-of-living crisis is a manufactured one. As inflation rose, the Federal Reserve was forced to raise interest rates, which saw fewer people move. The cycle is very understandable, as simply explained in this one headline, “Housing Crunch: Home Sales Fall To Six Month Low…But Prices Rise Anyway”.
Parcel volumes are dropping by so much, freight pilots are “worried” about job security.
People are running up credit card debt and defaulting on car loans because of high inflation, and because their real wages haven’t been able to sustain them. Now, even more are falling behind on their payments. From CNN:
More Americans are failing to make payments on their credit cards and auto loans, another sign of rising financial pressure on consumers.
New credit card and auto loan delinquencies have now surpassed pre-Covid levels, according to a Wednesday report issued by Moody’s Investors Service.
After years of promoting and subsidizing electric cars, they represent around 6% of total sales, and demand is clearly slowing. It wasn’t that long ago that well-to-do people were buying these electric toys so quickly that they were placed on waiting lists; now, inventories are building because they are too impractical and expensive:
Auto News understands that there is currently a 103-day supply of unsold EVs in the United States. While it did not specify how many units are sitting on dealership lots, it says there is a higher supply of unsold EVs than any other automotive segment, except those in the ultra-luxury and high-end luxury segments with supplies also reaching over 100 days.
So what is Biden’s solution? Force people to buy them.
Here are some simple economics questions for the media and other Democrats:
Does flooding the U.S with illegals help or hurt housing availability and affordability?
Will the intentional destruction of oil and coal companies help or hurt the middle class and the poor?
Yet, the media and other Democrats brag that Biden’s economic policies are great, and when the public gives Biden poor marks, they say that we just don’t understand, and we’re not willing to get behind a candidate if they fail to make us feel “warm and fuzzy.”
Are journalists really that unaware?
Of course, they always sought to destroy Trump as his policies, even as poverty sank to record lows amongst minorities, because they don’t really care about anything but big government. According to Census data:
In 2019, the poverty rate for the United States was 10.5%, the lowest since estimates were first released for 1959.
Poverty rates declined between 2018 and 2019 for all major race and Hispanic origin groups.
Two of these groups, Blacks and Hispanics, reached historic lows in their poverty rates in 2019.
Results and facts haven’t mattered to the complicit leftist media for a long time.
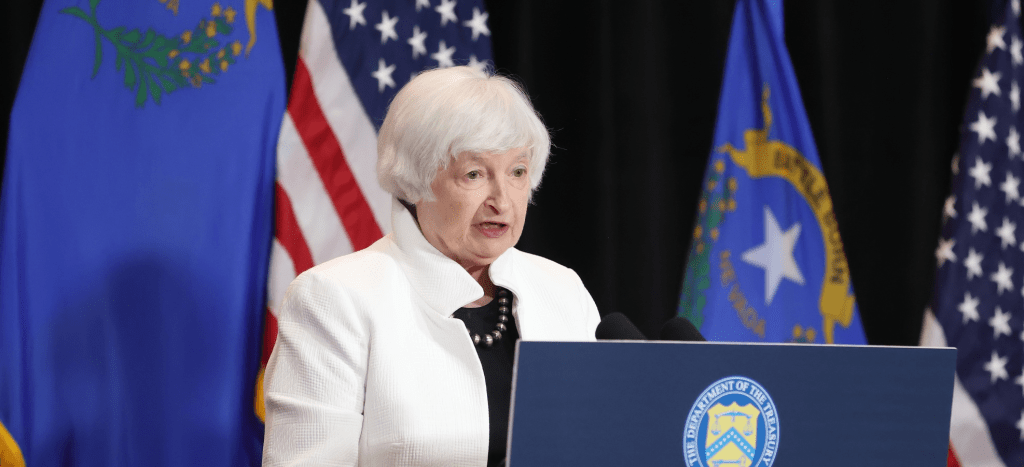
And perhaps the worst mistake Biden made (amongst his laundry list of horrible mistakes, [Afghanistan retreat, not showing up to E Palestine Ohio, Bidenomics that is a payoff to green donors and BIG corporate interests, an embarrasing visit to Maui two weeks after the fire, indicting his leading political opponent, ….) is the appointment of the WORST Federal Reserve Chair (Janet Yellen) as Treasury Secretary.
Joe Biden will always be remembered for lying about never raising taxes on households making under $400,000. Inflation is a permanent tax, mostly on those making under $400,000 per year. And household essentials are up substantially under Biden: gasoline prices are up 72%, rent CPI of Primary Residence is up 16%, and food at home CPI is up 20%! That is a HUGE tax on the middle class.
When CPI falls this does not mean that prices on goods and services are going down, it only indicates that prices are rising slower than they were the month or the year before.
Another misconception about CPI is that it measures the inflation rate accurately for regular consumers on common purchases. In reality, the CPI represents mean average price rate increase for a vast basket of goods; over 94,000 items and services with over 200 separate categories. Most of these items and services you will never use or rarely purchase in the span of a year. In other words, inflation declines in uncommon goods can dilute the numbers, making it seem like inflation is dropping while prices on daily necessities continue to spike.
The CPI is weighted according to consumer spending patterns, which is where the calculations can be “adjusted” to a certain extent in an arbitrary manner. Then there is outright government manipulation through various means. As we witnessed recently with the Biden Administration’s claims that “Bidenomics” has defeated the inflation threat, what these reports don’t mention is that Biden has been dumping US strategic oil reserves on the market for the past year. And since energy prices effect the inflation of so many other categories, Biden has artificially manipulated the CPI down using one key resource.
Now that his ability to dump oil reserves has ended, CPI will rise once again along with energy prices.
The point is, it’s impossible to get a sense of the real damage from inflation without looking at the cumulative inflation in necessities (the goods and services that people are required to purchase on a regular basis to live day to day). If we throw out the CPI distraction and look at common necessities since 2020, the economic picture is far more bleak.
Overall food prices have soared by 25%-30% in only three years (again, this means that you are now paying 30% more this year for food than you were paying at the beginning of 2020). Chicken is up from $3 per pound to $4 per pound. Beef is up from $3.50 to $6 per pound. Corn is up from $3.50 per pound to $4.70 per pound. Wheat is up from $5 per pound to $7 per pound. In 2019 the average American household was spending $8100 on food annually; with a 30% increase, in 2023 Americans will be spending at least $10,500 per household.
By the end of 2019, the average rental price of a single family home was around $1450 per month. This year the price is around $2000 per month. At the beginning of 2020, the median cost of a home was $320,000; by 2023 the price skyrocketed to an average of $416,000.
For gasoline, the price in early 2020 was around $2.50 per gallon. The price has fluctuated dramatically due to Biden’s manipulation of the market using strategic reserves, but still remains high today at $3.80 per gallon.
The cost of electricity has risen swiftly, holding steady around .13 cents per kilowatt hour for a decade, then spiking to at least .17 cents per kilowatt hour by 2023.
Remember, most of these costs are static and are difficult to reduce through household spending cuts. These are not items that are easily removed from a monthly budget and the expenditures add up to considerable pressure on consumer accounts. This is probably why around 74% of the public in polls say that the economy is getting worse, not better. It’s because government statistics are not highlighting the true inflationary crisis.
When we look at the cumulative climb of prices in necessities since before the inflation crisis officially began, the truth is that Americans now have to increase their wages by at least 25%-30% on average to maintain the same standard of living they had three years ago. This is a disaster not seen since the stagflationary event of the 1970s and early 1980s. If you have a strange feeling like your bank account is being rapidly drained in recent months, that’s because it is.
And the 30-year mortgage rate is up 163% under Middle Class Joe.
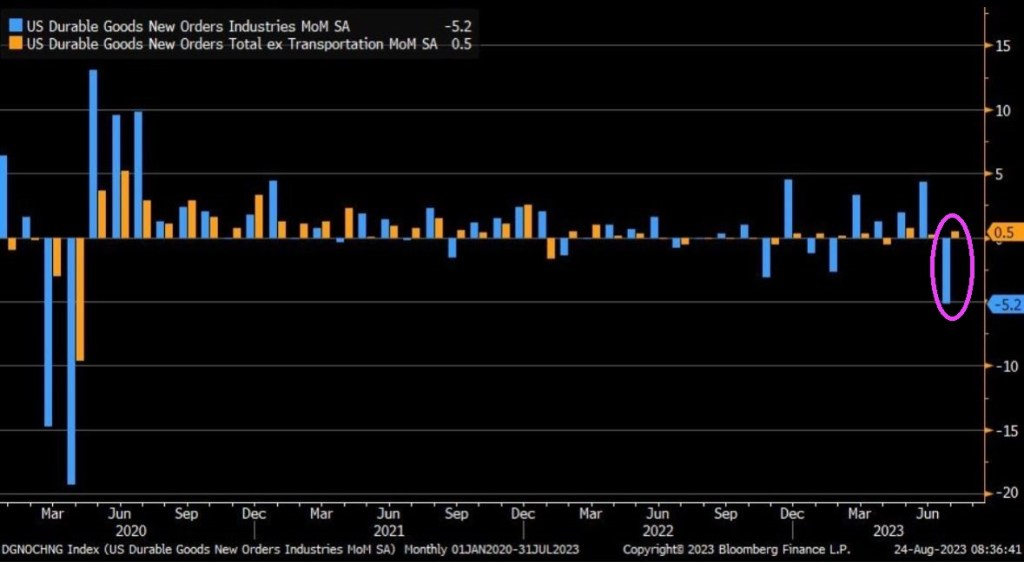
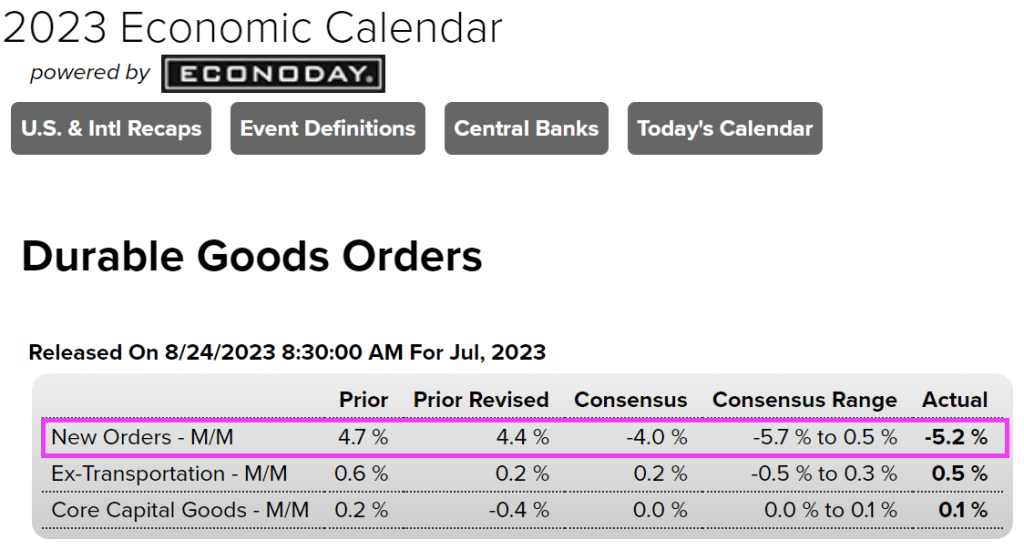
July durable goods [blue] new orders plummet, recording the worst month since C19 in April 2020. Durable goods fell on a MoM basis by -5.2%, versus -4% consensus estimate. Durable goods ex-transportation [orange] still rose on a MoM basis by +0.5%, perhaps highlighting the weakness in durable goods orders.
Ex-transportation, durable goods order rose slighlty in July by 0.5%.
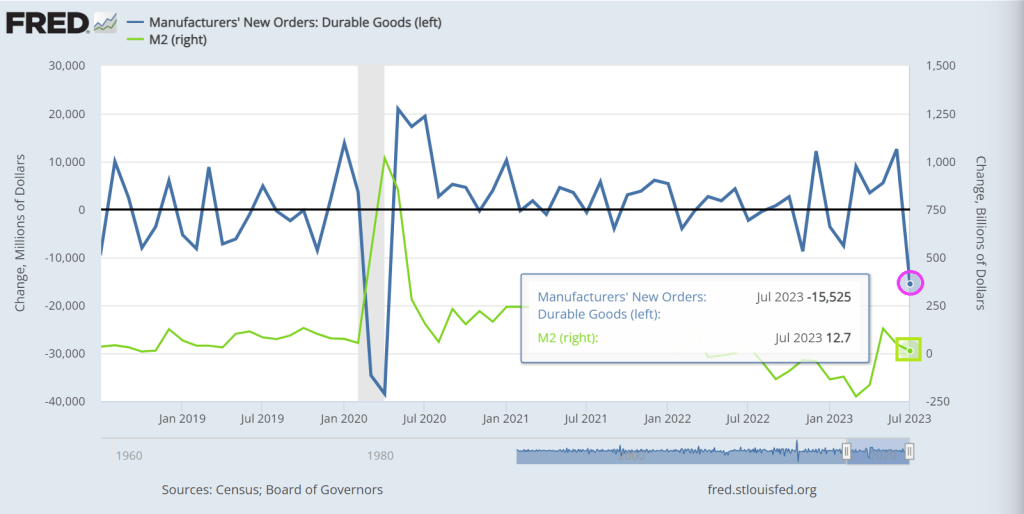
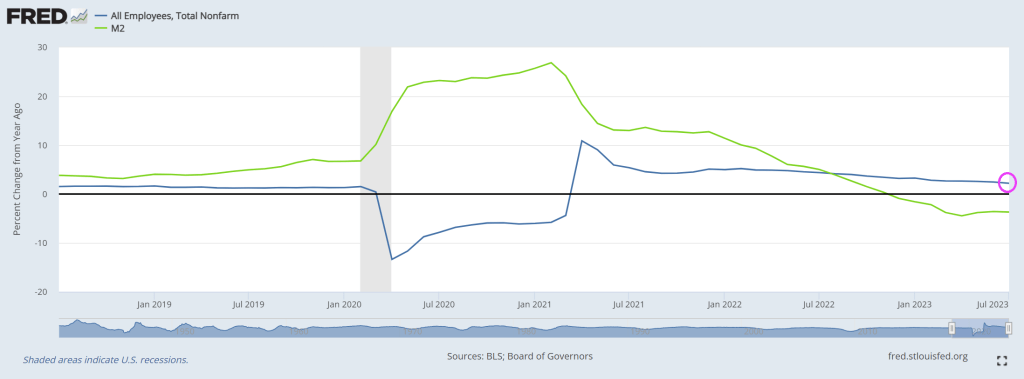
But according to The Fed of St Louis, durable goods new orders were down -15.525% from June to July (MoM) while M2 Money printing growth rose 12.7% MoM.
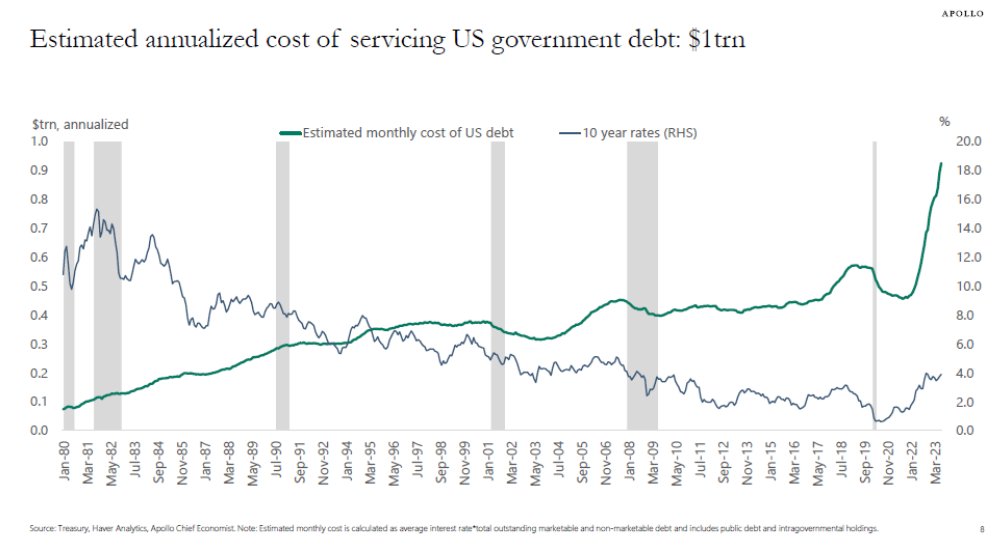
Let’s see. We have inflation that is eroding wage growth so that REAL wage growth is negative. Meanwhile, the Biden Administration and Congress are spending like they can print infinite amounts of cash with no consequences. The result? The Federal government is paying nearly $1 trillion in interest on an annualized basis.
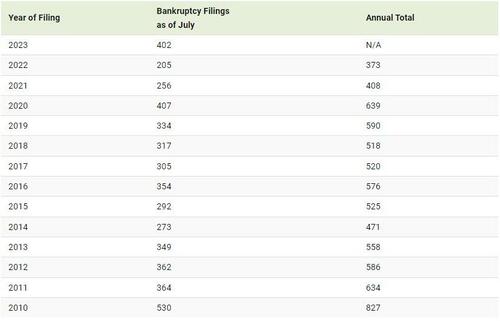
On the corporate side, we are seeing a surge in bankruptcies.
So far in 2023, over 400 corporations have gone under. Corporate bankruptcies are rising at the fastest pace since 2010 (barring the pandemic), and are double the level seen this time last year.
Below, we show trends in corporate casualties with data as of July 31, 2023:
Represents public or private companies with public debt where either assets or liabilities are greater than or equal to $2 million, or private companies where assets or liabilities are greater than or equal to $10 million at time of bankruptcy.
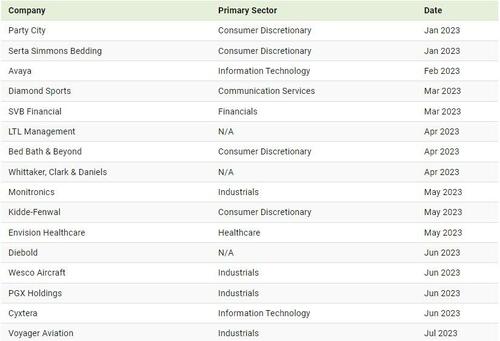
Firms in the consumer discretionary and industrial sectors have seen the most bankruptcies, based on available data. Historically, both sectors carry significant debt on their balance sheets compared to other sectors, putting them at higher risk in a rising rate environment.
Overall, U.S. corporate interest costs have increased 22% annually compared to the first quarter of 2021. These additional costs, combined with higher wages, energy, and materials, among others, mean that companies may be under greater pressure to cut costs, restructure their debt, or in the worst case, fold.
Billion-Dollar Bankruptcies
This year, 16 companies with over $1 billion in liabilities have filed for bankruptcy. Among the most notable are retail chain Bed Bath & Beyond and the parent company of Silicon Valley Bank.
Mattress giant Serta Simmons filed for bankruptcy early this year. It once made up nearly 20% of bedding sales in America. With a vast share of debt coming due this year, the company was unable to make payments due to higher borrowing costs.
What Comes Next?
In many ways, U.S. corporations have been resilient despite the sharp rise in borrowing costs and economic uncertainty.
This can be explained in part by stronger than anticipated profits seen in 2022. While some companies have cut costs, others have hiked prices in an inflationary environment, creating buffers for rising interest payments. Still, S&P 500 earnings have begun to slow this year, falling over 5% in the second quarter compared to last year.
Secondly, the structure of corporate debt is much different than before the global financial crash. Many companies locked in fixed-rate debt over longer periods after the crisis. Today, roughly 72% of rated U.S. corporate debt has fixed rates.
At the same time, banks are getting more creative with their lending structures when companies get into trouble. There has been a record “extend and amend” activity for certain types of corporate bonds. This debt restructuring is enabling companies to keep operating.
The bad news is that corporate debt swelled during the pandemic, and eventually this debt will come due likely at much higher costs and with more severe consequences.
The face of Bidenomics: the top 1% are gleefull (like Billions Biden), the bottom 99% are mournful.
Preliminary benchmark revision smaller than some had projected
Biggest payrolls adjustment in transportation and warehousing
Are you surprised that the Biden Administration has been lying about job creation?? Not really since Biden compulsively lies about everything. Including his corruption.
US job growth was probably less robust in the year through March than previously reported, according to government data released Wednesday.
The number of workers on payrolls will likely be revised down by 306,000 for March of this year, according to the Bureau of Labor Statistics’ preliminary benchmark revision.
Even without the revision, job growth has slowed to 2.2% YoY in July as M2 Money growth slowed to -3.7% YoY.
Let see what our Overlords say at the Jackson Hole Fed symposium.
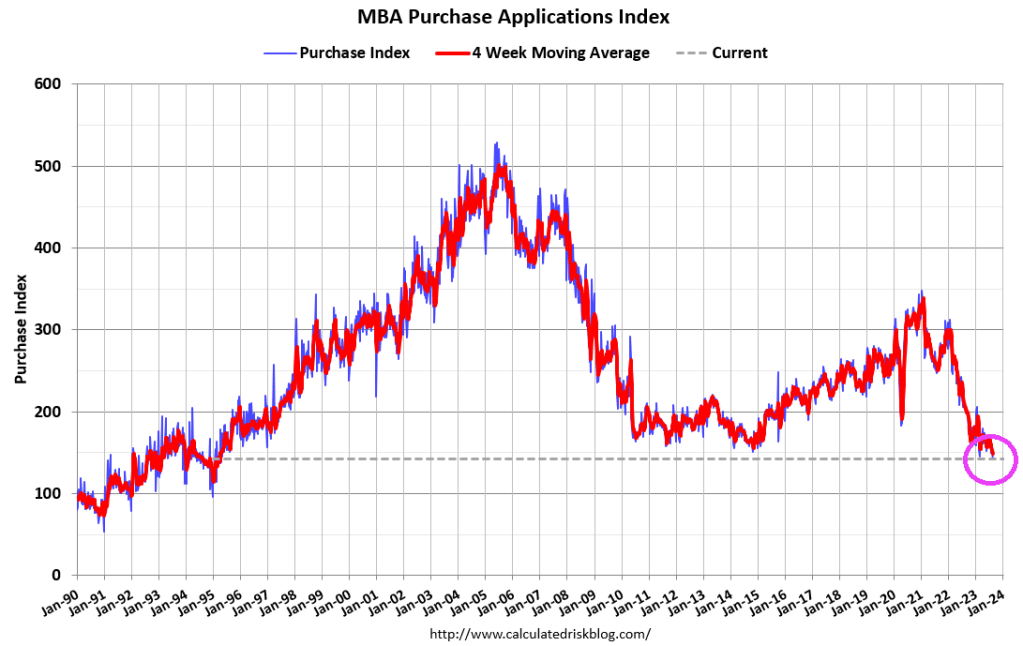
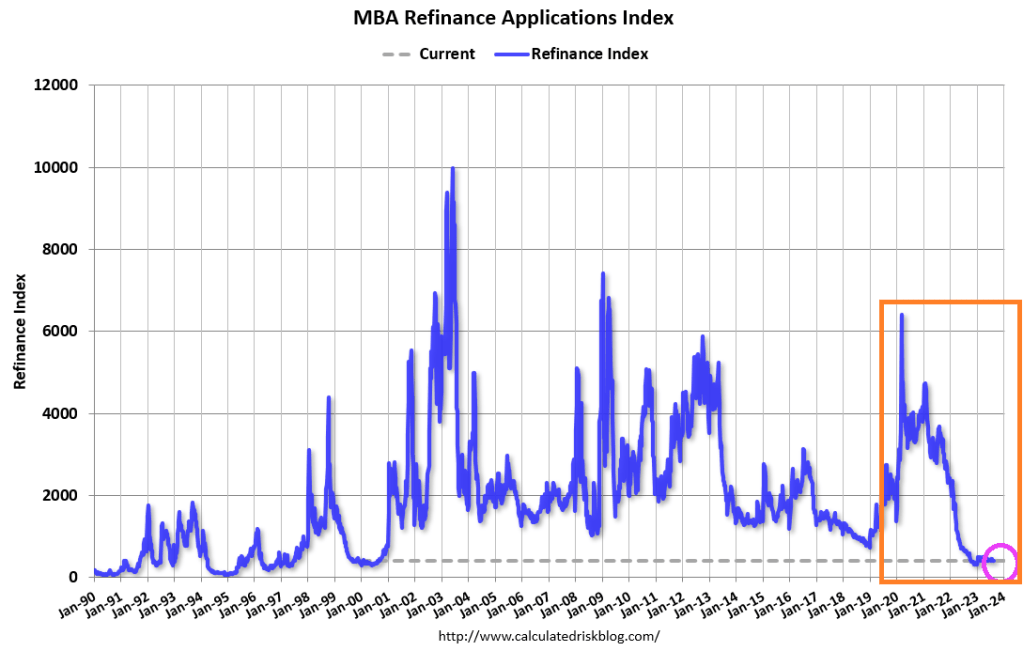
Mortgage demand (applications) decreased 4.2 percent from one week earlier, according to data from the Mortgage Bankers Association’s (MBA) Weekly Mortgage Applications Survey for the week ending August 18, 2023.
The Market Composite Index, a measure of mortgage loan application volume, decreased 4.2 percent on a seasonally adjusted basis from one week earlier. On an unadjusted basis, the Index decreased 6 percent compared with the previous week. The Refinance Index decreased 3 percent from the previous week and was 35 percent lower than the same week one year ago. The seasonally adjusted Purchase Index decreased 5 percent from one week earlier. The unadjusted Purchase Index decreased 7 percent compared with the previous week and was 30 percent lower than the same week one year ago.
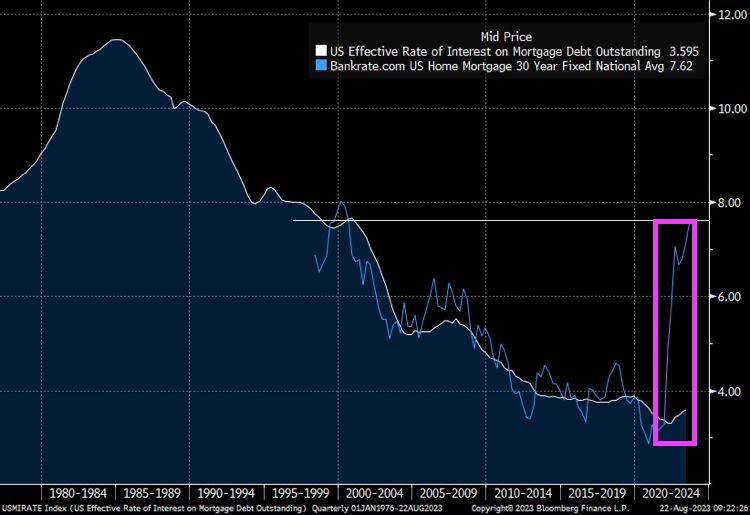
The spread betweenn Bankrate’s 30 year rate at 7.62% and the effective rate on mortgage debt outstanding at 3.595% has exploded as mortgage rates jump.
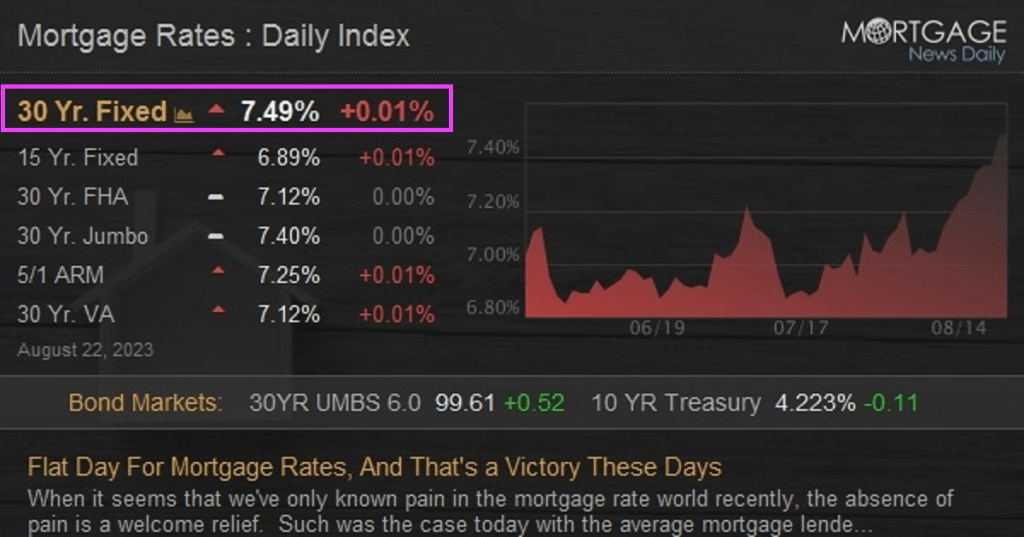
Today’s mortgage rates are up to 7.49%. OMG!
Bidenomics (code for making large donors wealthier and the middle class getting the boot) and catch-up for Yellenomics (rates too low for too long), and Powell are helping to burn down the housing market.
Thanks to the crippling effects of Bidenomics (Fed easing then tightening to combat inflation caused by insane green spending and a war in Ukraine), US mortgage rates (conforming 30-year) has increased 159%.
On the yield curve side, the US Treasury curve 10Y-2Y CMT fell from 99 basis points the day after Maui Joe was sworn-in as El Presidente to the inverted curve we see today (-63 basis points).
Dynamic Maui Joe looking less than happy trying to visit Maui while he could be partying with mega-donor Tom Steyer (a big green energy con artist).
At least Biden didn’t wear his aviator sunglasses or down an ice cream in a show of “empathy.” But, of course, he did find time to assault a child! Watch the hands Maui Joe!!!!
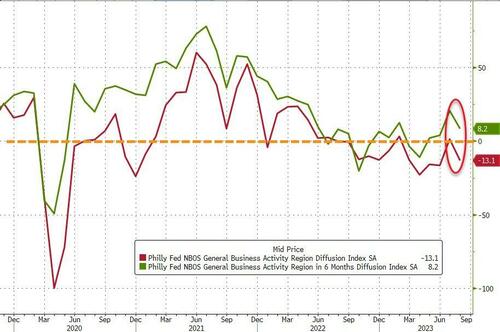
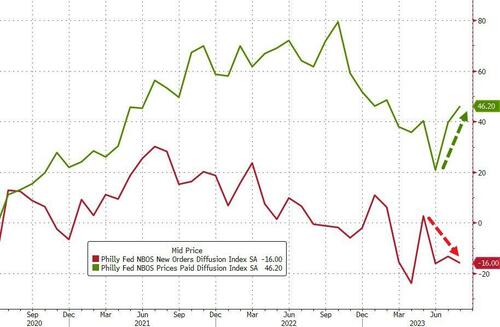
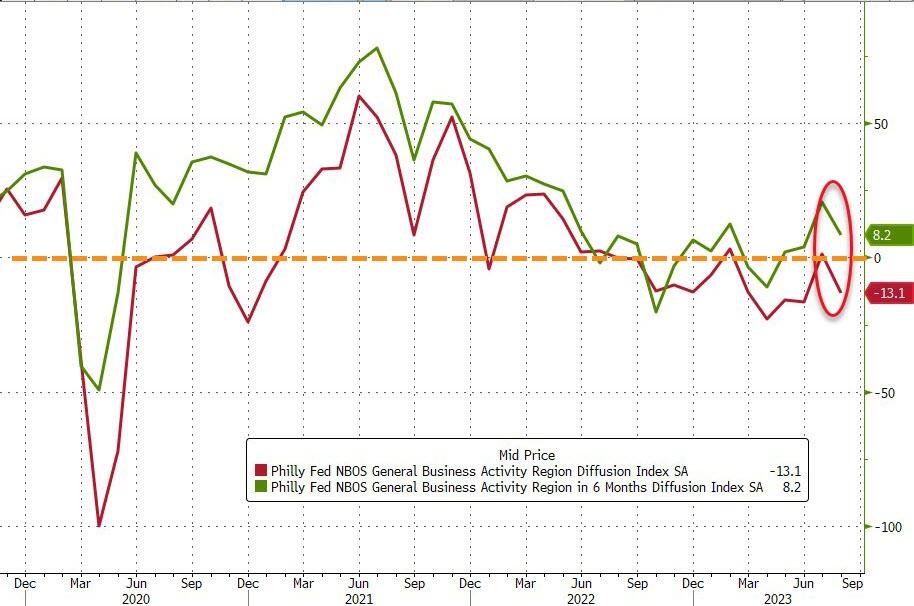
It’s NOT always sunny in Philadelphia. Particularly when the Philly Fed non-manufacturing survey screams stagflation (a nauseating combination of economic slowdown and inflation).
On a non-seasonally-adjusted basis, the Philly Fed Services survey plunged to -20.0 – practically its lowest level since the COVID lockdowns…
Source: Bloomberg
Under the hood it’s even uglier with stagflationary impulses rearing their ugly heads.
Price indicator readings suggest continued increases in prices for inputs and the firms’ own goods and services.
The prices paid index increased 7 points to 46.2 this month. More than 50 percent of the firms reported increases in input prices. Regarding prices for the firms’ own goods and services, the prices received index rose from 7.8 to 14.6.
At the same time the indexes for sales/revenues and new orders both recorded negative readings this month
Source: Bloomberg
Is the ‘Services’ side of the economy finally catching down to the reality of the ‘Manufacturing’ side as savings run dry?
Yes, The Fed has a line on you! And will likely keep raising rates as inflation stays elevated. This means higher mortgage rates unless China slips into a deflation doom loop.
Thanks in part to The Fed, housing affordability is at the lowest level since the 1980s.
And we are seeing tail volatility in the US Treasury futures.
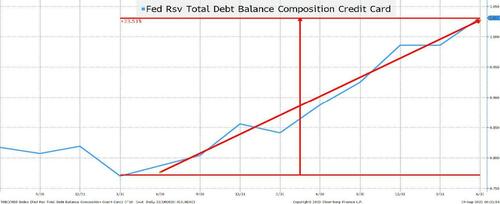
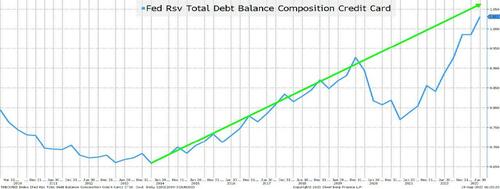
Fastest Ever Rate of Increase in Credit Card Debt!!
Credit card debt has been rising at what seems like an alarming rate. To cope with Bidenflation.
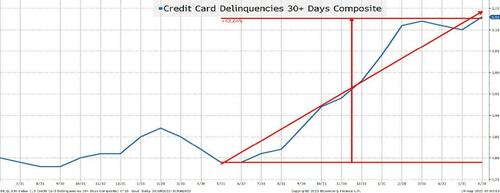
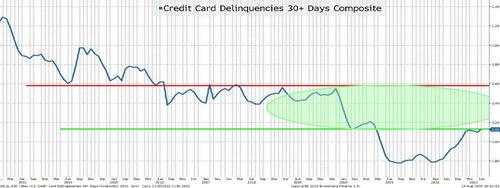
Credit Card Delinquencies Gapping Higher!
This chart seems almost scary because it shows a rapid rise in delinquencies. While not quite “parabolic” it has increased by almost 50% in a little over a year! However, 0.8% to 1.15% seems a lot less scary than saying it has increased by 50% (which is why I tune out whenever anyone talks about credit spread moves in percentage terms).
Not only is credit card debt rising at an alarming rate, it is also coming just as delinquencies spike higher!
The Consumer is Normalizing
Let’s revisit the prior two charts but use a different time horizon.
Credit Card Debt Remains Below Trend
Credit card debt rose at a steady pace from 2013 until late 2019. Then COVID, stimulus, work from home, and supply chain issues all seemed to coalesce into an amazing drop in credit card debt. While we can question whether credit card debt should have been rising at the rate that it was before COVID (and whether it was sustainable or not), we should just accept that it was. Maybe population growth has changed (or it was some other factor), but if you “strip out” the COVID phenomenon, we are basically back to trend. I do think that credit card balances are an issue, but it is an issue that we seem to have dealt with in the past.
On credit cards, I completely ignore any impact from Fed hikes because credit card interest rates have always been very high relative to any other rate. What drives credit card balances doesn’t seem to be a thoughtful analysis of rates. It has always been (at least to some degree) about instant gratification.
Bottom line is that while the trend may not be sustainable, the recent rise just brings us back to trend, which takes some of the sting out of the fact that the consumer is in dire trouble.
Delinquencies are Below the 5 and 10-Year Averages!
So, delinquencies aren’t even back to pre-COVID levels. This data series averaged 1.5% for the 5 years prior to April 2020, and was 2.1% for the 10-year period before COVID (and let’s not even think about where it was post GFC).
I’m not all warm and fuzzy about the consumer, but I’m not alarmed either.
Auto Loans
Auto loans are a bit trickier. From the consumer’s point of view, they tend to be at a fixed rate and many were entered into when rates were low. In fact, if memory serves me correctly, the average maturity of auto loans extended in recent years allowing consumers to lock in low rates for longer (hopefully the lenders hedged their rate exposure on those auto loans).
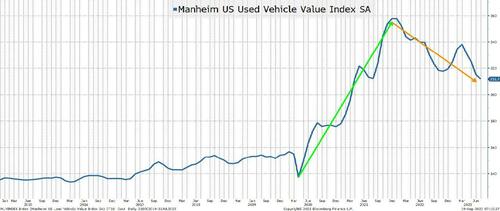
Used Auto Prices are Receding
Used car prices are declining from record highs. That may pose problems to lenders who calculated too much residual value on loans and leases to consumers who thought that we were in a brave new world where even used cars went up in value.
Having said that, the prices for used cars remain robust and my understanding is that it is still extremely difficult to buy the most popular new models (and they often fetch a premium to NAV). Nothing like in the heyday of the supply chain issues, but something that should “normalize” over time.
Auto dealers benefited from a lack of inventory, and I will be curious to see if they can retain their sales with low levels of inventory and (ultimately) pass some of those efficiencies through to the consumer.
With autos being such an important part of the economy, it is something that I watch, but much like the story we heard in credit cards, a lot of the negatives that I’m reading about are simply a “normalization” which may be healthy for generating not just a soft landing, but a sustainable soft landing. However, the “slowing” is something to think about.
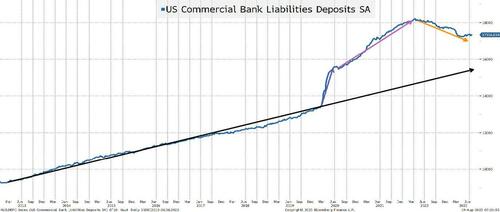
The Excess Savings Lie
I will spare you the agony of going through bank deposit charts on a short-term and long-term basis and just jump straight to the long-term chart. I used purple and orange arrows because I generally reserve green for good and red for bad and I’m not sure that these are “good” or “bad” deviations from trend.
Bank Deposits are Falling! But to Levels Still Around Trend.
I have argued that the “excess” in bank savings was never going to be put into the stock market (one of the bull cases, which may even still be floating around). I also think that there is a lot more than meets the eye about why there is so much in “excess” savings. Sure, without a doubt, COVID boosted savings. One thing that I “forgot” to mention earlier (or maybe I saved it on purpose) about the good things that happened to consumers during COVID is that there were many moratoriums placed on various types of debt service (i.e., student loans).
We can all agree that some amount of cash stayed in savings accounts because while savings accounts earned 0%, so did everything else. As people realized that they could earn more on their money market funds, some amount was going to be taken out of savings accounts paying little interest. Though, I do have to say that I was at the local bank branch a few weeks ago taking out money from the ATM and someone before me had left a receipt showing $99k in their bank account. I immediately thought “who does that?”, but there are obviously people who want bank accounts up to the FDIC limit.
My view has been (and will continue to be) that many people “earmarked” money that they would have to pay in the future and set it aside in a savings account. If you know moratoriums will end (and let’s not forget, these loans typically accrued interest during these periods), then it would be prudent to set aside some money for when those payments got turned back on.
If my theory is correct, you should see bank deposits decline faster as these moratoriums end and the money that was “earmarked” for certain payments is withdrawn to make those payments. Please see American Ingenuity. Not great for the economy or spending, but is “normalization” really bad?
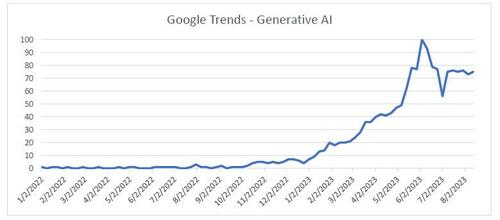
Generative AI
My intention is to use generative AI to help me do a report on “outliers”. This would include warning signs or positive things that the market may or may not be missing. After about an hour or so of brutally failed attempts this weekend, I gave up. I try to write these T-Reports with an estimate of how long it will take and how long the report will be but had absolutely zero clarity on whether the ChatGPT process would work. Hopefully I can make some interesting progress on the report early this week or I will declare it a failure. In any case, was Google trends (using generative AI) all you needed to buy or sell stocks successfully this year?
No one really cared about AI until February of this year. Yes, there were some searches, but very few. The Nasdaq 100 bounced in January, stagnated for a bit, and then started to do well from April until late July. It has sold off steadily since then. While not matching the trends in “generative AI” search, it might have been the best tool to use. The searches have stabilized and what will be interesting to see is if they peaked or if they increase as we end the summer and people are back at work fulltime across the board.
We will be focusing more on AI as Academy’s Advisory Board has grown the number of advisors with significant experience in the area and who are active today in the ongoing development of cyber and AI.
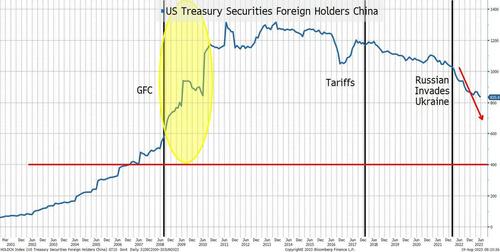
China
I promised that we’d get back to China, but for now I only want to highlight one chart. And, ironically, it is not a lie. It is the truth, and it is logical.
China’s Holdings of U.S. Treasuries
I highlight three periods.
Post GFC. When the U.S. economy was in tatters and much of the world was struggling, China was able to (or was willing to) accumulate more and more Treasuries. There is a lot of chatter about the decoupling of our economy from China’s right now, which is logical and will continue (the friction is real between the two nations and not getting better). I did, however, find it interesting that China accumulated so many Treasuries in the aftermath of the GFC. Prior to the GFC, the trend seemed obvious (U.S. was growing and buying stuff from China).
The tariffs sparked some discussion of potential retaliation from China, including the possibility that they would dump Treasuries. There was some decline in their holdings, but that could just as easily have been COVID related.
Since the Russian invasion of Ukraine and the decision to freeze Russia’s dollar holdings, there has been a steady decline in China’s Treasury holdings.
Some of the decline is due to the weakness in China’s economy and their potential need to prop up the property market (and maybe even those overly exposed to the “shadow banking system”).
Not only did we freeze Russia’s holdings (which tells me that we can do it again), but we have also been going after China on a myriad of fronts (most notably high tech, but increasingly for rare earths and critical minerals).
Our own debt ceiling issues and ratings may not help, but I’d be shocked if that entered into China’s calculus.
What I cannot tell from this chart is if it is an indication that China is successfully generating trade globally in yuan and has less need for dollars. That would fit my “shifting from made in China to made by China” view to a tee, but I’d be lying if I said that I could support that on this chart! Maybe generative AI will help me find evidence supporting that theory in places that I haven’t thought to look.
One thing that I think supports Treasury market bears is that there will be less of a global interest in holding Treasuries (with China leading the way).
Jobs
So much to do here and with or without AI, I will add more charts related to jobs later this week.
We have covered some of these areas in the past such as discrepancies in JOLTS between job openings and hires and the Establishment versus Household gaps. The fact that all these reports come in with declining response rates is another issue. It is difficult (mathematically) to accept the continuity of a data series when the response rate is declining without a serious investigation into why the response rate might be declining.
While we haven’t discussed it recently, the annual revisions always seem to dramatically reduce the published data for the prior year (but weirdly it doesn’t seem to have a market impact).
Today, I just bring up one chart because I find it fascinating in the lies, damned lies, and statistics theme.
The “Almost” Unbelievable Pattern of New Company Formation
The birth/death model is an estimate of jobs created or lost as new companies are formed or go out of business (or at least close enough for our purposes).
I challenge you to find any other jobs data that looks this “perfect”. It is a beautiful sawtooth pattern that looks almost uninterrupted! For most jobs data, the COVID period makes long-term charts almost impossible to review. The job losses and subsequent job gains are so large relative to any prior periods (or current periods) that these charts look like straight lines on either side of COVID.
Yet this chart seems almost perfect. This is a symmetrical “beauty”, but it is just a “plug”. It is something that clearly relies heavily on seasonality and I find it almost impossible to believe that this is so “predictable” (which makes me wonder how many other “plugs” or adjustments might be meaningless after the COVID shock). Meaningless, but this data is still used to determine policy and drive markets.
Inflation
I couldn’t be bothered. Sure, I will dig into this more, but I really don’t think that despite some Fed jawboning, anything (other than a large/sustained change in inflation) will do much to the Fed’s decision (which means that it will do little for bond markets). I am prepared to be wrong on this and will delve into it this week (with help hopefully from friends at ChatGPT), but inflation is low on my radar screen. However, there is one exception – will companies be able to grow earnings in the current inflation environment where it seems to be more difficult to push through final product price increases while input costs remain elevated?
Bottom Line
Seems like we are back to an “inflection” point where the debate between soft landing and “something less fun” is back on the table. The lag effect is regaining credibility (it always should have).
There are cases to be made for a variety of economic outcomes as we head into September and that is exciting from my seat!
I do think that we are in a period where price action drives what narratives we see: continued downward pressure on stocks will bring out more and more negative reports. One more short squeeze and suddenly AI, soft landing, and praise for Powell is all that we will see.
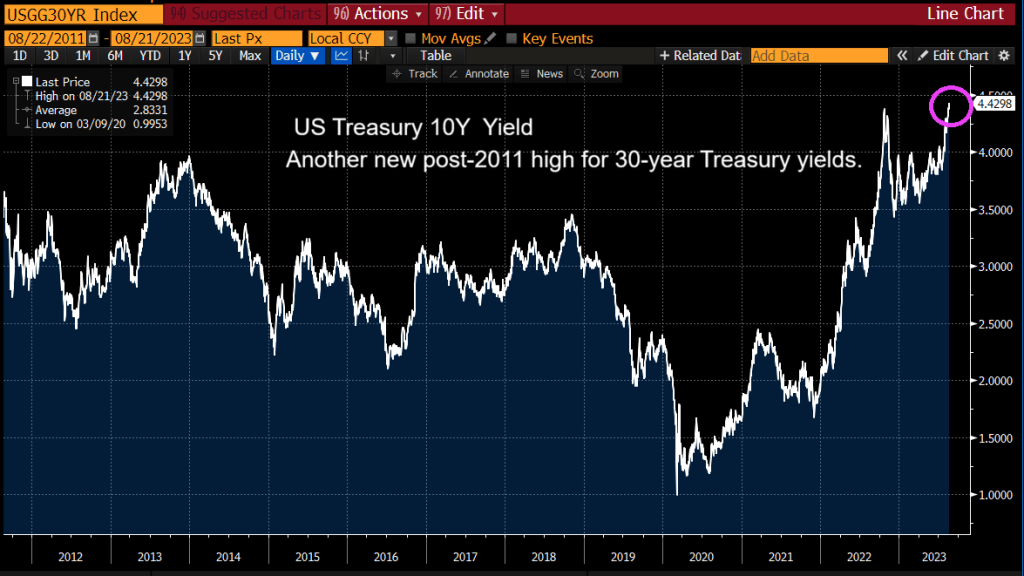
The US Treasury 10Y yield is now the highest post 2011 singaling further Fed rate increases.


You must be logged in to post a comment.