TBAC-O Road? Treasury Announces Big Cut In Borrowing (Despite Skyrocketing Deficits) But Shifting Towards More Expensive, Higher Duration Coupon Bonds

Constitution Avenue in Washington DC is actually becoming Tobacco Road. No, not the dysfunctional family of Georgia sharecroppers during the Great Depression, but the Treasury Borrowing Advisory Committee (TBAC).

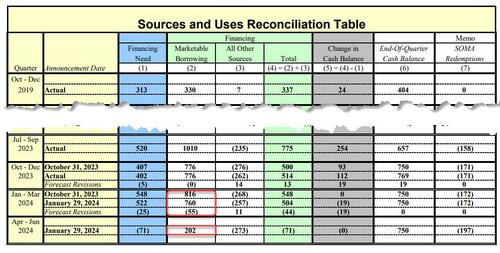
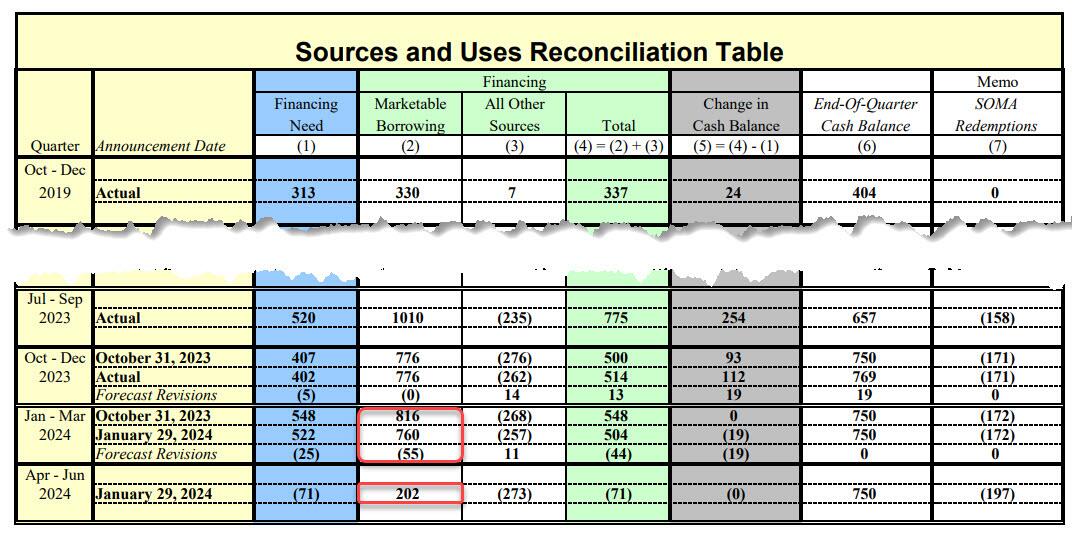
On Monday, after we got the first part of the Treasury’s Quarterly Refunding Announcement (QRA), in which the Treasury unexpectedly announced a big drop in its borrowing estimates for Q1 (from $816BN to $760BN) coupled with a shockingly low calendar Q2 borrowing estimate of just $202BN (as a reminder we got the second part of the QRA this morning which came in very much as expected)…

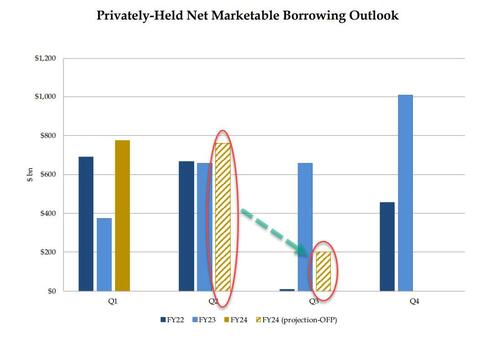
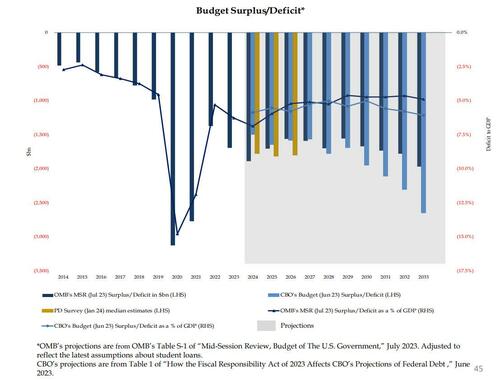
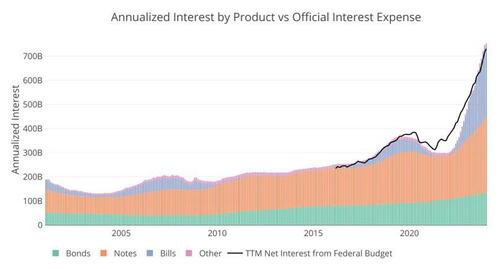
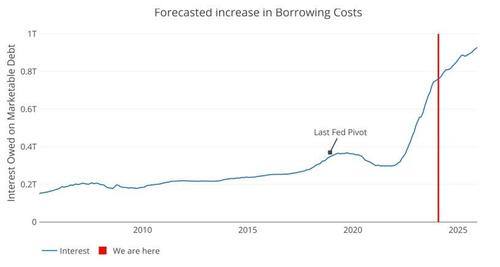
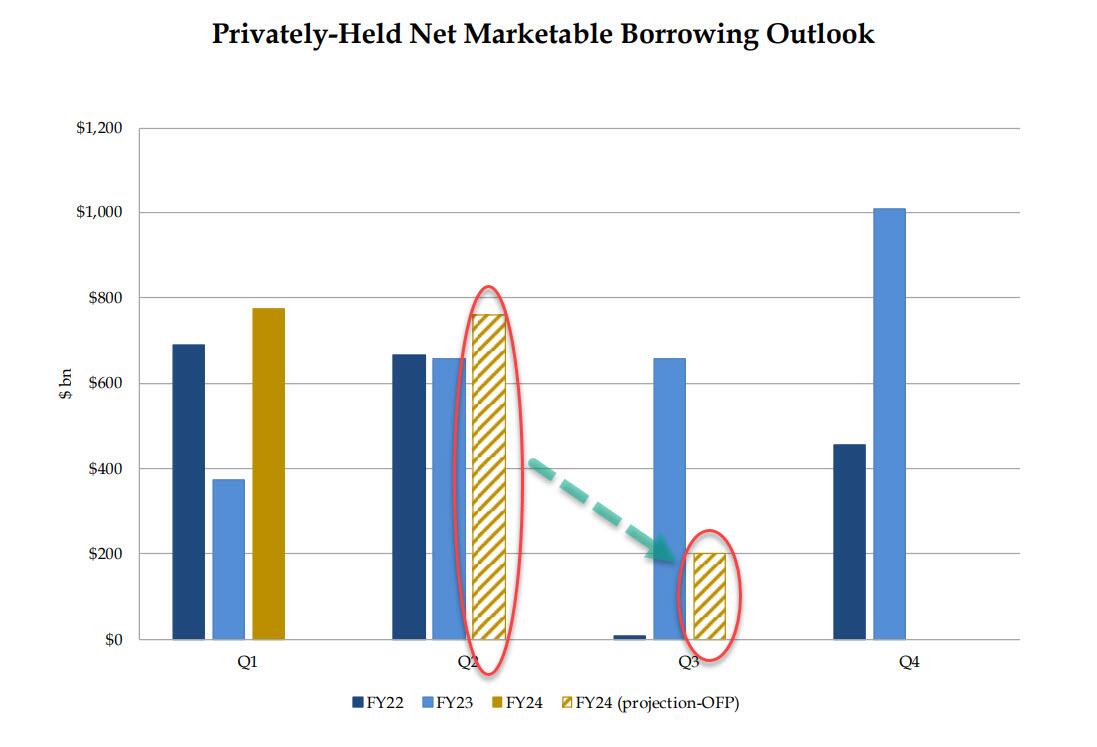
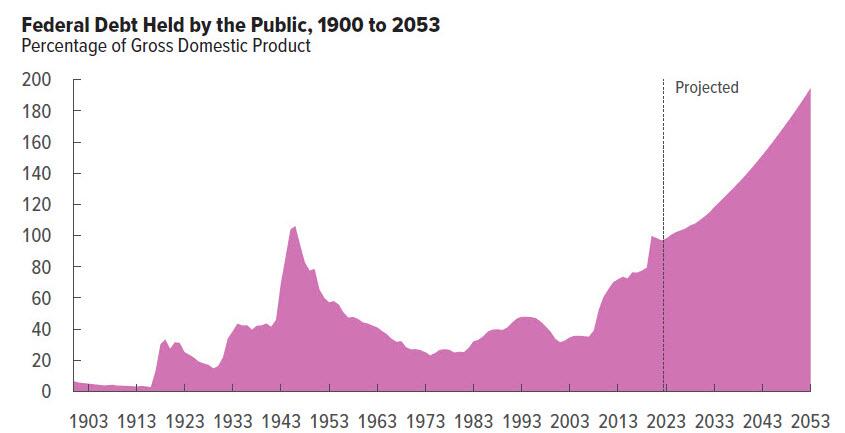
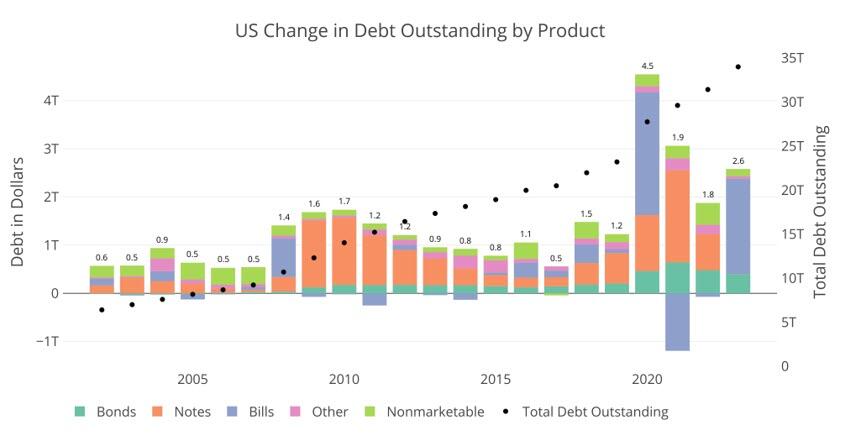
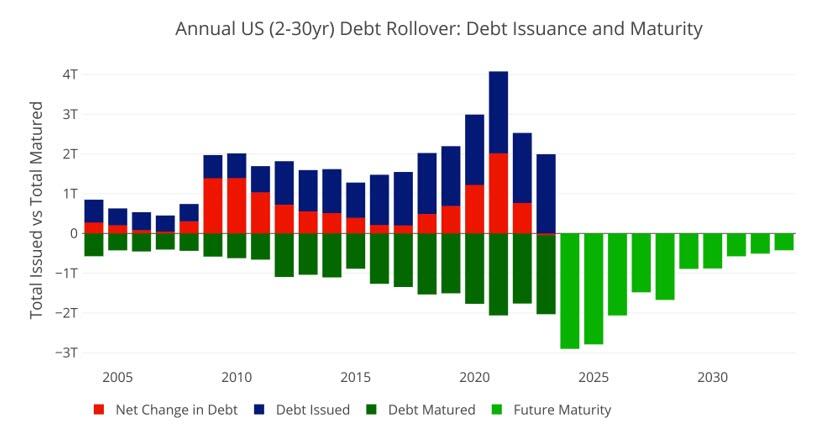
… yields tumbled as this was viewed as an aggressively dovish outlook on the future of i) the US fiscal deficit and ii) the debt needed to fund said deficit. Here is another way of visualizing the US historical and projected marketable debt funding needs:

Commenting on this surprise drop in expected borrowing, on Monday we said that the numbers also mean that the Reverse Repo facility will be fully drained by Q2, and we expect that on Wednesday we will learn that the bulk of the reduction in Q1 and Q2 estimates will be due to sharply lower Bill issuance for one simple reason: there is just no more Reverse Repo cash to buy it all.

Boy, were we right: earlier today, in the Treasury’s presentation to the Treasury Borrowing Advisory Committee (TBAC) as part of the Quarterly Refunding, Janet Yellen revealed what the composition of this sharp drop in Q2 funding needs would be. As we expected, it was all bills!

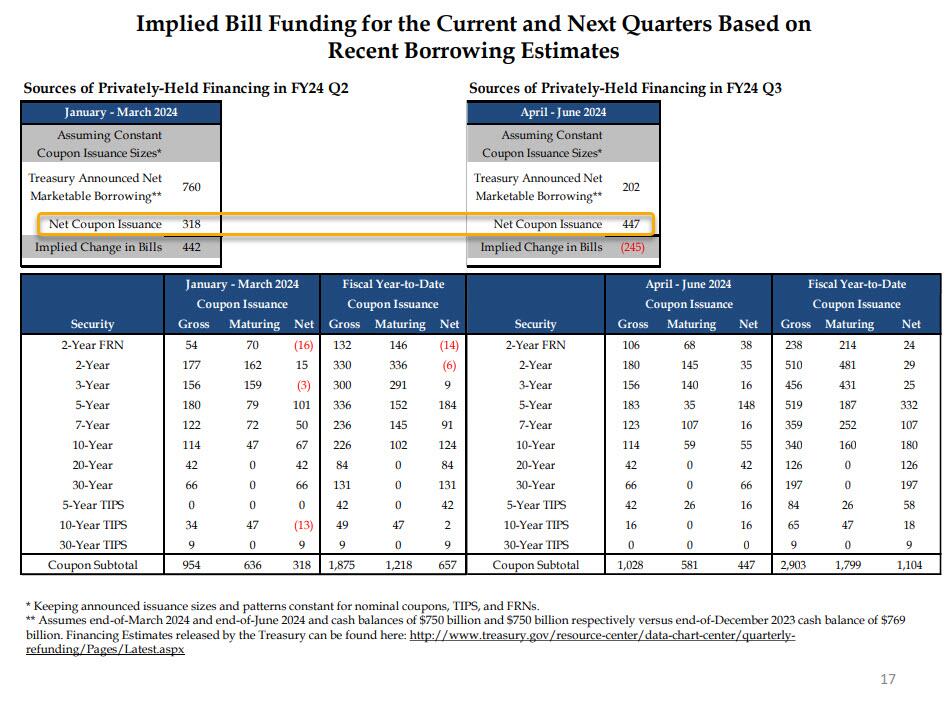
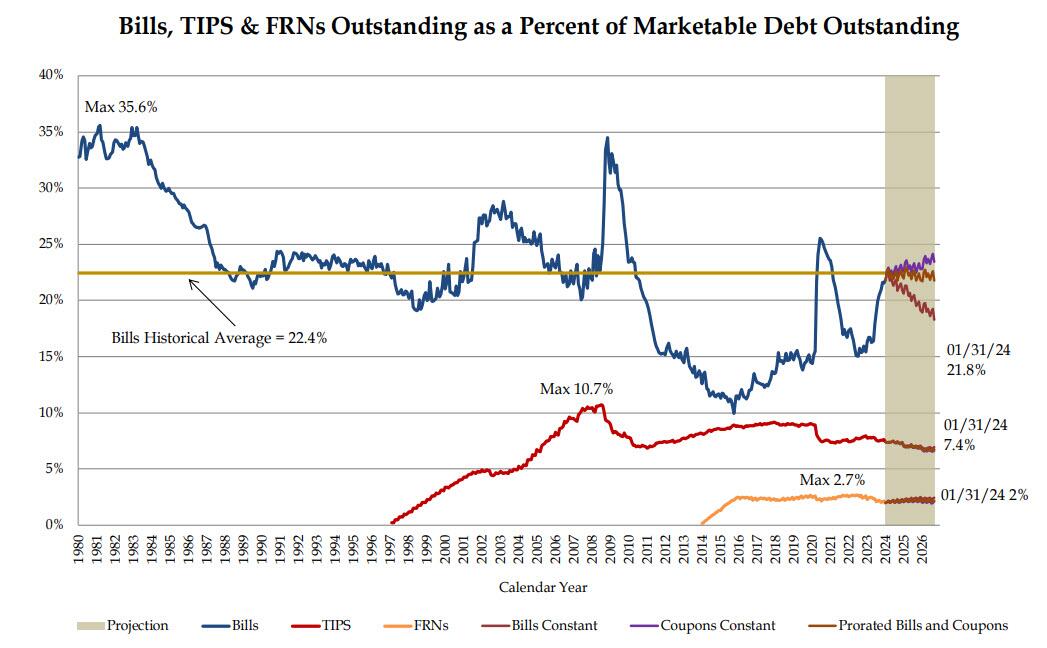
In fact, as the chart below – which we have dubbed the scariest chart in the Treasury’s presentation to TBAC today (link here) – shows, with Bills expected to fund some $442 Billion of the $760BN funding deficit in the Jan-March quarter (the balance of $318BN funded by coupons), in Q2 the Treasury now anticipates a $245BN DECLINE in net Bills outstanding (i.e., not only no incremental Bill funding but a quarter trillion maturity in Bills outstanding). In other words, while we expected a “sharply lower” Bill issuance in Q2, the Treasury is actually expecting a $245BN drawdown in Bills.

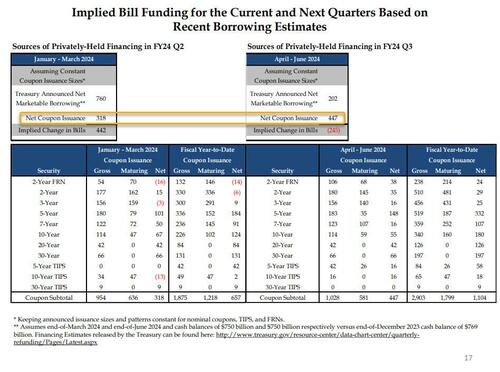
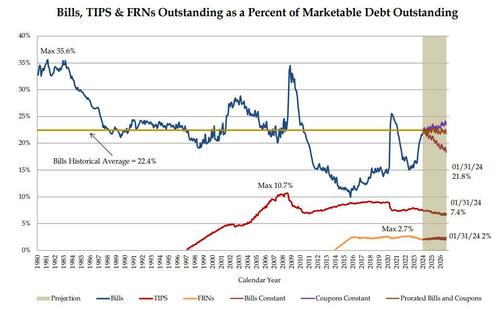
But wait, there’s more: because while the market was expecting some pro rata decline in coupon issuance to go with the slide in net Bills (we were not) in Q2 to justify the sharp drop in long-end yields, it was not meant to be. In fact, just the opposite, because as highlighted in the chart above, net Coupon issuance in Q2 is actually expected to increase by $130BN to $447BN from $318BN in Q1. This is a huge shift in higher duration supply, and is hardly what all those who were buying 10Y bonds on Monday were expecting, and yes, that too was to be expected: with Bills now well above the “comfortable” ceiling of 20% as a percentage of total debt outstanding, the Treasury had no choice but to roll it back, especially since the Reverse Repo is already mostly drained. And sure enough, in its presentation, the Treasury no longer anticipates a flood of Bill issuance in the future. 

That’s not all: while the Treasury said it does “not anticipate needing to make any further increases in nominal coupon or FRN auction sizes, beyond those being announced today, for at least the next several quarters”, the TBAC politely disagreed, stating that “it may be appropriate over time to consider incremental increases in coupon issuance depending on how the current uncertainty regarding borrowing needs evolves”  (translation: as the need to bribe the population with more fiscal stimmies ahead of November rises, so will borrowing needs).

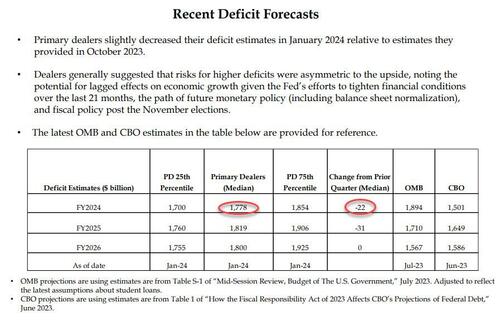
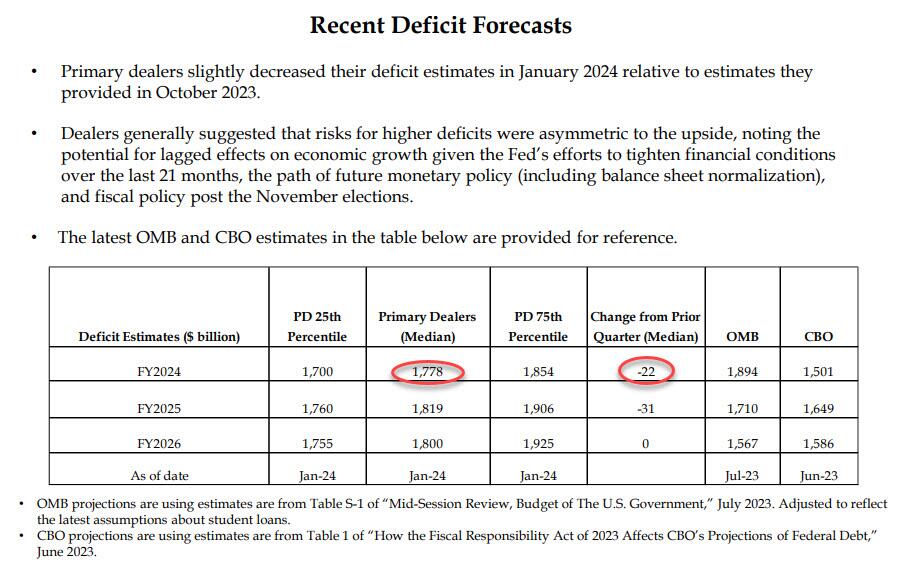
As for any naive expectations that any decline in issuance in structural instead of merely shifting away from Bills to Coupons, we have some more bad news: as the table below confirms, the Primary Dealer estimate of the US 2024 budget deficit dropped just $22BN in the past quarter, from $1.8 trillion to $1.778 trillion, a meaningless change (expect this number to rise sharply as the full brunt of fiscal stimulus in an election year become visible).

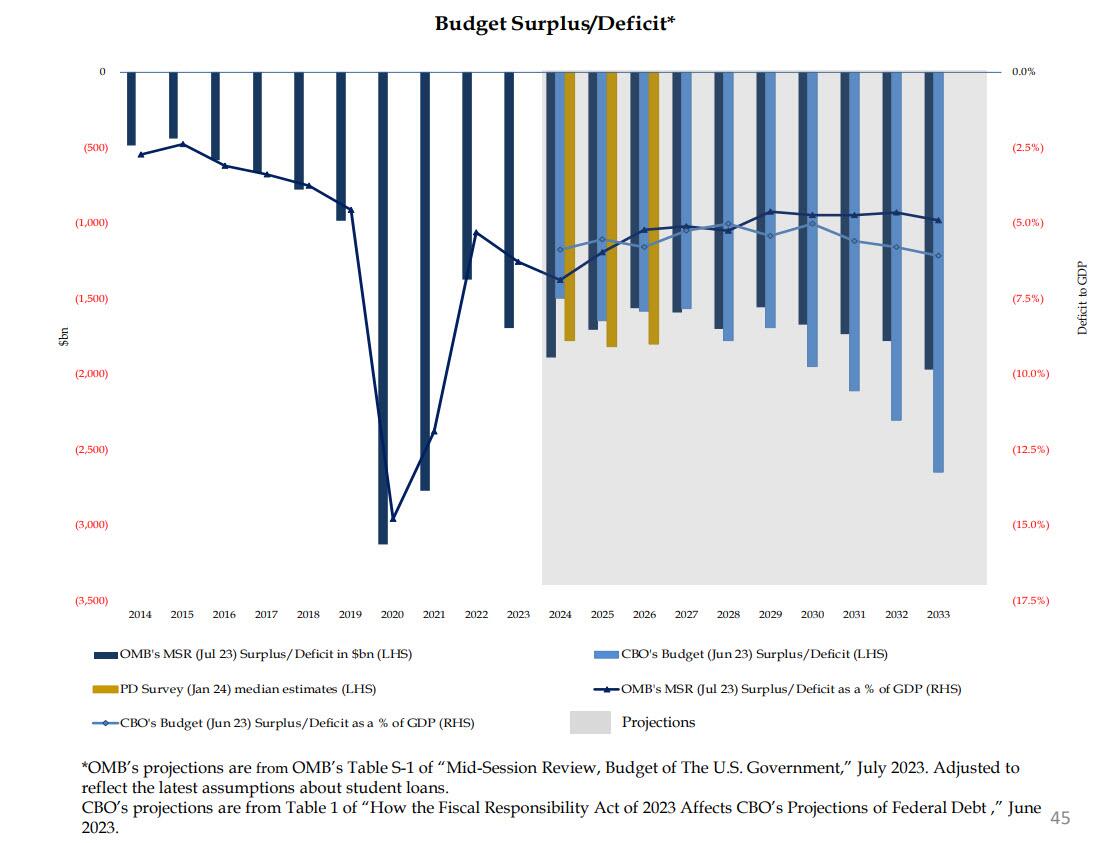
As for the bigger picture, well you can listen to either the Primary Dealers…

… or the CBO:

Both reach the same sad conclusion, the same one voiced by Nassim Taleb on Monday when he said that “we need something to come in from the outside, or maybe some kind of miracle…. This makes me kind of gloomy about the entire political system in the Western world.”

Sorry, Nassim, no miracles… just lots and lots of money printing coming.

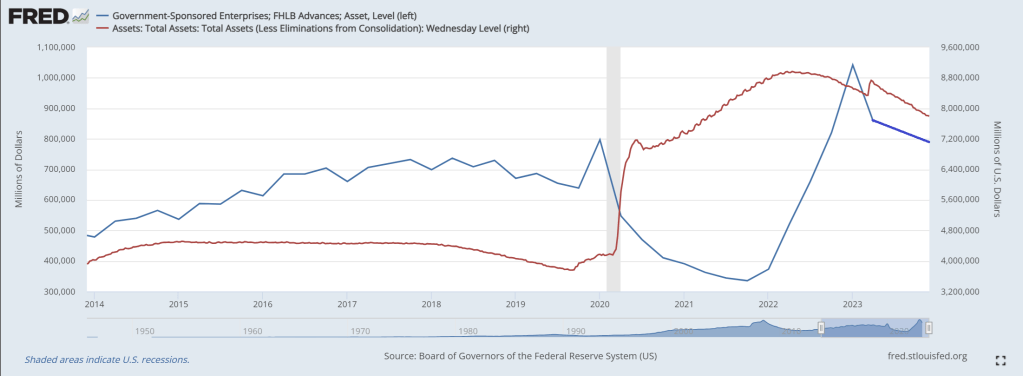
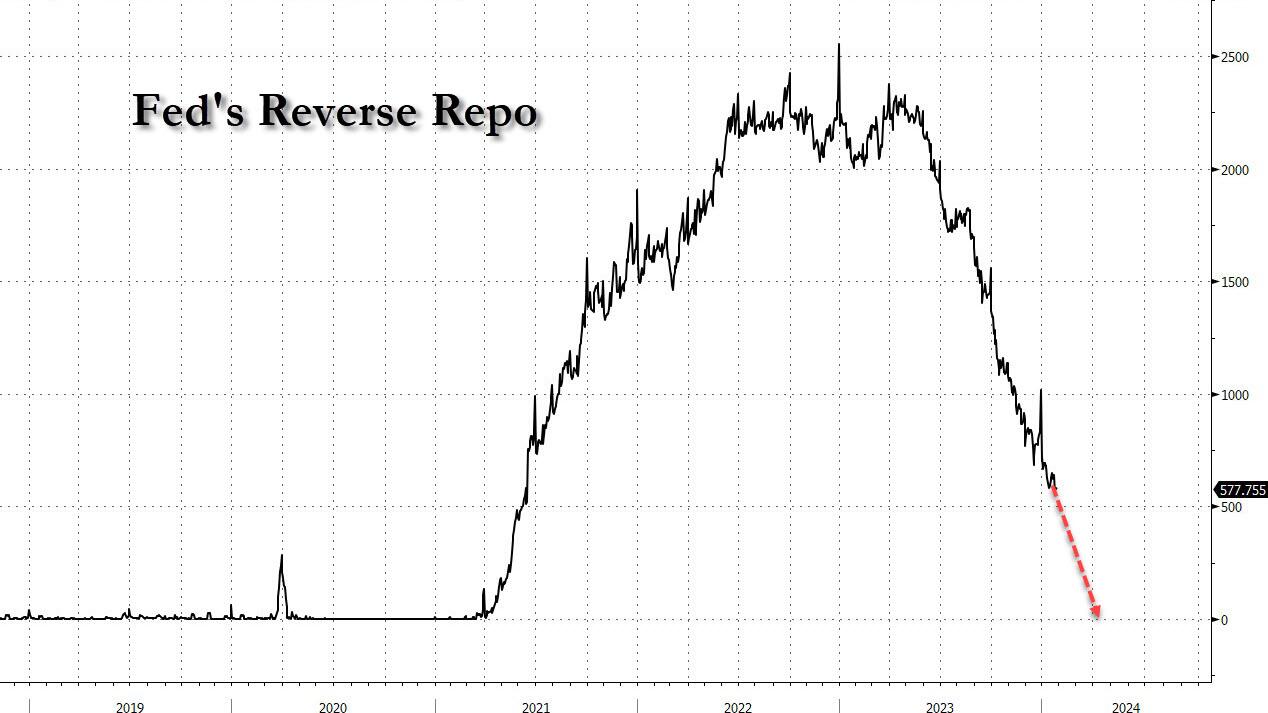
And speaking of money printing, the fact that Bill issuance is about to grind to a halt in Q2 means that, just as we expected, reverse repo balances will tumble in the remaining two months of Q1…

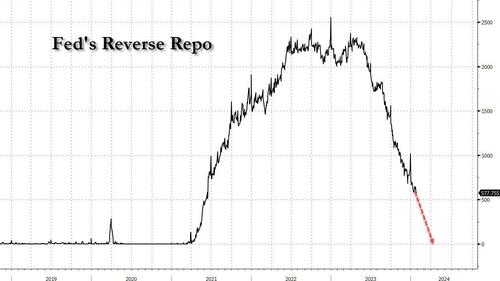
… bringing it effectively to zero (which means the Treasury’s stock market liquidity pump is now almost drained), at which point the Fed will have to take over and taper QT as the alternative would be draining some $100BN in reserves every month at a time when total Fed reserves are already at the level which Waller hinted may be the infamous LoLCR floor which is a hard constraint at “10-11% of GDP.” The alternative is simple: a stock market crash just months before the November election, hardly the stuff Biden’s handlers or the anti-Trump Deep State would approve of.

Dammit, Janet! Janet Yellen Bets $2 Trillion That Rates Will Not Be Higher-For-Longer (Funds US At Short-end Of Curve)

Dammit Janet! Stop borrowing money that we have to pay back!

Don’t forget! US Q4 GDP grew by $182.6 billion while Janet Yellen increased borrowing by $834 billion. (Public Debt By 4.5 Times GDP Growth).

In 2023, the Treasury added $2.6T to the national debt. While that number alone should be enough to scare anyone, the details reveal something even more concerning. $2T of it, or 77%, was financed entirely with short-term Treasury Bills maturing in less than a year. The chart below shows the debt issuance trend over the last 20 years. As shown, the Treasury typically relies on medium-term debt (2-10 Year Notes) to fund the budget deficit. 2023 was a massive change in standard procedure as shown by the giant light blue bar on the right of the chart.

Figure: 1 Year Over Year change in Debt

The only other times Bills were used as a primary funding source was in 2008 during the Great Financial Crisis and 2020 during Covid. Neither year came close to 77% of total new debt issuance. These were also emergency times, and specifically in 2021, almost half the short-term debt was retired in favor of Notes and Bonds to undo the 2020 Bill issuance.

The Treasury has spent nearly two decades trying to extend the maturity of the debt. This can be seen in the blue line below that shows the average debt maturity. When the short term debt is issued in such a way, it drives down the average maturity, which causes the Treasury to have to roll-over more debt in shorter time periods. So why has the Treasury all of a sudden gone entirely to short-term debt in non-emergency times? The answer lies in the orange line, so let’s dig in.

Figure: 2 Weighted Averages

First, it is important to understand the interest rates the Treasury is facing. The chart below shows the current yield curve as it stands today and 6 months ago. As you can see, short-term rates are a full 1%-1.5% higher than medium-term. What?!? Didn’t we just see that the Treasury has specifically targeted short-term debt?

Why are they paying more than they have to? Had the Treasury financed the $2T with Notes, they would have saved $30B in interest this year alone!

Figure: 3 Tracking Yield Curve Inversion

So, why have they done this? Well, there are two potential possibilities.

First, they may be nervous about the market’s ability to handle so much medium-term debt. The market typically digests short-term debt very easily, but it can become saturated with medium-term debt. The chart below shows the amount of medium-term debt that rolled over last year. This is not new issuance; this is debt maturing that needs to be rolled over.

As shown, nearly $2T rolled over last year. This means, had the Treasury issued Notes instead of Bills, the Market would have had to absorb a whopping $4T in new medium-term debt like they did in 2020. The difference this year is that back in 2020 the Fed bought nearly all of that debt, putting a floor under the market.

Compounding this problem further is that this year is set to be a record year in terms of debt rollover. Nearly $2.9T in Notes need to be rolled over.

Figure: 4 Treasury Rollover

Still, even with that massive amount of debt issuance, there must be more to the story. Why would Yellen specifically pay $30B more in interest just because she is concerned the about the volume of debt issuance. As Figure 1 above shows, this has never been a concern in the past except in emergency situations. Furthermore, why not issue at least some new debt as medium-term.

This lends to a second, and more probable conclusion. Long-term rates are set to fall in the very near term. The Treasury did not want to lock in for 2-7 years at 4% if it knows rates will fall. It will pay a premium ($30B this year), if it means it can lock in lower rates for longer and save the money on the back end.

So, why are long-term rates, going to fall? Because they have to… the chart below shows the current interest owed on the national debt annualized. It’s not a pretty picture, and you can see how the interest from Bills has absolutely ballooned.

Figure: 5 Net Interest Expense

The Fed has come out with their dot plot that shows a calm glide path down. Well, we can take the debt maturity and push it forward at the projected rate of the Fed. Even given the current proposed 6 rate cuts, and getting back to 3.5% by early 2025, the trajectory for interest expense is not looking good.

Given current projections by the Fed, the Treasury will owe over $900B on interest by 2025That is a debt death spiral. The Fed had to pivot back in 2018 when interest expense neared $400B. Next year, the cost will be more than double that!

Figure: 6 Projected Net Interest Expense

There is a potential third option. It’s an election year. Maybe Yellen is doing everything and anything to keep the financial system running smoothly. She has decided that the Treasury market must remain 100% stable and wants to take no chances. Thus, she issues tons of short-term debt, costing the tax payer an extra $30B this year and decides it’s a problem to be fixed at a later date.

While this would be wildly irresponsible and corrupt, the real argument against possibility 3 is the same as possibility 1, the market should be able to ingest at least some medium-term debt. This means the only logical conclusion is that she knows rates are coming down hard and fast. How does she know? Well, she used to be the head of the Fed.

There is no doubt, everyone in Washington can do the simple math above and recognize the Fed cannot take a glide path down. The only option is for rates to come down. Yellen just bet $2T on that outcome.

Here are Janet Yellen, Joe Biden and Jay Powell doing “The Time Warp” fantasizing about the glory days of Marxism in the Soviet Union under Lenin and Stalin.

Biden Brags About Mortgage Rates Dropping In 2024 (Inside Info On Disease X?? Or Admission That The Economy Actually Sucks)

As only Clueless Joe can do, Biden brags about something that he has nothing to do with: falling mortgage rates.

Mortgage rates (30-year conforming rate) are up 392 basis points or a whopping 142% under Biden. Mortgage rates are down from the 2023 peak of 7.83% to 6.69% as of yesterday. One reason that mortgage rates are stable is that M2 Money GROWTH has been negative since the end of 2022.

Of course, it is The Federal Reserve acting to slow down inflation caused by excessive Federal government spending that is leading to mortgage rates declining, not Biden’s open border policy or his green agenda.

But for the future, does Biden know something that we don’t know? Like is Biden buying into the hypothetical Disease X (20 times worse than Covid) that was discussed in Davos at the World Economic Forum. If a major pandemic is unleashed (again) in the election year, The Fed would have to cut rates (again) to offset the damage done by another round of goverment economic shutdowns. Not to mention the shutting down of schools again.

Or did Biden just tell us that he knows the US economy is slipping and The Fed will come riding to the rescue of Biden (or Newsom or Michelle Obama) like in an old John Ford western with John Wayne. That would also lead to declining mortgage rates in 2024.

But all is not well in the banking sector. Use of Fed funding tool jumps most since April to fresh record: Banks borrowed record sum of $161.5bn from Fed’s Bank Term Funding Program, w/demand at $14.3bn climbing the most in 9 months as they piled into a reliable arbitrage trade just weeks ahead of its scheduled closure.

The availability of mortgage credit remains VERY TIGHT.

Whether its Disease X (unleashed The Kraken!) or just a slowing economy, The Fed (the master manipulator) will likely cut rates in 2024. Making mortgage rates come down.

And what is a dancing sandwich??

What If Biden’s Open Border Fiasco Is The Final Act Of Left’s Infamous Cloward-Piven Strategy? (59% Of Non-Citizen-Households On Welfare As US Debt Hits $34 TRILLION And Unfunded Liabilites Hit $212.6 TRILLION)

Biden is lucky in that many portray him as a senile, dumb US Senator who happens to be President. Perhaps Biden is actually insidious allowing for open borders in the hopes of crashing the US economy by overloading the welfare system and driving national debt through the roof?

To the extent that this was Biden’s mission, destruction of the US economy, he has been wildly successful. According to the Center For Immigration Studies, 59% of non-citizen-headed households receive welfare.

Biden, like Clinton and Obama before him, has been a Cloward-Piven discipile. Who are Cloward and Piven you ask? Two sociologists at Columbia University. (Cloward pass away in 2001, while Piven is still living). Here are Cloward and Piven attending the Voter Registration (aka, Motor Voter Law) Act signing by President “Willie Slick” Clinton.

The Cloward-Piven strategy is to overload the welfare system to the point of chaos, take control and implement Marxism through government force. To that extent, Biden and his incoherent sidekick, Kamala Harris, have been wildly successful. Sociology and Political Science are two of the most worthless college degrees (with Management in the Business School being a close third). Taking advice from Sociologists or Political Science majors or faculty is insane.

Biden funneled nearly 1.4 million illegal aliens into the U.S. — in FY 2023 alone.

Biden should be familiar to Latin American, African and Chinese immigrants who are used to Marxist dictators who try to have their political opponents taken of the ballots and prosecucted.

Yes, the US welfare rolls are overflowing with illegal immigrants and unfunded liabilities are out of control. Perhaps Biden and Harris should be replaced with Cloward and Piven (even though Cloward is dead). But Newsom, Hillary Clinton and Michelle Obama share the idiocy of the Columbia sociology faculty members. Hillary even teaches a course at Columbia!

Speaking of immbeciles in government, AOC claims abortion is a religious sacrament. Yes, under Biden, the US is officially a third world country!

What about compassion for immigrants? Great! Let’s close the borders and return to LEGAL immigration to halt human trafficking, Fentanyl imports, and cartels controlling the border. But Cloward-Piven’s strategy is best accomplished with open borders and weak-willed politicians.

Son Of FLUBBER! Banks’ Liquidity Sources Threatened By Plans To Limit Home Loan Borrowing (18 Straight Weeks Of Negative Growth In Bank Credit, 5 Rate Cuts Priced In For 2024)

The Federal Home Loan Bank System (comprised of Federal Home Loan Banks or FLUBs) are a major source of American home loans and liquidity … at least until now.

US banks will need to find other ways to access liquidity if the Federal Housing Finance Agency follows through with its goal to limit depository institutions from borrowing from Federal Home Loan Banks.

According to a recently released report, the Federal Housing Finance Agency (FHFA) plans to propose rules that would curtail US banks’ borrowings from the Federal Home Loan Banks (FHLBs) to ensure they are not used as a “lender of last resort.” The announcement comes after the liquidity crunch in March spurred several banks to tap into the FHLB system, sending FHLB advances to a three-year high in the first quarter. During that quarter, when two large regional banks failed, FHLB advances totaled $804.39 billion, comprising 3.7% of banks’ total liabilities.

While totals have fallen since then, sitting at $602.62 billion, or 2.8% of total liabilities, in the third quarter, the FHFA is still seeking to impose limitations. Should the agency enact the new rules, banks’ liquidity options would be hindered. The FHFA wants Federal Reserve facilities to be used instead, but banks are reluctant to tap those because of the stigma attached to those sources, industry experts said.

“It is fair to argue that some banks have come to rely on FHLB funding as a crutch, and the ramp in lending to struggling banks during the mini-crisis in March is an area of continued debate,” Isaac Boltansky and Isabel Bandoroff of BTIG LLC wrote in a Nov. 11 note. “With that being said, there is still a clear stigma associated with tapping the Fed’s Discount Window and other facilities, which should be part of the conversation if the FHLB support will eventually be curtailed.”

SNL Image

Among the various rules the FHFA plans to propose is requiring that certain members have at least 10% of their assets in residential mortgage loans or equivalent mission assets, including assets that qualify as Community Financial Institution collateral, on an ongoing basis in order to stay eligible for FHLB financing.

The leading FLUB borrower? Columbus Ohio’s own JP Morgan Chase!

The problem is that bank credit growth has been contracting for several weeks now. 18th straight week of negative credit growth.

As FLUB advances decline with Fed balance sheet shrinkage.

Everything is beautful? Not really. 5 Fed rate hikes priced in for 2024.

Yes, its beginning to look a lot like rate cuts.

So we are seeing Son of FLUBBER. Except this Flubber is crashing and burning.

Foul Powell On The Prowl! Odds Of March Rate Cut Hits 80% As Gold Soars To All-time High (10Y Treasury Yield Drops Below 5%)

Foul Powell on the Prowl!

Despite Powell’s confusing messaging on inflation, the market is pricing in an 80% chance of a rate cut in March 2024.

The Fed’s dots plot shows the same thing: Fed target rate falling like a paralyzed falcon.

As gold soars to an all-time high.

The difference between California governor Gavin “Toothsome” Newsom and Leave it to Beaver’s Eddie Haskell is that Eddie Haskell was more sincere.

Tumbling Dice! US Yield Curve Inversion Steepens, Mortgage Rates UP 163% Since 2021, Retailers Offer Deep Black Friday Discounts As US Manufacturing PMI Contracts

The Federal Reserve reminds me of The Stones’ song “Tumbling Dice.” Why? The Fed can’t tell if inflation is cooling or re-accelerating. Hence, they are just rolling dice.

Let’s start with mortgage rates, a critical component of the housing and CRE markets. Mortgage rates remain up 163% since 2021, not great for housing affordability. Despite recent small declines in the mortgage rate. The 10Y-2Y Treasury curve is also going deeper into reversion … again.

How about US manufacturing? Amid a collapse in ‘hard’ economic data, ‘soft’ surveys from S&P Global was expected to see both Services and Manufacturing PMIs slide further in preliminary November data.

However, the data was more mixed with US Manufacturing falling more than expected to 49.4 – back into contraction – (vs 49.9 exp) from 50.0 in October. However, US Services unexpectedly rose from 50.6 to 50.8 (exp 50.3).

Source: Bloomberg

Commenting on the data, Siân Jones, Principal Economist at S&P Global Market Intelligence said:

“The US private sector remained in expansionary territory in November, as firms signalled another marginal rise in business activity. Moreover, demand conditions – largely driven by the service sector – improved as new orders returned to growth for the first time in four months.

The upturn was historically subdued, however, amid challenges securing orders as customers remained concerned about global economic uncertainty, muted demand and high interest rates.

Businesses cut employment for the first time in almost three-and-a-half years in response to concerns about the outlook. Job shedding has spread beyond the manufacturing sector, as services firms signalled a renewed drop in staff in November as cost savings were sought.

On a more positive note, input price inflation softened again, with cost burdens rising at the slowest rate in over three years. The impact of hikes in oil prices appear to be dissipating in the manufacturing sector, where the rate of cost inflation slowed notably.

Although ticking up slightly, selling price inflation remained subdued relative to the average over the last three years and was consistent with a rate of increase close to the Fed’s 2% target.”

The US data comes after yesterday’s Euro area composite flash PMI increased by 0.6pt to 47.1, above consensus expectations, driven by a meaningful acceleration in Germany and the periphery, partially offset by a marginal decline in France. In the UK, the composite flash PMI improved meaningfully and entered expansionary territory at 50.1, above consensus expectations, on the back of a pickup in both sectors, with the services sector index entering positive territory at 50.5.

Goldman sees three main takeaways from today’s data.

  • First, we see a potential turning point in Euro area activity, with forward-looking indicators all improving in November, potentially setting a positive stage for the remainder of the year and the beginning of 2024. While the improvement seems to be broad-based, the upside surprises in the manufacturing sector in Germany and the Euro area as a whole may point to early signs of the sector’s revival.
  • Second, inflationary pressures, after moderating for some time, show signs of renewed intensification in the Euro area, as reflected by the output and input price components ticking up in November.
  • Third, UK growth momentum was meaningfully better than last month, and is picking up across the board, with the headline and services indices coming in above 50. This, however, is now accompanied by an increase in cost pressures, with both the input and output price indices edging up in November.

Finally, back to the US, S&P Global found that US business uncertainty was also heightened among US firms, as expectations regarding the year-ahead outlook slipped to the weakest since July.

How about Black Friday? The day after Thanksgiving singalling a beginning to the important retail Christmas (holiday) shopping season. According to Reuters, it isn’t looking too promising.

A record 130.7 million people are expected to shop in stores and online in the U.S. on Black Friday this year, the National Retail Federation (NRF) estimates. The event is known for crowds lining up at big-box stores at dawn to scoop up discounted TVs and home appliances.

But at 6 a.m. on Friday at a Walmart in New Milford, Connecticut, the parking lot was only half full.

“It’s a lot quieter this year, a lot quieter,” said shopper Theresa Forsberg, who visits the same five stores with her family at dawn every Black Friday. She was at a nearby Kohl’s (KSS.N) store at 5 a.m.

Fifth Avenue, one of the world’s top shopping streets, is dead quiet on Black Friday — at least by New York’s boisterous standards.

The strip of high-end shops from brands like Louis Vuitton and Cartier has largely recovered since its pandemic lull, where vacancies had once reached nearly 30% in Midtown East. Some vestiges of that struggle remain, with a few empty storefronts covered up or filled with little art installations. Yet the street has managed to keep its title as the most expensive retail area on the planet by rent per square foot, according to Cushman & Wakefield.

Mortgage rates up 163% since 2021, manufacturing PMI in contraction and Black Friday shopping muted. Not good. The Fed is rolling the dice on what to do next.

Bloom Off The ESG Rose? WEF’s ESG Sustainability Push Is Waning (Issuance Of Sustainability Linked Loans Down 80% In US)

Huey Lewis and the News said it best about ESG goals: “The elites want a new drug.”

The World Economic Forum (WEF) is a leading pusher of the ESG drug, pushed by the elite class intending to control the world. Unfortunately, numerous American politicians and influencers have attended the Davos meetings and have openly praised the WEF and its leader Klaus Schwab.

ESG refers to the environmental, social and governance information about a firm. There is growing evidence that companies that take their environmental and social responsibilities seriously perform better financially. This has naturally made investors sit up and take notice.

ESG investing, or sustainable responsible investing (SRI), uses this information about a company to inform investment decisions that prioritize all stakeholders.

Here’s how the Forum’s partners are leading the switch to stakeholder capitalism.

There are 3 pillars to ESG and sustainable investment. This reminds me of the 10 pillars (or planks) of Marxism. So ESG is Marxism with a different name, but the end result is the same. Big government control.

But all is not well with WEF’s ESG drug distribution. In fact, ESG flows into socially consious funds were a big thing during Covid (2020) and the first year of Biden’s Reign of Error. But ESG flows slowed sharply in 2022 and seeing net outflows in 2023.

Issuance of sustainability linked loans is down 80% in the US.

US borrowers are retreating en masse from the world’s second-biggest ESG debt class.

The $1.5 trillion market for sustainability-linked loans, in which borrowing is tied to environmental, social or governance goals, has seen an overall slowdown in volumes this year as both interest rates and greenwashing fears rise. But nowhere has the decline been as precipitous as in the US, where the number of new sustainability-linked loans is down 80% from a year earlier.

But ESG is still relatively popular in Europe, Middle East and Africa (orange). But taste for ESG is waning around the globe. But the selection of Biden as President in the US marked a surge in ESG -tied loans in 2021 and 2022 (not to mention the insane levels of spending out of Biden and Congress, much tied to the sustainability, green energy fantasy.

Loans with terms tied to borrower’s ESG goals have fallen worldwide.

Several states (largely blue states like California, Minnesota, Illinois, and Colorado have pro-ESG laws) while several states have anti-ESG laws (largely red states like Montana, Idaho, North Dakota, Kansas, Utah, Indiana, Arkansas, Florida, and West Virginia).

And of course, global warning may not be as dire as John Kerry and Greta Thunberg say.

WEF’s Klaus Schwab about to get sniffed by his 80-year old puppet, Joe Biden. In fact, Biden is singing “I’m your puppet.”

Here is Hunter Biden welcoming the Green Energy fairy and all the trillions in misallocated spending it brings.

The Thrill Is Gone? US Industrial Production Plunges In October As Auto-Maker Strikes Hit (But Also Federal Stimulypto Has Worn Out)

The thrill has gone from all the BIG spending bills from Biden.

After its surprising bounce last month (on a seasonally-adjusted basis, because it crashed NSA), US Industrial Production was expected to decline 0.3% MoM in October. It was worse – down 0.6% MoM from a downwardly revised September print (from +0.3% to +0.1%). October’s decline is the worst since Dec 2022 and the YoY drop of 0.8% is the worst since the COVID lockdowns. AND Federal stimulypto is wearing off (M2 Money growth surge peaked in February 2021, but has slowed into negative growth starting in August 2022.

Notably, once again, the non-seasonally-adjusted industrial production tumbled more than then seasonally-adjusted data…

Source: Bloomberg

On the manufacturing specific sector, consensus was for a 0.4% drop MoM but it was considerably worse, dropping 0.7% MoM (and September’s print was revised down from +0.4% to +0.2% MoM). That is the biggest MoM drop since March and biggest YoY drop since the COVID lockdowns.

That is also the 8th straight month of YoY declines for Manufacturing production.

Source: Bloomberg

Output was weighed down by a 10% plunge in motor-vehicle production as the annualized rate of car assemblies dropped to 9.22 million units, the least since February 2022. Excluding parts production, autos and trucks production fell 16.5% MoM – the biggest drop since the COVID lockdowns…

Source: Bloomberg

Starting in September, the United Auto Workers union authorized targeted strikes against the Big Three Detroit automakers, disrupting production at the companies and at their suppliers. The UAW reached tentative agreements with management in late October, laying the groundwork for a rebound in factory output in November.

So theorteically, we should see bounce back next month. Unless demand – as WMT hinted at – has fallen off a cliff.

Biden’s Mortgage Market! Mortgage Demand (Applications) Increase By 2.5% From Previous Week As Mortgage Purchase Demand Down -20% From Last Year (Refi Demand Down -7% From Last Year While Mortgage Rate Is UP 169% Under Biden)

US inflation is lower than it was a year ago (cheers from The View CNN and MSNBC cheerleaders), but inflation remains stubborning above The Fed’s 2% target rate and will likely remain above 2% for the nexf few years. So mortgage demand is much like inflation … mortgage demand increased in the latest week but generally is very low compared to last year.

Mortgage applications increased 2.5 percent from one week earlier, according to data from the Mortgage Bankers Association’s (MBA) Weekly Mortgage Applications Survey for the week ending November 3, 2023.

The Market Composite Index, a measure of mortgage loan application volume, increased 2.5 percent on a seasonally adjusted basis from one week earlier. On an unadjusted basis, the Index increased 1 percent compared with the previous week. The Refinance Index increased 2 percent from the previous week and was 7 percent lower than the same week one year ago

The seasonally adjusted Purchase Index increased 3 percent from one week earlier. The unadjusted Purchase Index increased 1 percent compared with the previous week and was 20 percent lower than the same week one year ago.

The 30-year fixed mortgage rate dropped by 25 basis points to 7.61 percent, the largest single week decline since July 2022. But, mortgage rates are up 169% under Biden and Bidenomics.

Bideomics is over, under, sideways, down. Mostly down.