US Mortgage Applications Drop 9% From One Week Earlier, Purchase Apps Up 7% From Previous Week But Down 41% From Same Week Last Year

The January mortgage applications book is closed. And we are off to another year of rising applications until May. Then the downhill slide.

Mortgage applications decreased 9.0 percent from one week earlier, according to data from the Mortgage Bankers Association’s (MBA) Weekly Mortgage Applications Survey for the week ending January 27, 2023.

The Refinance Index decreased 7 percent from the previous week and was 80 percent lower than the same week one year ago. The seasonally adjusted Purchase Index decreased 10 percent from one week earlier. The unadjusted Purchase Index increased 7 percent compared with the previous week and was 41 percent lower than the same week one year ago.

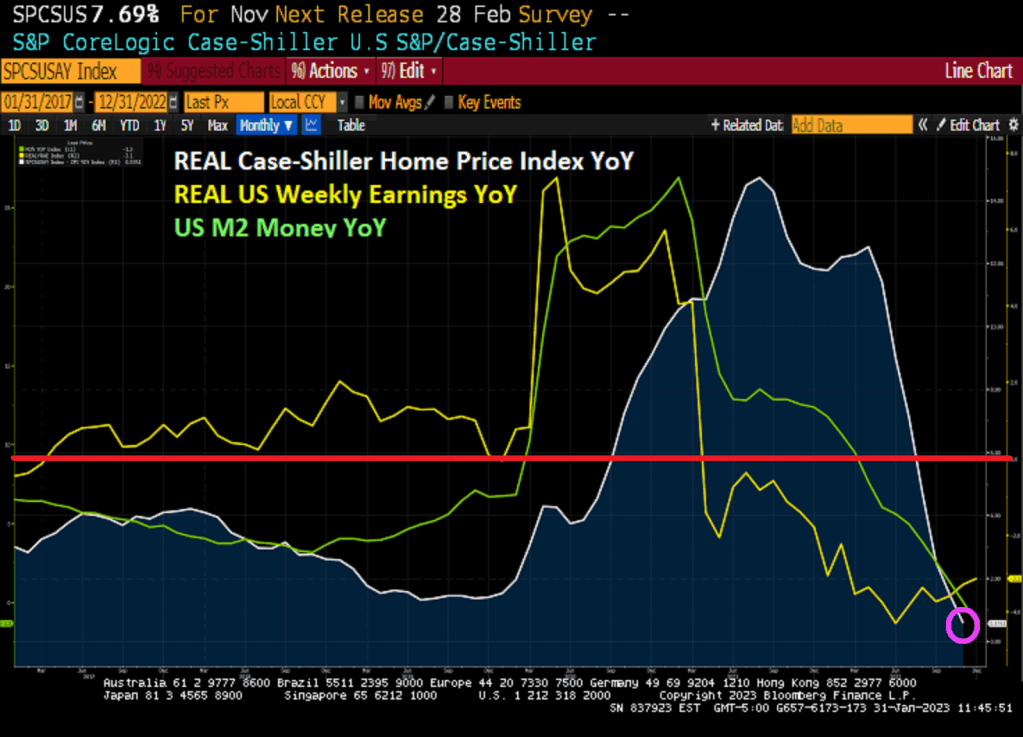
US mortgage rates have been steadily declining since November 2022.

Happenings Two Months Time Ago! US Case-Shiller National Home Price Growth Slows To 6.77% YoY In November As Fed Retreats (Down -0.54% Since October, 5th Straight Month Of MoM Price Declines)

The Case-Shiller index is out for November 2022. Too bad it is January 31, 2023. Call it “Happenings 2 Months Time Ago.”

On a year-over-year (YoY) basis, the Case-Shiller National home price index slowed to 6.77%. On a month-over-month (MoM) basis, the CS National index fell -0.54%. That is the 5th straight month of home price declines.

In REAL terms, the Case-Shiller National home price index is up only 0.58% YoY as REAL Weekly Earnings growth is negative at -3.1% YoY.

Only San Francisco fell on a YoY basis (down -1.6%). Five metro areas were above 10% and they are all in the South. Atlanta, Charlotte. Dallas, Miami and Tampa.

On MoM basis, every metro area in the Case-Shiller 20 index saw price declines from October to November.

Another sign of a crumbling market.

7 Months Of Night! US GDP Real Disposable Income Fell For 7 Straight Months As Fed Removes Punchbowl (Biden’s Economy Lost $4 TRILLION In Real Disposable Income Since March 2021, A -21% Loss)

Welcome to the wonderful world of Bidenomics, giving the US 40 year highs in inflation leading The Federal Reserve to remove its enormous monetary stimulus (known as “The Punch Bowl.”

I previously pointed out that US Real GDP was actually less than 1% year-over-year (YoY) in 2022, hardly a fantastic number given the trillions in Biden/Pelosi/Schumer spending (Omnibus, Infrastructure, etc) and Powell/Fed’s whopping monetary stimulus in 2020. But real disposable income, the amount households have left to spend after adjusting for inflation, had been falling for 7 straight months.

In fact, REAL disposable personal income peaked in March 2021, shortly after Biden was sworn-in as President in Janaury 2021 at $19,213.9 billion (or $19.214 TRILLION). As of December 2022, real personal disposable income had fallen to $15,213.0 or $15.213 TRILLION. That is a loss of $4 TRILLION since March 2021. Or a -21% Loss in Real Disposable Income.

Here is the campaign video for Joe Biden from 2020.

Biden’s campaign photo.

US Pending Home Sales Decline For 13th Straight Month, Down -34.3% YoY As Fed Tightens (UMich Housing Sentiment At 44, Well Below 100)

The US housing market continues to struggle as The Federal Reserve continues to fight inflation. Today’s pending home sales are another nail in housing casket.

Pending home sales declined -34.4% year-over-year (YoY) as M2 Money growth went negative (-1.3% YoY).

At least UMich buying conditions for housing increased … to 44, well below 100.

Good News, Bad News! US New Home Sales Rise 2.3% In December, But DOWN -23% YoY (Median Price UP 7.8% YoY While M2 Money Growth Goes Negative)

The December new home sales report is good news and bad news.

The good news? US new home sales rose by 2.3% in December from November to 616k units sold SAAR. That is the good news.

The bad news? Since December of 2021, new home sales fell -23% year-over-year (YoY).

The median price of new home sales rose 7.8% YoY, but the trend as The Fed withdraws monetary stimulus (orange line) is not good.

Perhaps there is a communications breakdown between the Biden Administration and The Federal Reserve.

MBA Purchase Applications Drop -.58% Since Last Week, Refi Apps Rise 3.15% WoW As Mortgage Rates Declined 3rd Straight Week (Purchase Apps Down -39% Since Same Week Last Year, Refi Apps Down 77%)

Falling mortgage rates are having a predictible effect on mortgage refinancing applications, but not so much for mortgage purchase applications.

Mortgage applications increased 7.0 percent from one week earlier, according to data from the Mortgage Bankers Association’s (MBA) Weekly Mortgage Applications Survey for the week ending January 20, 2023. This week’s results include an adjustment for the observance of Martin Luther King, Jr. Day.

The Refinance Index increased 3.15 percent from the previous week and was 77 percent lower than the same week one year ago. The unadjusted Purchase Index decreased 1 percent compared with the previous week and was 39 percent lower than the same week one year ago.

Generally speaking, declining mortgage rates are due to declining 10-year Treasury yields. And 10-year Treasury yields decline as the economy weakens. Of course, M2 Money growth YoY is now 0% as The Fed tightens.

On a humerous note, US Treasury Secretary Janet “The Evil Gnome” Yellen is visiting Africa and lecturing them on prudcnt sovereigh debt management. Seriously. China responded with “Fix the US debt problems before you lecture anyone else.”

Winter Is Coming! Richmond Fed Outlook Declines To -11 As Philly Fed Outlook Down To -8.9 And NY Empire State Outlook Down To -32.9 (US 10Y-3M Yield Curve Inverts To -126.5 Basis Points)

Three regional Fed reports I like to watch are New York’s Empire State Outlook, Philly Fed’s Outlook and Richmond Fed’s outlook. Today, The Richmond Fed released their manufacturing outlook and … it declined to -11.

So the big three are all down (Philly down to -8.9 while NY’s Empire State outlook is down to -32.9.

On the Treasury front, the US 10Y-3M yield curve inverted further (a signal of impending recession) just tanked to -126.462 basis points.

Winter is coming!

US Leading Indicator More Like Bleeding Indicator After 10 Straight Months Of Declines, Down -1% As M2 Money Growth Dies (Mortgage Rate Rises To 6.47%)

The Conference Board’s Leading Indicator should be called The Bleeding Indicator given that the leading index has declined to 10 straight months. This is happening as The Fed tightens monetary policy to combat inflation.

Leading indicators include economic variables that tend to move before changes in the overall economy. These indicators give a sense of the future state of an economy.

How about mortgage rates? Settling in a 6.47%.

The Great Biden/Pelosi/Schumer Powell (4 Horsemen) Inflation Tax In One Chart (Personal Savings DOWN -64.8%, Consumer Credit UP, Real Weekly Earnings Growth NEGATIVE For 21 Straight Weeks)

I must admit, Joe Biden has a horribly misleading nickname “Middle Class Joe.” Between Biden’s horrible energy policies and Pelosi’s/Schumer’s spending binges, the US middle class and low wage workers have suffered mightely with the inflation tax. Throw in Jerome Powell and The Federal Reserve’s manic money printing and the American middle class has a problem.

US inflation peaked at 9.1% year-over-year (YoY), but has declined to a still painful 7.1% YoY as The Fed removes it aggressive monetary stimulus. But to cope with persistent US inflation, consumers have had to dip into savings and use more credit cards. As a consequence, personal savings plunged -64.8% YoY while consumer credit rose 7.9% YoY.

The other tax on the middle class and low-wage workers is the 21 straight months of negative REAL weekly earnings growth.

On the housing front, REAL home prices are growing at 1.5% YoY while REAL weekly wage growth is still NEGATIVE at -3.13% YoY.

Make no mistake, inflation caused by The Fed and Federal governments spending is a tax on the middle class and low wage workers.

Biden, Pelosi, Schumer and Powell are the 4 Horseman of the Inflation Apocalypse.

Sign Of The Times? Citi Economic Surprise Index Falls To -17.70 As US CDS (Default Insurance) And Fed Reverse Repos Remain Elevated

Its a sign of the times!

First, US default risk as measured by credit default swaps remains elevated (primarily because Biden and Democrats refused to cut wasteful spending or reign in non-retirees on Social Security). And NY Fed’s Reverse Repos remain elevated.

And then we have Citi’s economic surprise index for the US at -17 as The Fed slows money growth to 0%.

I wish I knew a place where inflation and insane Federal government spending and policies doesn’t exist.