Well, the anticipated Establishment, and anti-middle class “Boader Security” bill has been released. It is all about military spending for Ukrainse (of course), grudging spending for Israel and peanuts for the border patrol to MONITOR, not stop the illegal immigrant caravans.
The bill is the typical establishment/Democrat pork barrell biil at 370 pages. And loads of exclusions and loopholes so the migrant invasion will never end.
Independent US Senator Kyrsten Sinema told reporters the legislation would secure the US southern border (OMG, that is hilarious!!), including by requiring the Department of Homeland Security to close the border if there are an average of more than 5,000 crossing attempts per day over seven days.
In addition to $20.23 billion for border security, the bill included $60.06 billion to support Ukraine in its war with Russia, $14.1 billion in security assistance for Israel, $2.44 billion to US Central Command and the conflict in the Red Sea, and $4.83 billion to support US partners in the Indo-Pacific facing aggression from China, according to figures from US Senator Patty Murray.
An additional $10 billion would provide humanitarian assistance for civilians in Gaza, the West Bank, and Ukraine.
The US would provide $4.83 billion to support key regional partners in the Indo-Pacific where tensions have risen between Taiwan and China, as well as $2.33 billion for Ukrainians displaced by Russia’s invasion and other refugees fleeing persecution.
Millions for the military to keep Zelensky and his family in mansions while American veterans are homeless. But we expect massive Ukraine funding and the important US border security begins on page 62.
Example: $404,000,000 shall be for Immigration Judge Teams, in16 cluding appropriate attorneys, law clerks, paralegals, court 17 administrators, and other support staff, as well as necessary court and adjudicatory costs, and $36,000,000 shall be for representation for certain incompetent adults pursuant to section 240(e) of the Immigration and Na21 tionality Act (8 U.S.C. 1229a(e)).
What? Homeless vets live on the streets, but Schumer/McConnell want to QUICKLY process illegal immigrants.
Nobody spends other people’s money like Biden and Congress!
$47,500,000 for the procurement and deployment of mobile surveillance capabilities, including mobile video surveillance systems and for obsolete mobile surveillance equipment replacement, counter-UAS, and small unmanned aerial systems;
– $25,000,000 for subterranean detection capabilities;
– $7,500,000 for seamless integrated communications to extend connectivity for Border Patrol agents; and
– $10,000,000 for the acquisition of data from long duration unmanned surface vehicles in
support of maritime border security.
Other than helping the border patrol with surveillance, there are NO FUNDS FOR A WALL and just a lot of gibberish on reporting crossings, but NOTHING TO SLOW THE MIGRANT CROSSINGS.
In other words, it is a BIG DEFENSE SPENDING BILL … for Ukraine and Israel and peanuts for the US border. Child slavery and Fentanyl will continue unabated as will murders by illegal immigrants. Why? Illegals rarely live near Biden, Clintons, Obamas, McConnell, Thune and other frauds in the US House of Lords (aka, Senate).
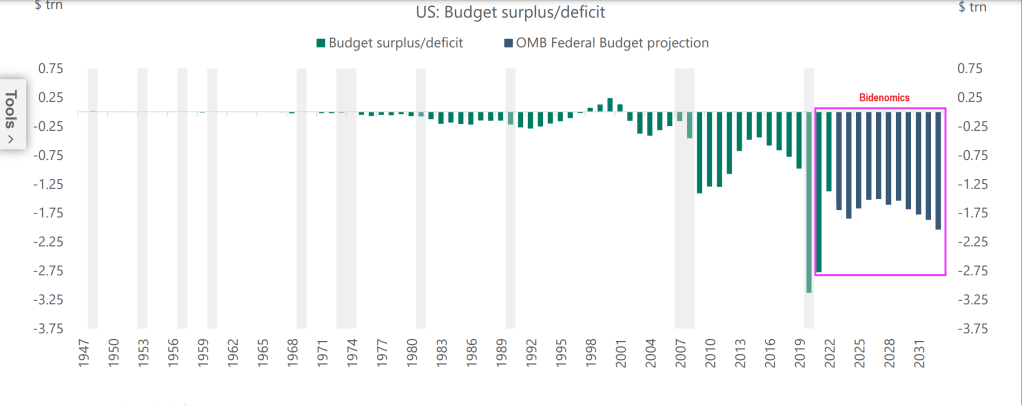
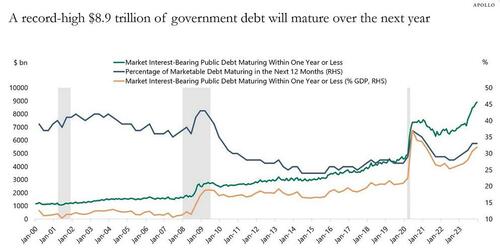
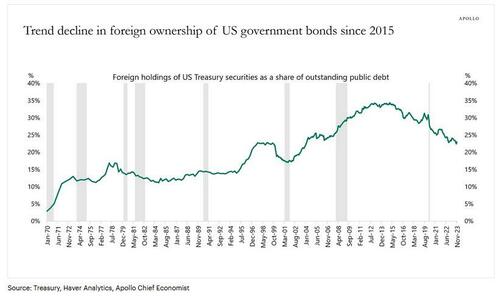
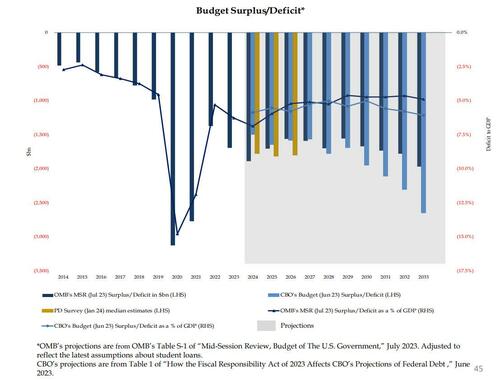
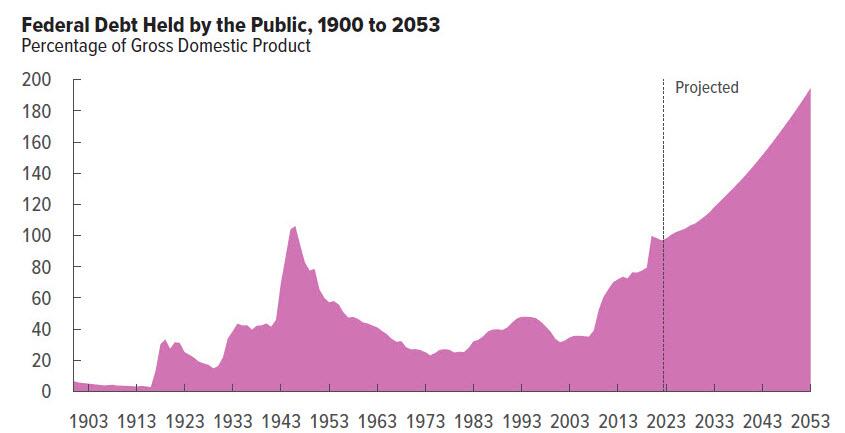
And you wonder why the US is careening off the debt cliff?


Fortunately, the House says that the bill is DOA.


You must be logged in to post a comment.