Like the spaghetti western “The Good, The Bad And The Ugly,” Bidenomics has had similar effects on financing. Some good, some bad and a lot of uglies.
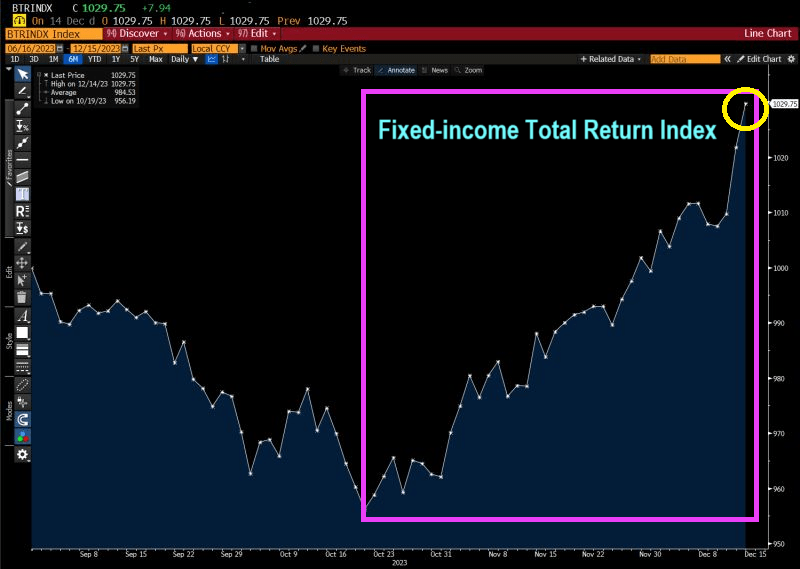
The good! For investors like pension funds the own US Treasuries, inflation has led The Federal Reserve to raise interest rates. This is good for investors holding short-term debt. The Bianco Fixed Income Total Return Index is soaring!!
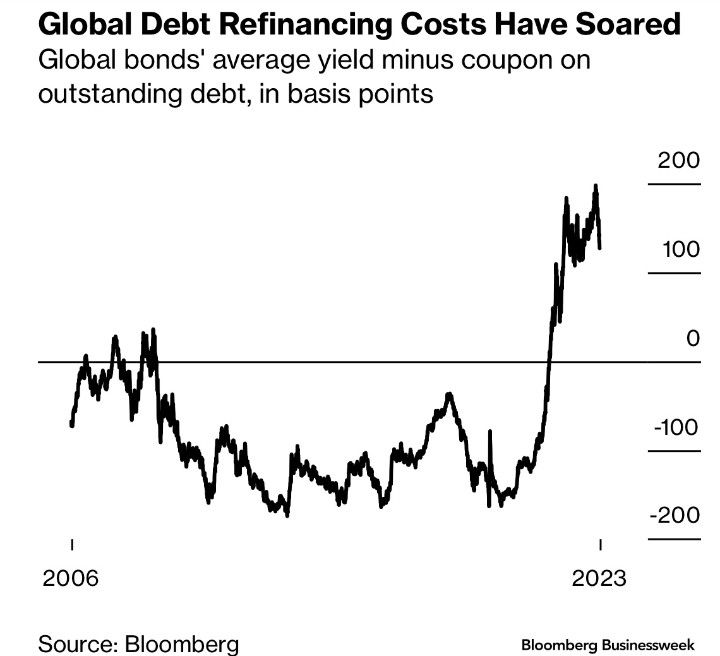
The Bad: Well, the flip-side of the same coin is that debt refinancing costs have soared.
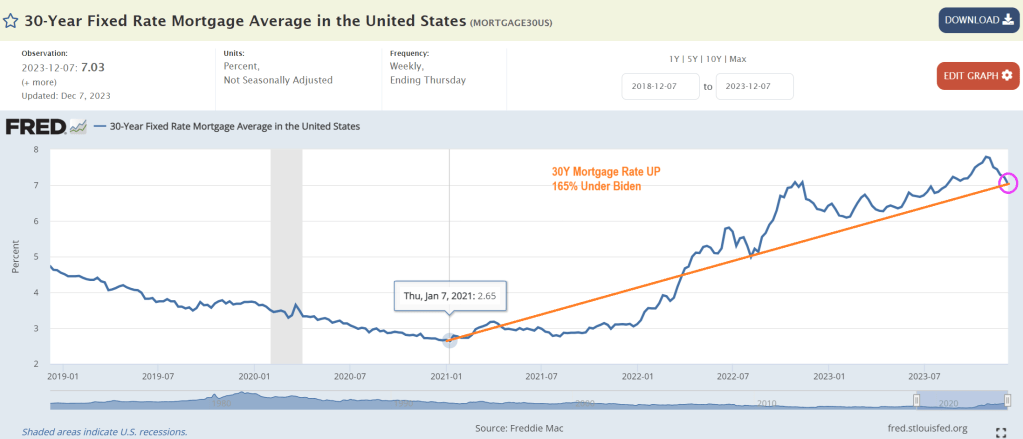
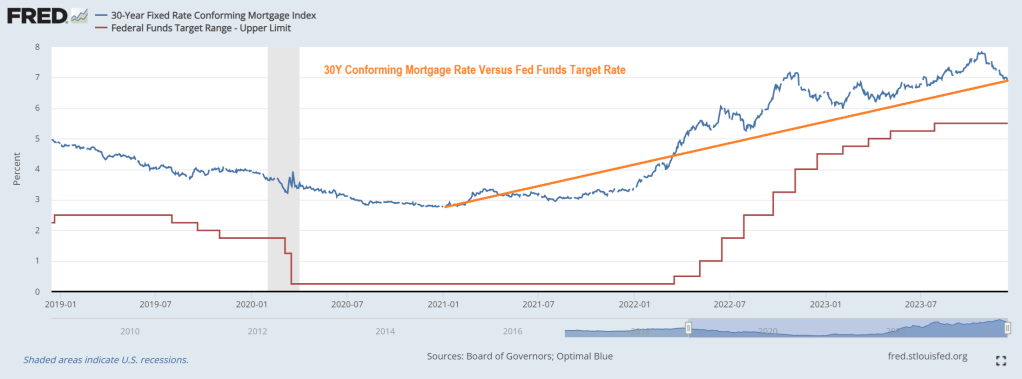
The Ugly. There are many contenders for losers under Bidenomics and current Fed (garbled) policies. But I choose … mortgage demand collapse with rising home prices and rising mortgage rates. Mortgage rates are up 165% under Biden.
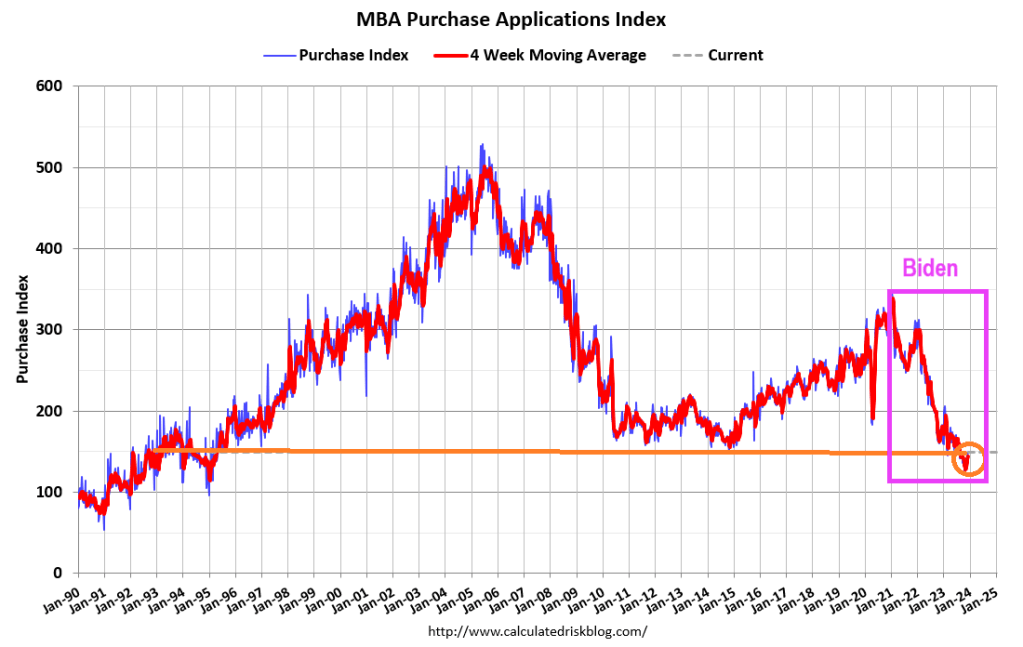
And mortgage demand (applications) have been crushed.
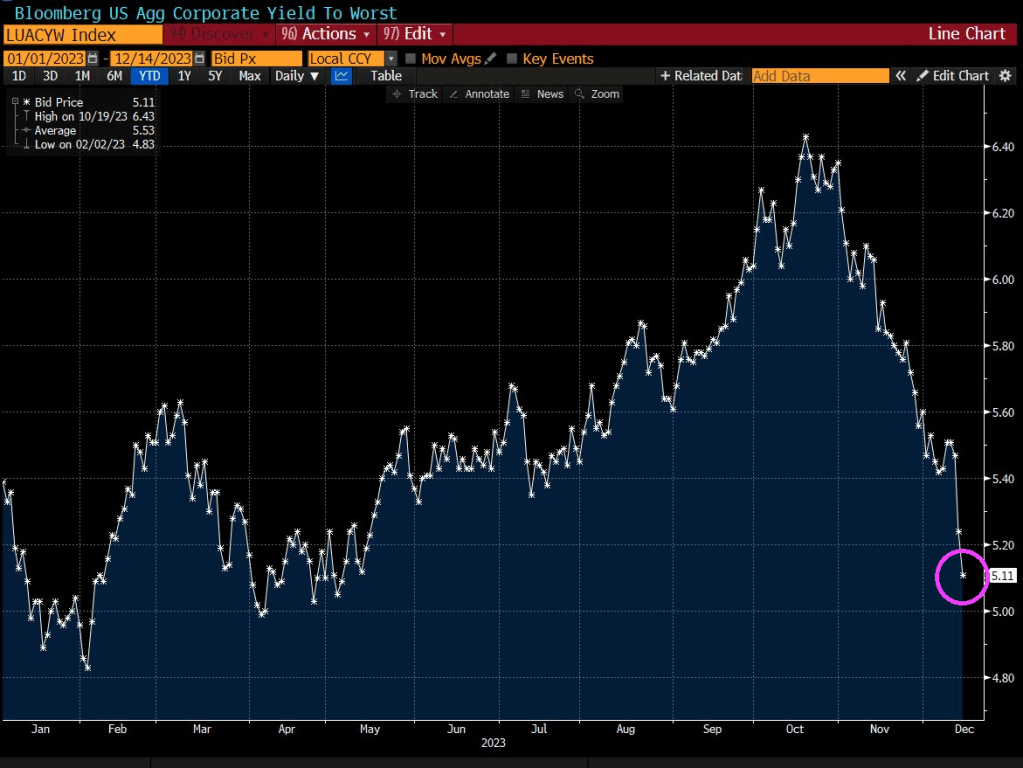
Also on the ugly side, global aggregate corporate yields have collapsed.
So, there have been winners with Bidenomics (the top 1%), and lots of losers.
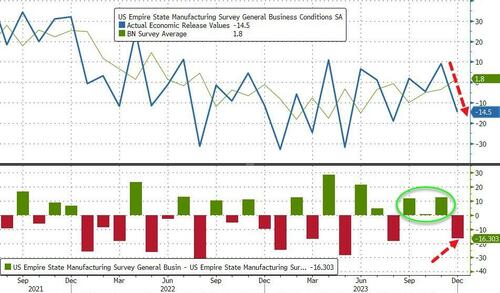
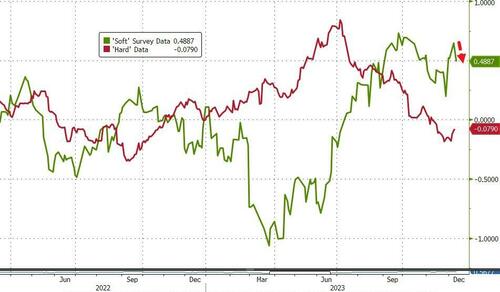
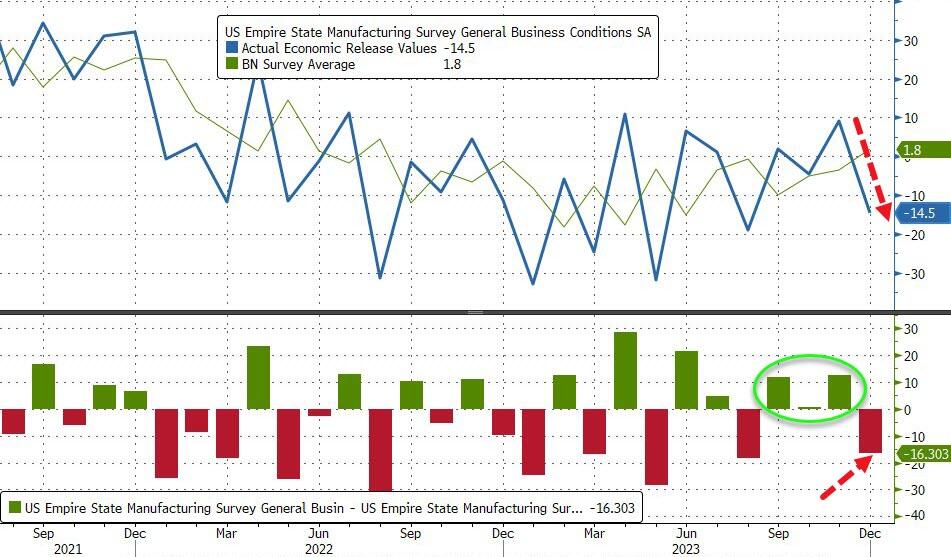
The drop takes the measure from ‘expansion’ at 7-month-highs to ‘contraction’ at 4-month-lows…
Source: Bloomberg
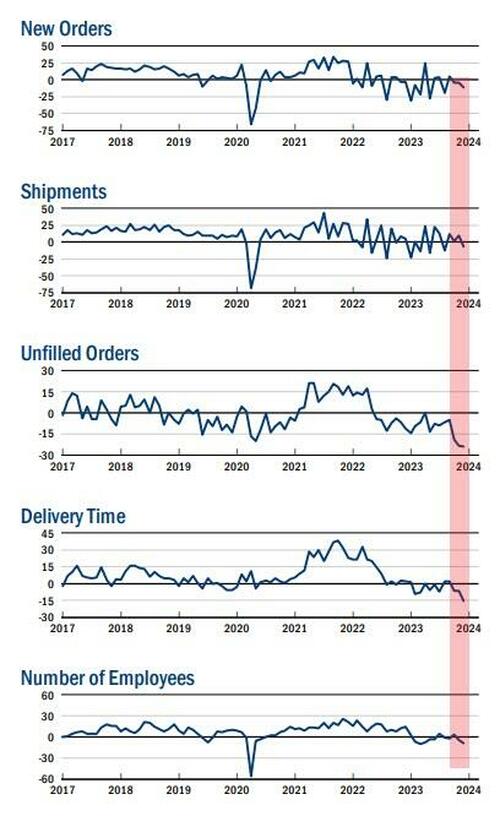
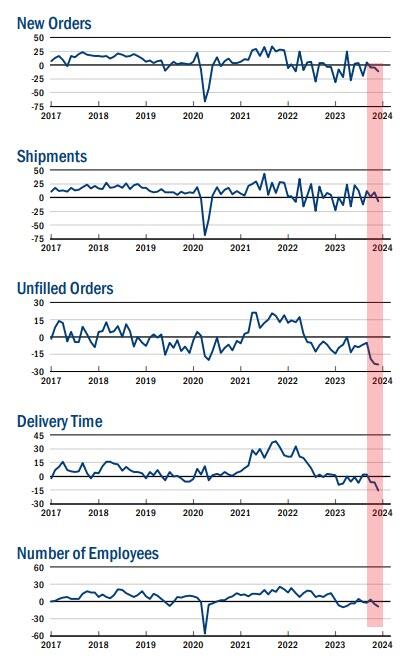
The new orders fell six points to -11.3, pointing to a decline in orders for a third consecutive month, and the shipments index fell sixteen points to -6.4, indicating that shipments fell.
The unfilled orders index held steady at -24.0, a sign that unfilled orders continued to fall significantly.
After rising into positive territory last month, the inventories index retreated fourteen points to -5.2, suggesting that inventories moved lower.
The delivery times index dropped ten points to -15.6, its lowest reading in several years, a sign that delivery times shortened.
The index for number of employees fell four points to -8.4, its lowest level in several months, pointing to a modest decline in employment levels.
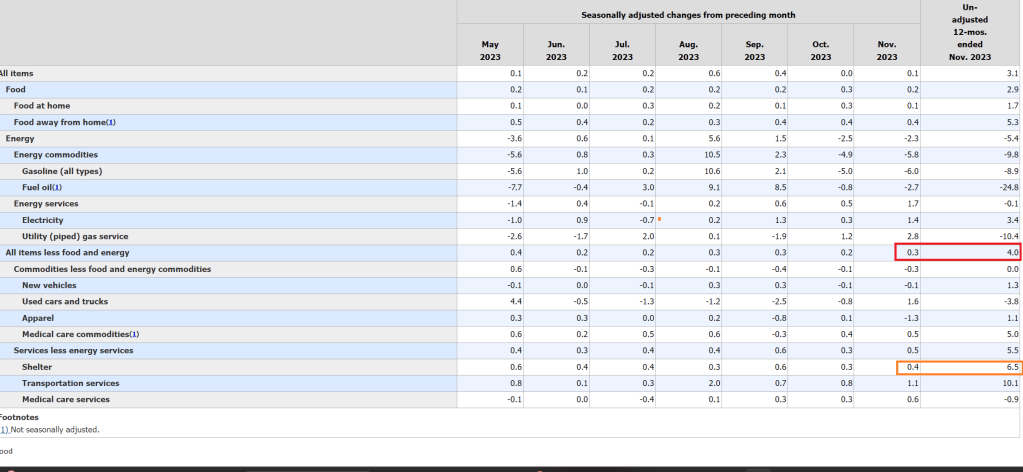
On the bright side, the prices paid index moved down six points to 16.7, suggesting an ongoing moderation in input price increases, while the prices received index held steady at 11.5, a sign that selling price increases remained modest.
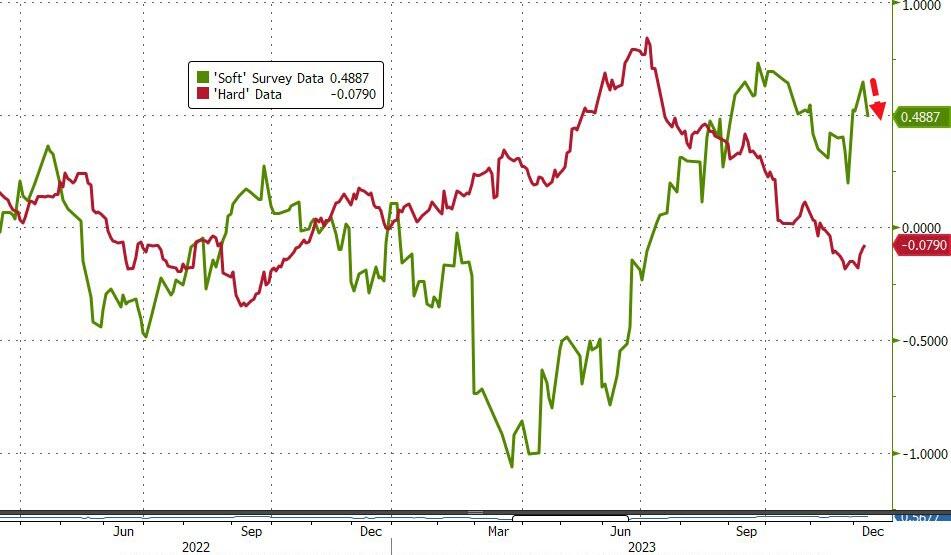
Is this the start of ‘soft’ data’s reversion to ‘hard’ reality?
The Fed – with its six rate-cuts – better hope so.
Traders and investors must spend precious time deciphering them. For those who wouldn’t mind a break from this parlor game, there are some markets that don’t march to the beat of the global policy cycle, and offer diversification benefits for portfolios.
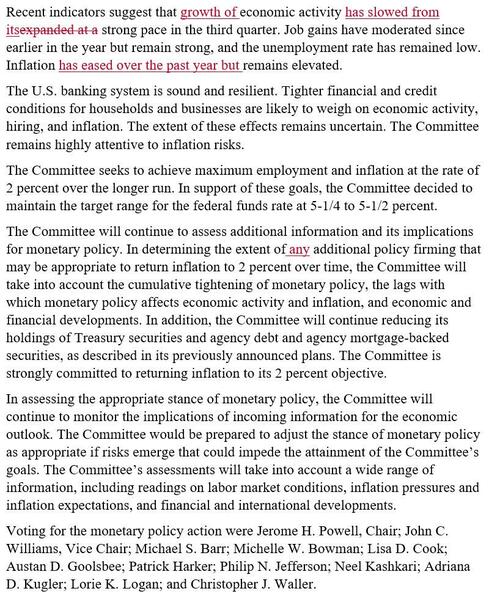
The game was in full flow at Wednesday’s Federal Reserve meeting, as the central bank patiently unpicked the higher-for-longer stitching it had spent many months carefully inculcating in the market.
Anyone who had listened to it on financial conditions, keeping rates restrictive for an extended period, or who thought Powell meant it when he implied he was a Paul Volcker and not an Arthur Burns, is now left trying to figure out if the Fed’s reaction function has indeed changed.
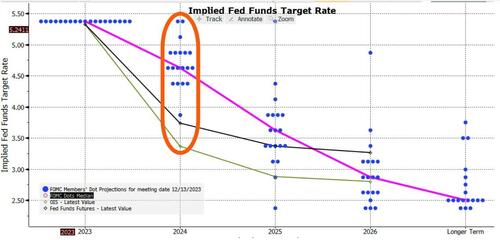
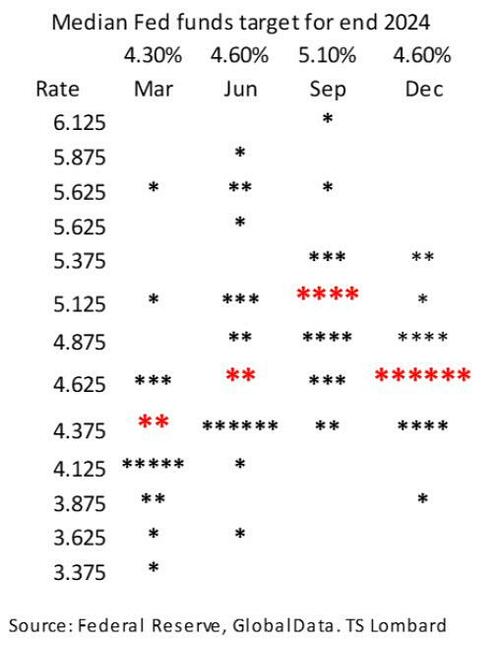
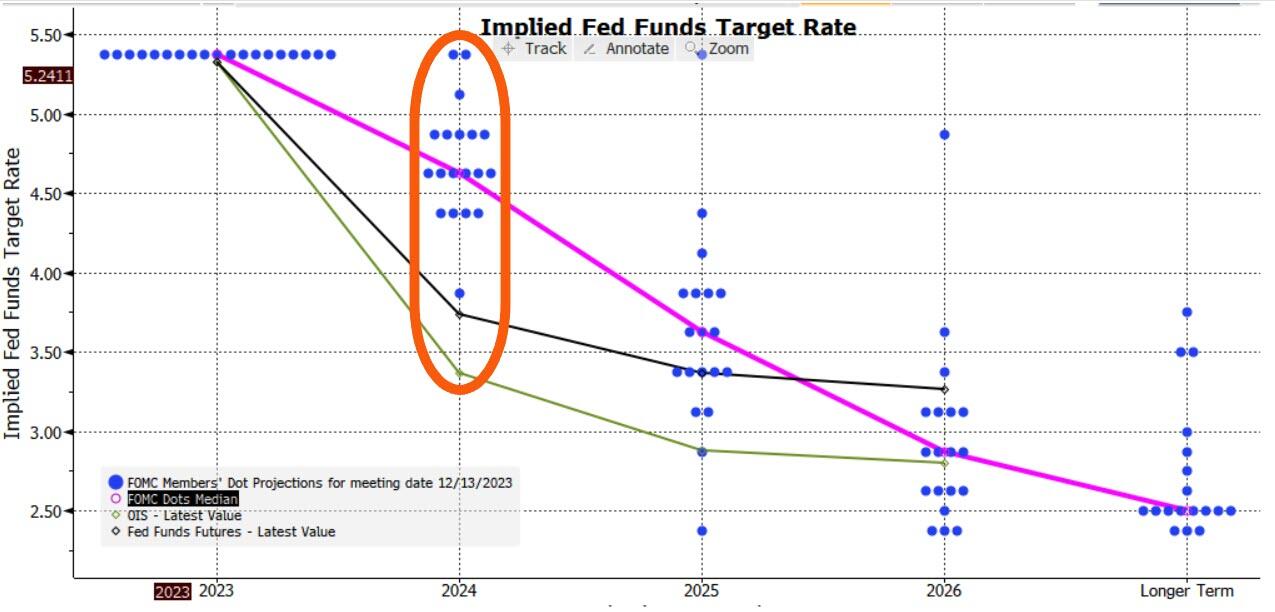
Adding confusion to the game are the dots. They reinforced the dovish message, with the median dot implying three cuts next year versus two back in September.
But with one dot implying six cuts, two implying none and the rest all spread in between, this isn’t exactly sure-footed clarity.
It’ll be repeated again today with the ECB, BOE, the SNB and the Norges Bank all meeting to set rates (the SNB held rates steady and the Norges unexpectedly hiked). For those who can trade only G7 markets, there is not much choice but to play the game.
However, for those looking for markets less reliant on the Delphic utterances of central bankers, there are other options.
The problem is that most bond markets tend to be quite alike over the medium-to-longer term.
Interest rate cycles are typically quite synchronized (with the US the most influential), and capital can flow freely around most of the world.
To show the broad uniformity of bond markets we use a statistical tool called principal component analysis.
PCA is a way of making sense of large data sets. For instance, a retailer may have reams of data on how users use its website: how long they spend on it, which pages they visit, where they hover their mouse, etc. PCA will tell you which input – or combination of inputs – has the greatest explanatory power in determining the total time users spend on the website (something they would want to maximize).
Using PCA on yields from 40 countries, we can show that over half of global bond market moves are described by just one factor.
This not a trivial result. It means we could replace our data on 40 bond markets by this one component and it would capture more than half of the variance of the individual yields.
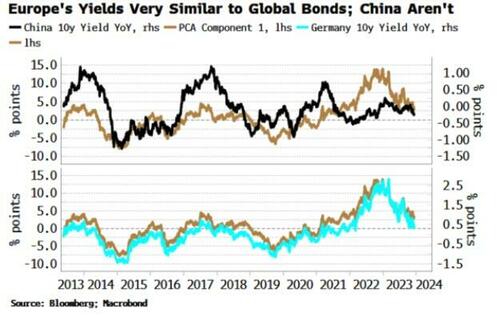
A bond market that was similar to this component would therefore be a good proxy for the global bond market. However, as the mathematician Carl Jacobi advised, we should always invert. A more interesting question is: which bond markets look least like this factor?
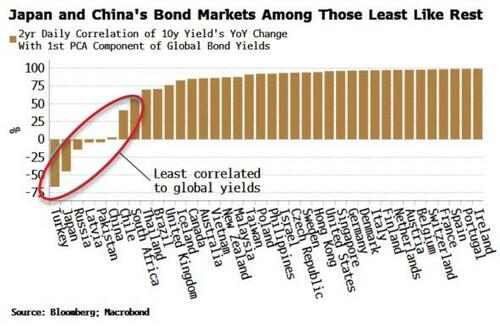
The chart below shows how each of the 40 bond markets are correlated to the first PCA factor. Most have a high correlation – more than 75% – but what stands out is the handful of markets with a low or negative correlation.
Japan and Turkey are among those with a negative correlation, while China’s correlation is close to zero.
This is intuitive.
Japan has been running a deliberately counter-cyclical monetary policy, while Turkey until recently was running a through-the-looking-glass one, cutting rates in the face of rampant inflation. And China’s economy is in deflation, at odds with every other major DM and EM country.
The above analysis provides analytical backing for the intuition that Japan et al have provided diversification for global bond portfolios in recent years, while most other markets, e.g. Europe, the US, Australia, New Zealand, etc are low-resolution facsimiles of each other and therefore have delivered few diversification benefits.
Of course, there will be other things to consider before adding a country’s bond index to a portfolio, such as how overbought or oversold it is, how liquid it is, the expected stance of the central bank, and so on.
But if the correlations persist, such a market should produce a more resilient and lower-volatility bond portfolio.
We can extend this analysis to look at stocks.
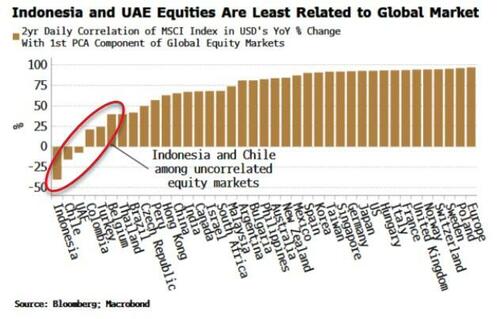
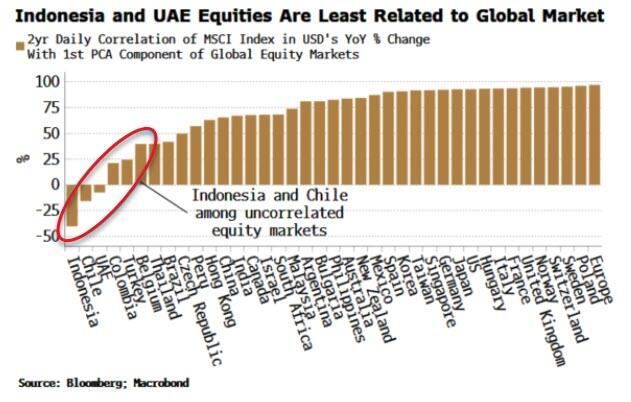
Global equity markets are even more similar to one another than bond markets, with the first component explaining 60% of the total move. Nonetheless, applying PCA offers up some portfolio diversification candidates (using as our data set MSCI country indices in USD).
Indeed, it can be shown that the first PCA component of equity markets is highly correlated to the US’s manufacturing ISM, elegantly demonstrating that in large part global stocks are driven by macro.
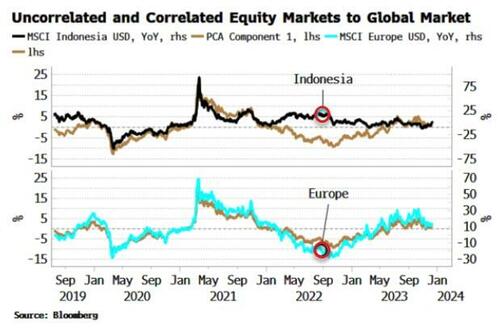
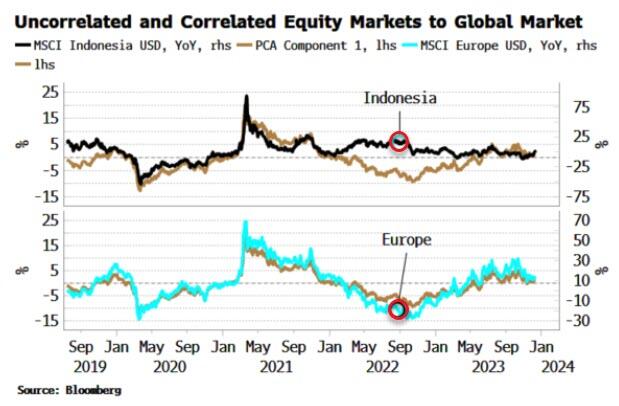
Indonesia, UAE and Chile’s stock markets are all negatively correlated to the global equity move, and therefore the global macro cycle, while European markets move almost in lockstep with it. As the chart below shows, Indonesia’s market (white line) remained supported in late 2022/23, as its market bottomed in July 2022 and rallied through, while other markets went on to make a new low in October of that year.
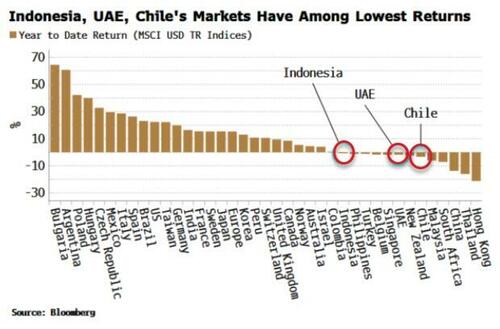
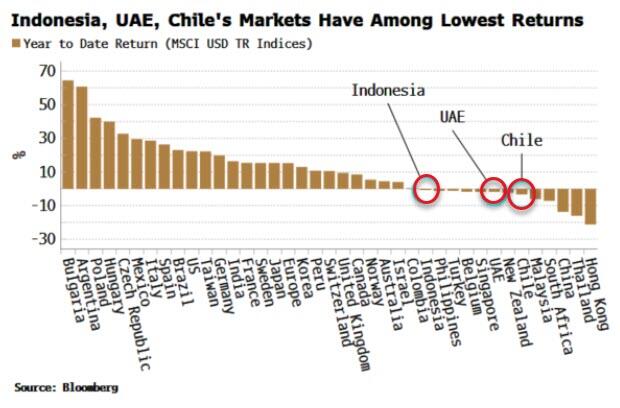
Indonesia et al also have had among the lowest returns of all global equity markets this year. It is relatively common for the markets that are among the worst performers one year to be the among the top the following year.
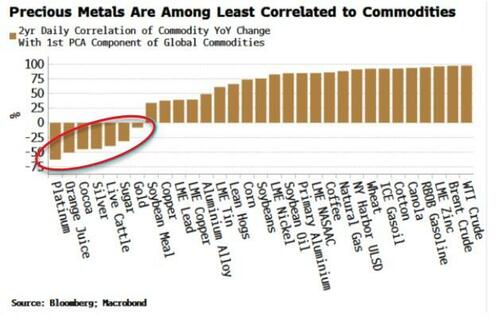
We can complete the analysis by looking at commodities.
The first PCA component here explains about half the move of all commodities, a similar proportion to global bond markets. PCA shows that precious metals, such as gold, silver and platinum are the most negatively correlated to commodities.
As almost all commodities are traded in dollars, the first component is quite similar to the DXY.
So to some extent we are asking which commodities are most negatively correlated to the dollar. Precious metals typically exhibit a more negative dollar correlation than most other commodities. Further, in the current environment they should offer some protection against inflation.
The lack of variation among macro-driven markets makes portfolio investment challenging as it is easier to add risk rather than uncorrelated factors.
The above PCA analysis shows that Japanese bonds, Indonesian equities and platinum are examples of assets that may confer some diversification advantages for global portfolios.
At the very least, you may not have to pay as much attention to central bankers.
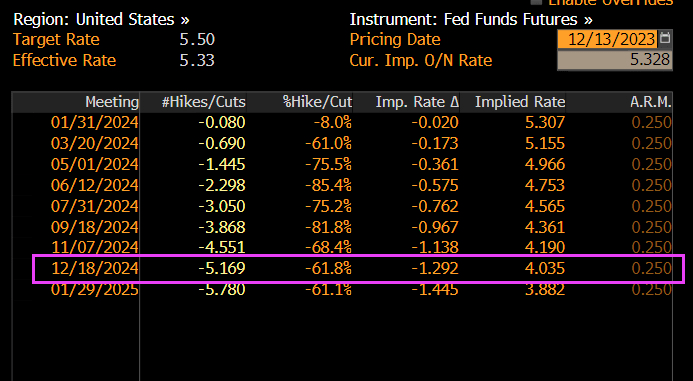
… it was the dot plot, where the median 2024 dot plot now forecasts 3 rate cuts up from 2, that shocked traders: in a very rare admission by the Fed, the central bank confirmed that the pre-meeting market pricing of multiple cuts in 2024 were correct in interpreting the Fed’s intentions. It also confirmed – yet again – that the market was right and every single FOMC member was wrong. In retrospect, none of this should have been a shock.
Commenting on the dot plot, TS Lombard’s Steven Blitz said that “for a group that prizes the pricing of its policy intentions in the forward markets as being more important to shifting market conditions than the spot rate, they h d to know that moving the median forecast for Fed funds at the end of 2024 back to June levels would be a bullish signal.“
Or maybe concerns about the market’s reaction were of secondary importance to a Fed which had gotten the tap on the shoulder by the Biden admin and its Democratic cronies on the Hill, terrified about their re-election chances now that the snake of Identity Politics is finally eating its poisonous tail. Indeed, almost as if having seen the collapse in the recent approval polls, Biden’s handlers made some very persuasive phone calls to the Fed. After all, only something as ridiculous – and serious – as steady political pressure can explain the unprecedented U-Turn by the Fed chair, one which even shocked Powell’s own mouthpiece, Nikileaks, who commented on the “Powell pivot” saying “what a difference two weeks can make.”
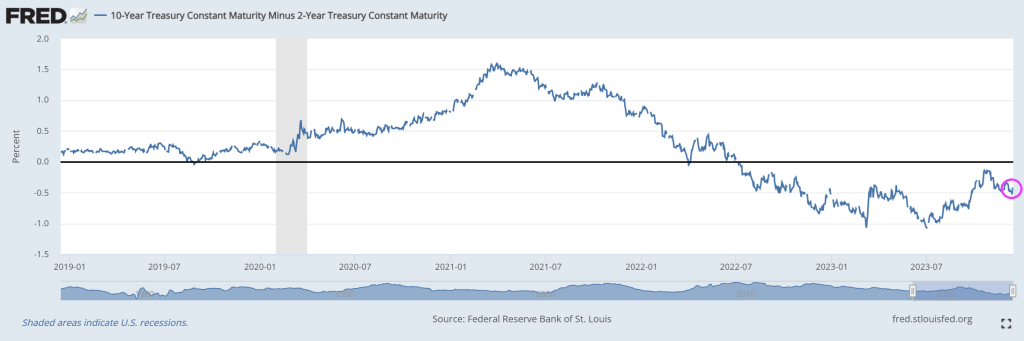
But markets are behaving as if The Fed will begin cutting rates. Look at the US 2-year Treasury yield on Wednesday AFTER the Fed minutes were released.
Bear in mind that mortgage rates are up 149% under Biden. And mortgage payments up 88%. Yikes!
Mortgage applications increased 7.4 percent from one week earlier, according to data from the Mortgage Bankers Association’s (MBA) Weekly Mortgage Applications Survey for the week ending December 8, 2023.
The Market Composite Index, a measure of mortgage loan application volume, increased 7.4 percent on a seasonally adjusted basis from one week earlier. On an unadjusted basis, the Index increased 6 percent compared with the previous week. The seasonally adjusted Purchase Index increased 4 percent from one week earlier. The unadjusted Purchase Index decreased 1 percent compared with the previous week and was 18 percent lower than the same week one year ago.
The Refinance Index increased 19 percent from the previous week and was 27 percent higher than the same week one year ago.
The average contract interest rate for 30-year fixed-rate mortgages with conforming loan balances ($726,200 or less) decreased to 7.07 percent from 7.17 percent, with points decreasing to 0.59 from 0.60 (including the origination fee) for 80 percent loan-to-value ratio (LTV) loans.
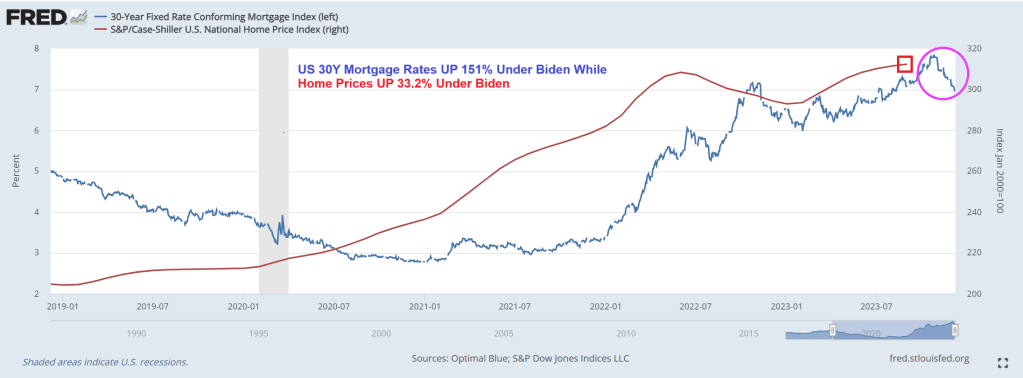
And Freddie Mac’s 30-year mortgage rate is UP 165% under Biden.
Like WEF’s Klaus Schwab, Biden doesn’t want you to have a low rate mortgage for Christmas!
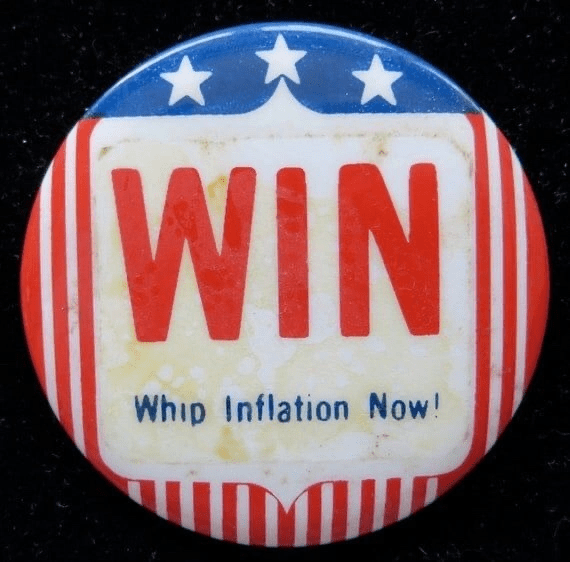
President Gerald For (R-MI) might be best known for his silly attempt at “whip inflation NOW” by having “Music Man” Meredith Wilson write a song: “Whip Inflation Now!” But the second line has been forgotten: “Eat crow instead of cow.” That second line is appropriate for Bidenomics which has left America’s middle class eating crow in the housing market.
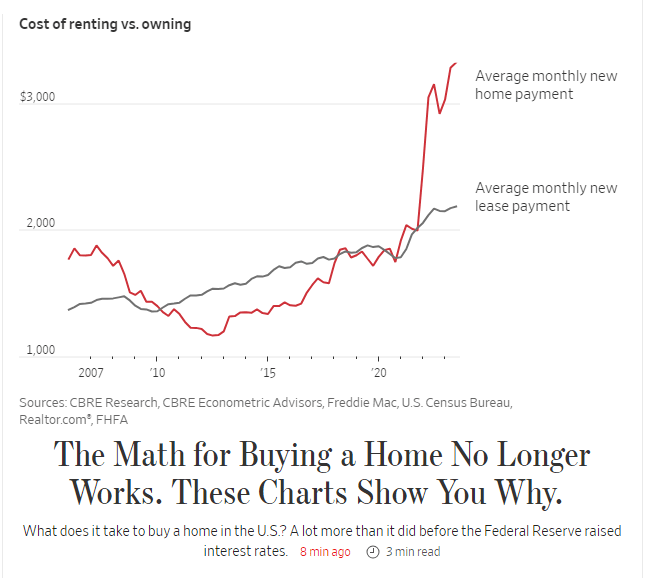
The Wall Street Journal had an interesting piece showing the rise of 30-year fixed rate mortgage payments under Biden where the average monthly new mortgage payment is now $3,222, up from $1,787, up 86%!
The 86% rise in mortgage payments is two fold. First, home prices are up 33.2% under Biden and the 30-year mortgage rate is up 181%.
Yes, Americans are eating crow under the utter failure known as Bidenomics: top down government mandates for massive green energy and other nonsense.
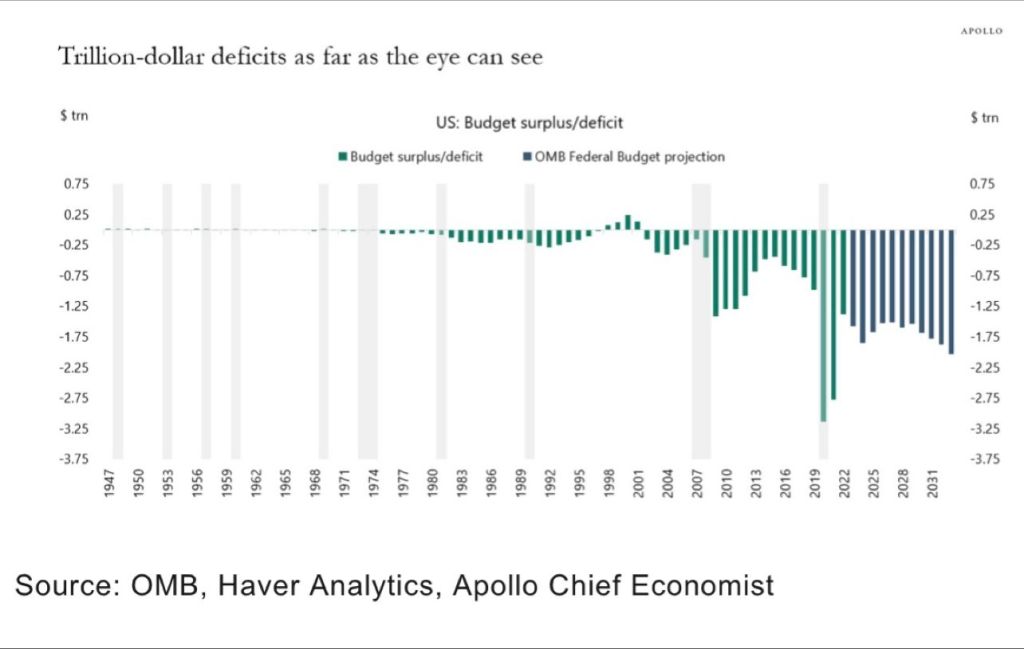
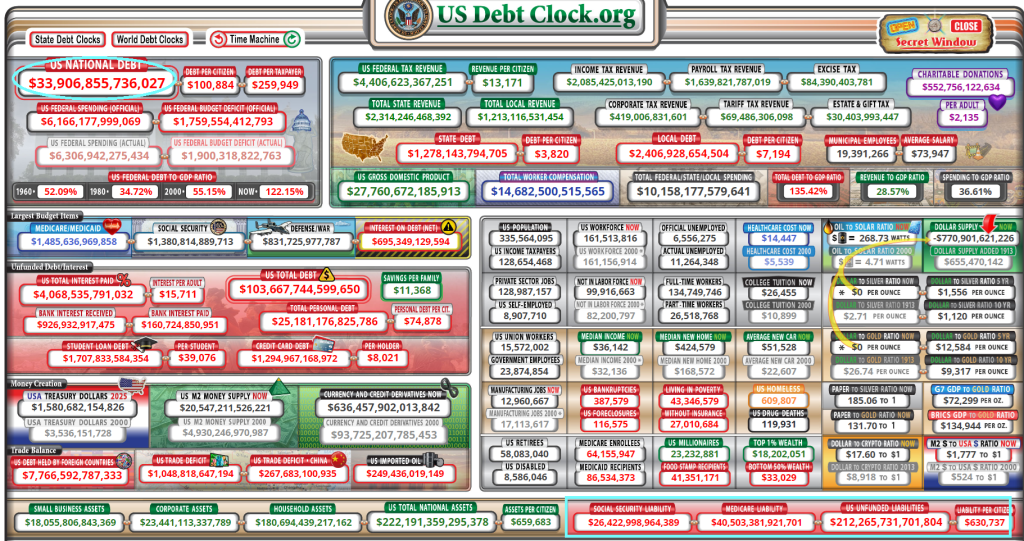
We are on a Highway To Hell! Massive Federal Budget deficits and staggering payments to Treasury from The Fed (losses on balance sheet) and $212 TRILLION in unfunded promises to the non-elites.
Under Modern Monetary Theory (or print money without consequences), we are seeing trillion dollars budget deficits with no end in sight. Nothing has been the same since the financial crisis of 2008 with The Fed’s massive intervention.
Then we have The Fed paying an ever growing amount to US Treasury for losses on their huge balance sheet.
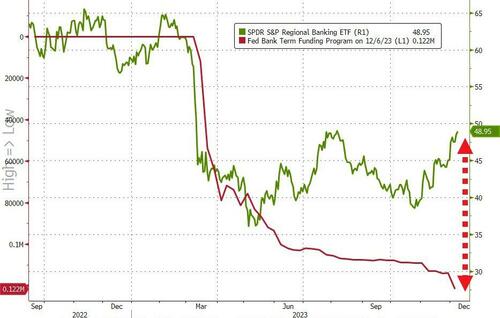
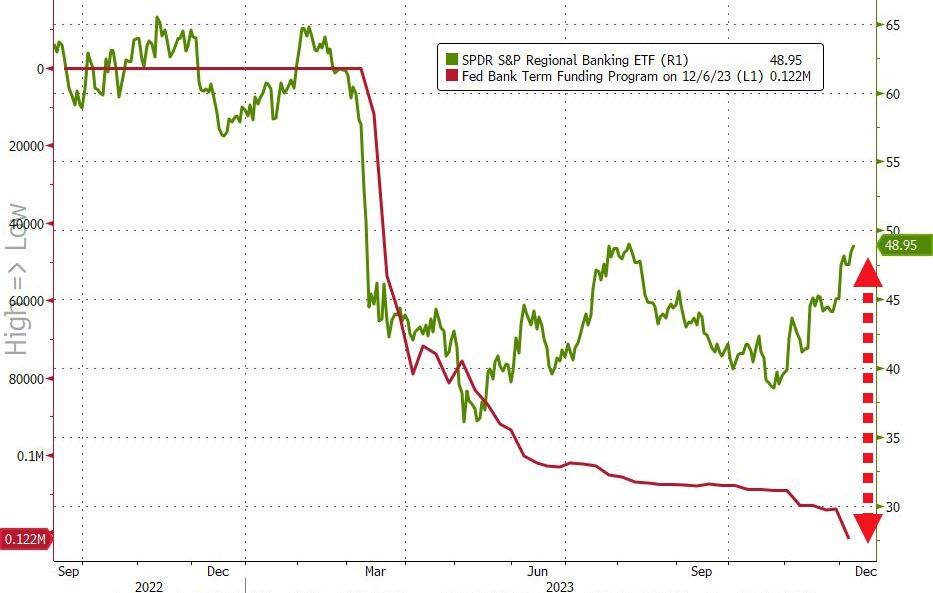
The song “Running on Empty” by Jackson Browne comes to mind when analyzing the state of American banking, especially regional banks.
Yesterday we found out that inflows to money-market funds continue to be huge ($290BN in six weeks), and more importantly, regional banks’ usage of The Fed’s BTFP bailout facility surged to a new record high (even as regional banks surged…
Source: Bloomberg
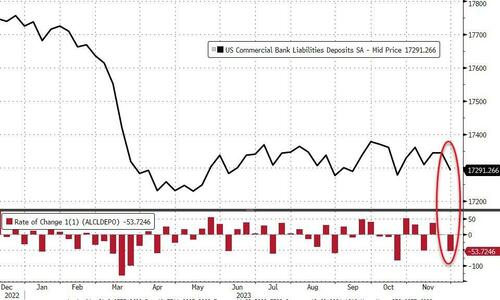
And so, with that shitshow in mind, we await the glorious manipulation of The Fed’s bank deposits data to reinforce that equity confidence.
On a seasonally-adjusted basis, banks saw a $53.7BN deposit outflow…
Source: Bloomberg
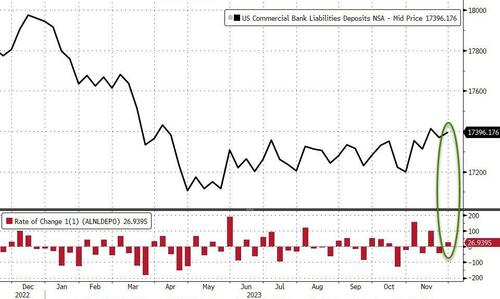
However, on a non-seasonally-adjusted basis, deposits rose by $27BN…
Source: Bloomberg
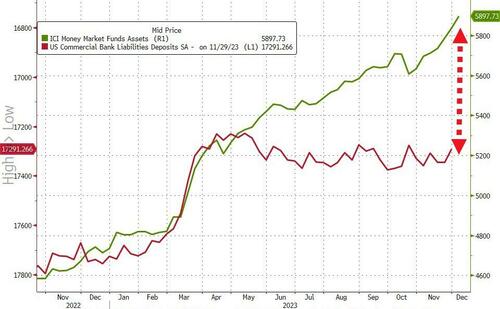
And even with the outflows (SA), the divergence between soaring money-market funds and bank deposits continues to widen…
Source: Bloomberg
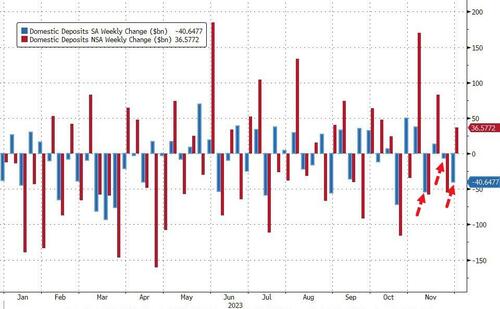
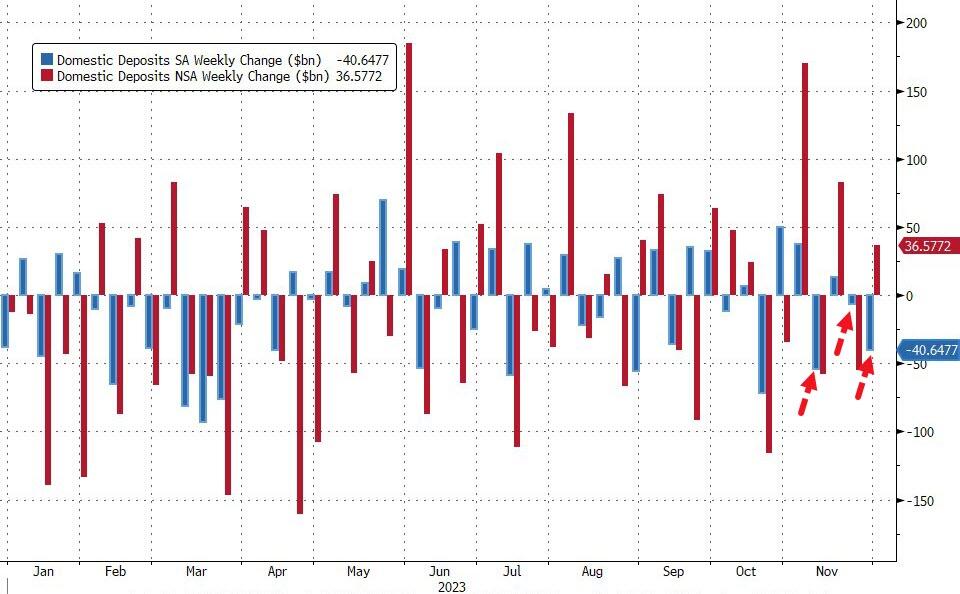
Excluding foreign bank deposits, domestic banks saw the third week of the last four of deposit outflows (-$40.6BN SA) with Large banks -$35BN (SA) and Small banks losing $5.7BN (SA). On an NSA basis, domestic banks saw inflows of $36.5BN last week with Large banks adding $32BN and Small banks adding $4BN…
Source: Bloomberg
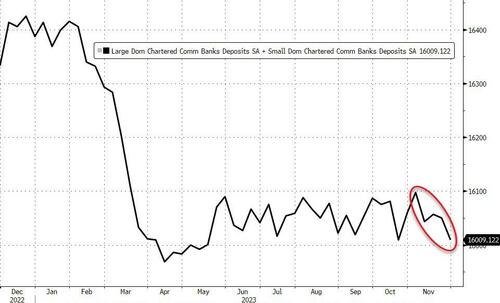
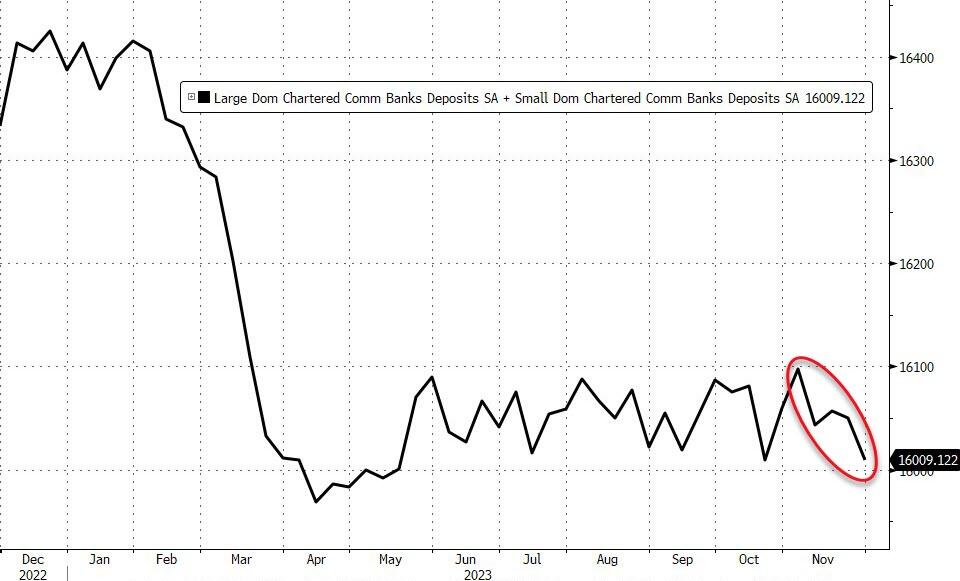
That adds up to $88BN (SA) of deposit outflows in the last four weeks (bank to its lowest total since May…
Source: Bloomberg
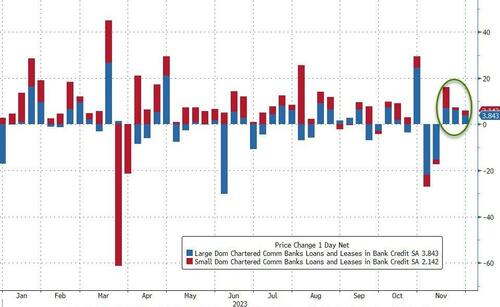
And on the other side of the ledger, despite deposits declining SA, loan volumes increased (SA) for the third week in a row with Small banks adding $2.1BN and Large banks adding $3.8BN…
Source: Bloomberg
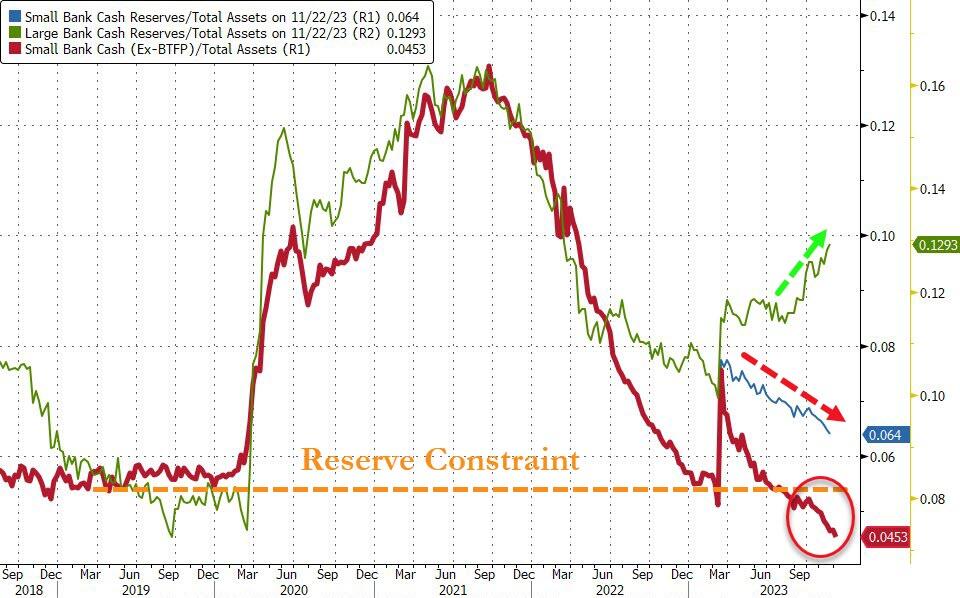
Finally, the key warning sign continues to trend ominously lower (Small Banks’ reserve constraint), supported above the critical level by The Fed’s emergency funds (for now)…
Source: Bloomberg
As the red line shows, without The Fed’s help, the crisis is back (and large bank cash needs a home – green line – like picking up a small bank from the FDIC).
Mortgage rates, despite coming down recently, are still up 151% under Biden. And home prices are up 33.2%. So much for affordable housing for those renting.
So, “Running on Empty” applies to middle class and their ability to afford housing.


You must be logged in to post a comment.