President Joe Biden and his boss Barack Obama remind me of the legendary corrupt Chicago politicians First Ward Alderman Michael “Hinky Dink” McKenna and “Bathhouse” John Coughlin. And their love of “boodle” (a slang term money, gained (Biden family payoffs from foreign countries), or spent improperly (Obama shipping large pallets of cash to US enemy Iran). Biden and Obama are indeed the modern day “Lords of the Levee”.
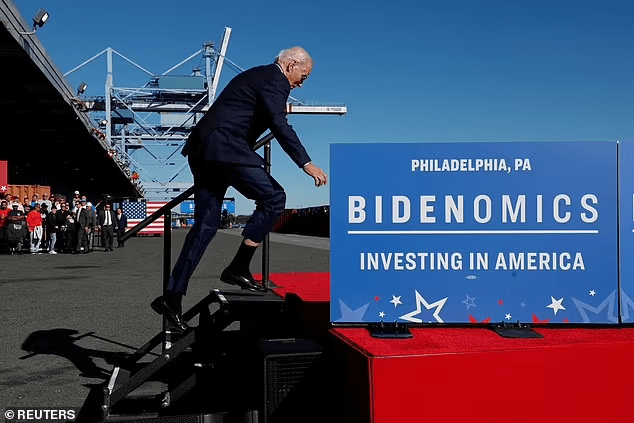
But in another example of Boodle, just in time for the 2024 election, we have Biden announcing $16.4 BILLION to …. Amtrak for the Northeast corridor (aka, the Acela train carrying Congress members, staff, media from Washington DC’s Union Station to NYC’s Penn Station. Bear in mind that the Amtrak route is not a payoff to the US middle class, but a gift to the elite passengers on the Washington DC to NYC (then on to Boston) route. But unlike Biden’s other boodle (the Ukraine war where Zelenskyy and his cronies are partying hearty with US taxpayer funds), at least no one will by dying on Amtrak. (other than in the film “Unbreakable.”)
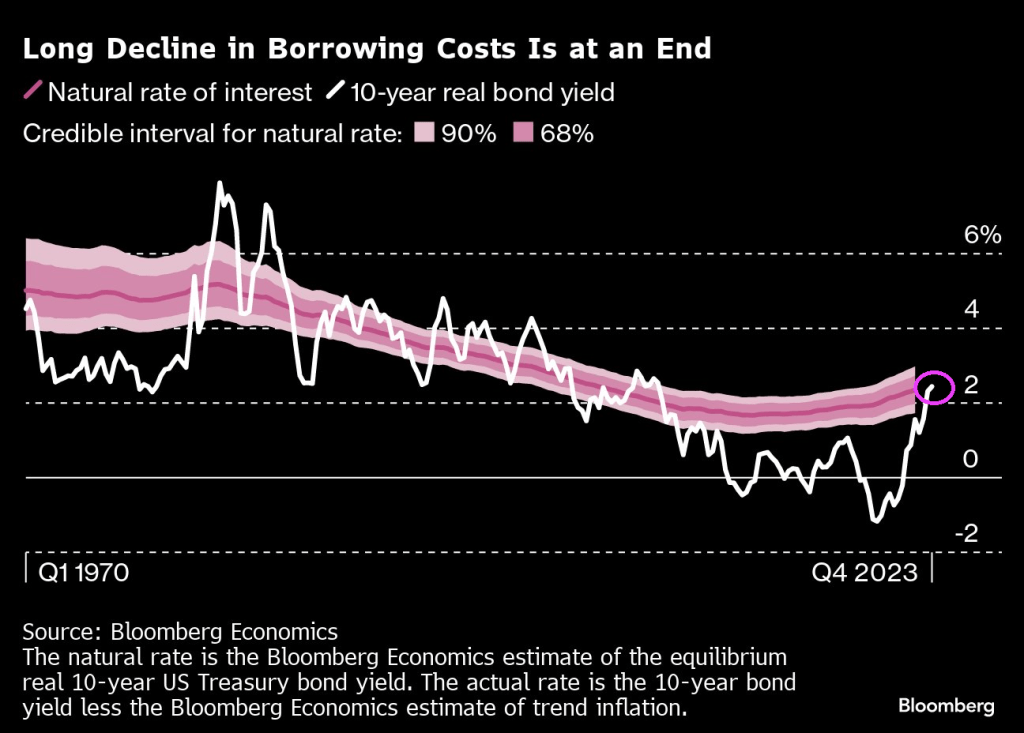
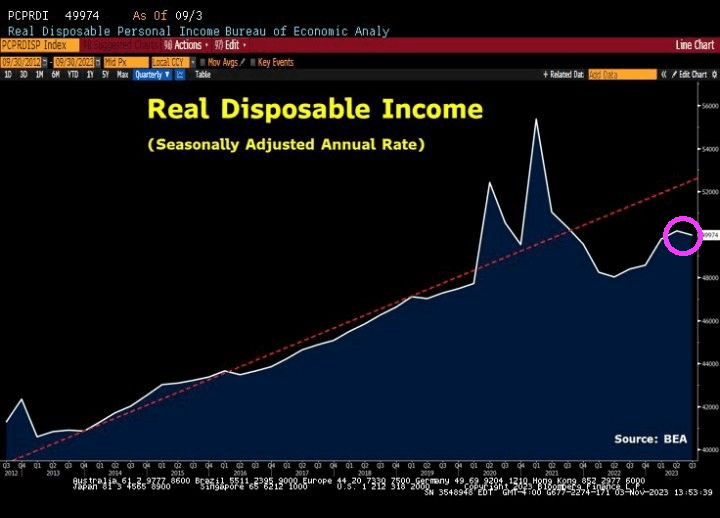
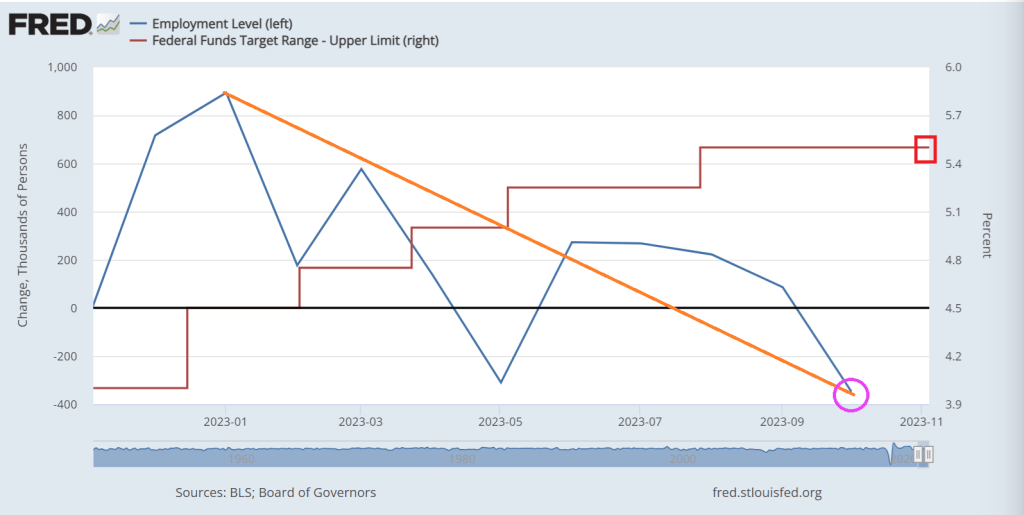
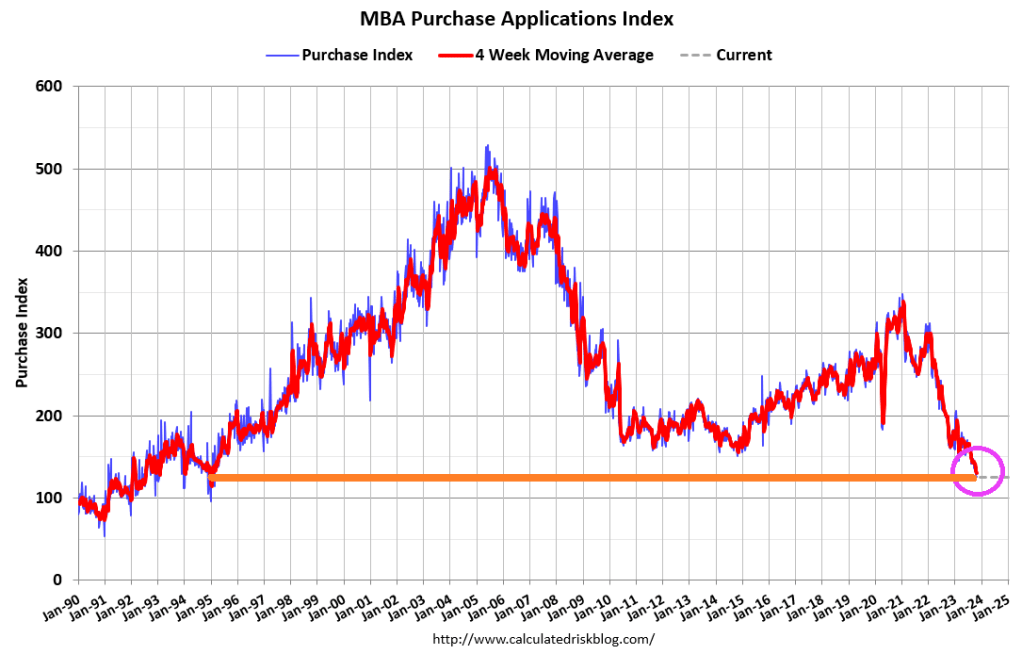
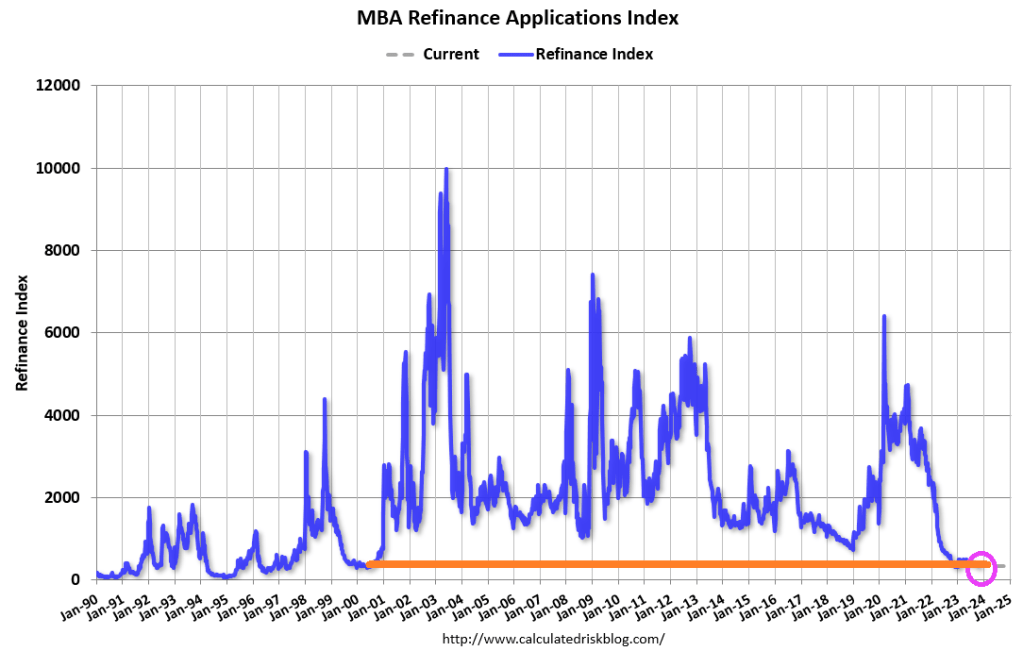
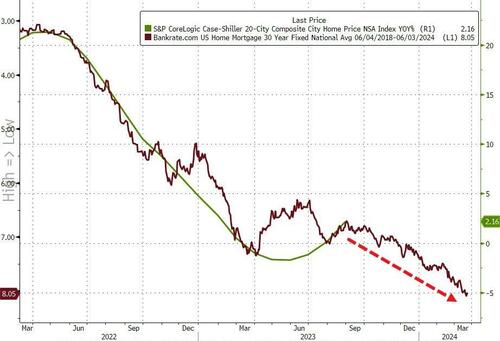
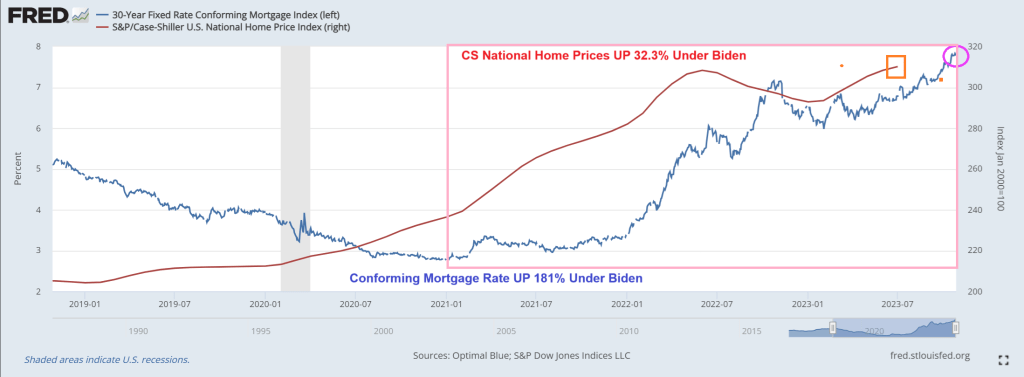
But on the middle class front, we can see “cheap rates” are a thing of the past as markets have to deal with Biden’s inflation problem and Fed rate hikes.
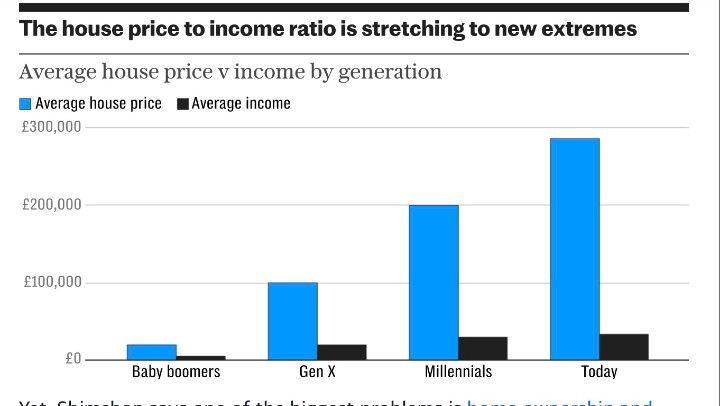
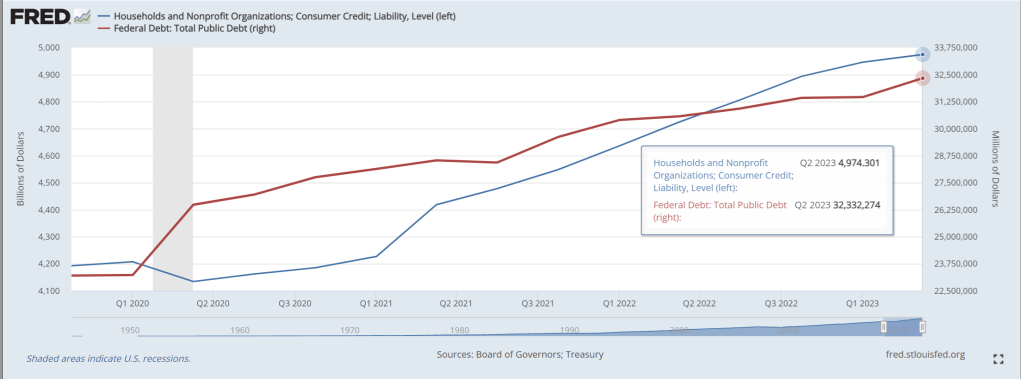
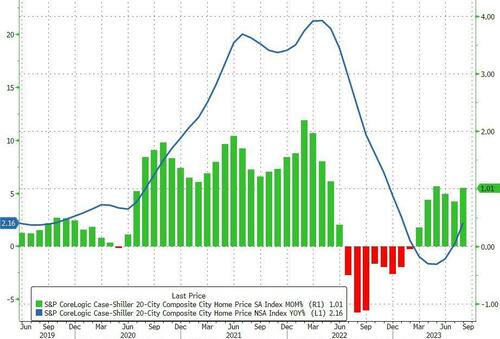
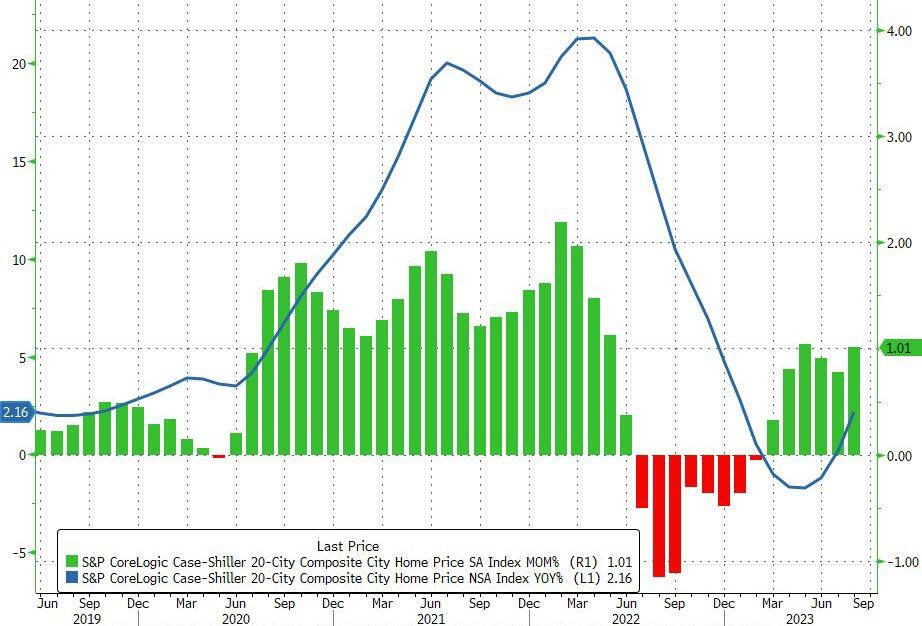
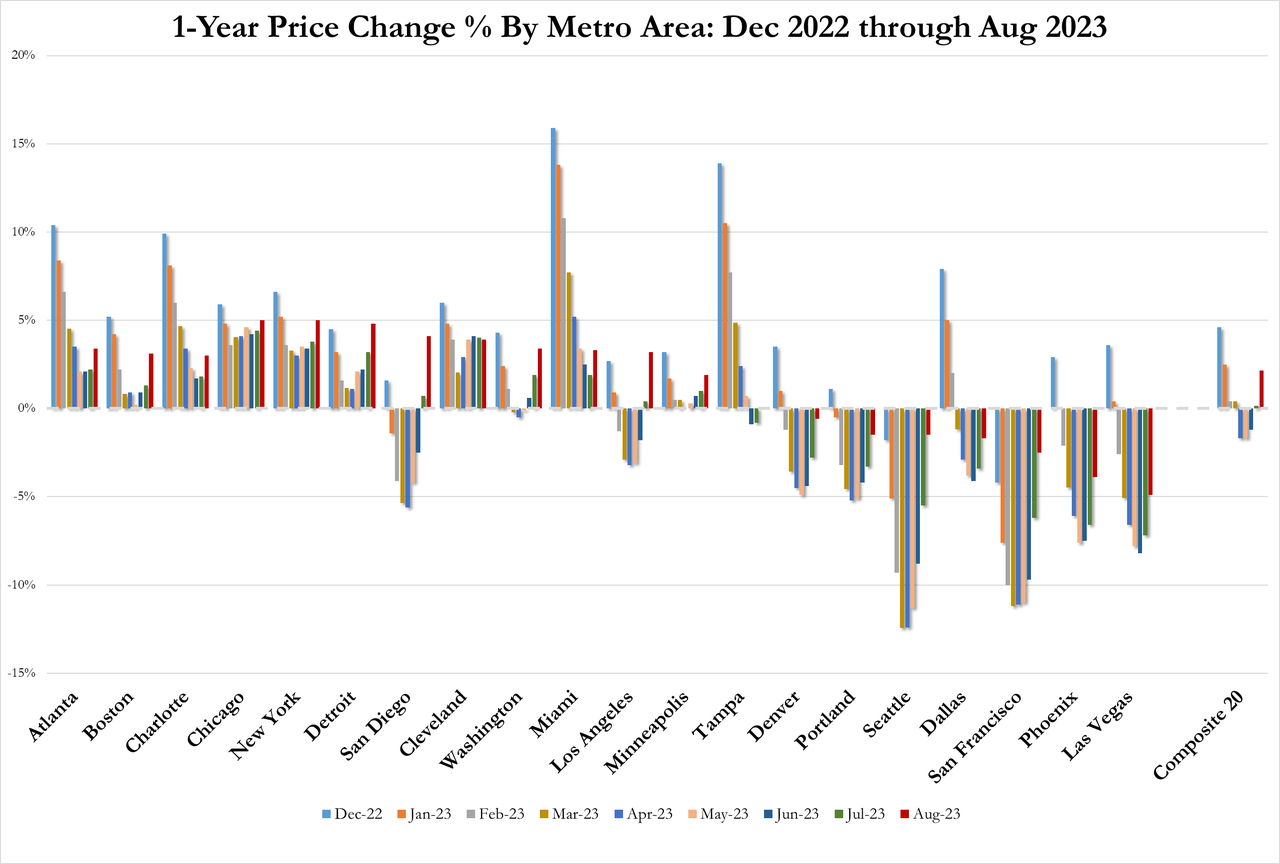
And with rising home prices under Biden, the house price to income ratio is out of control and causing pain for the middle class.
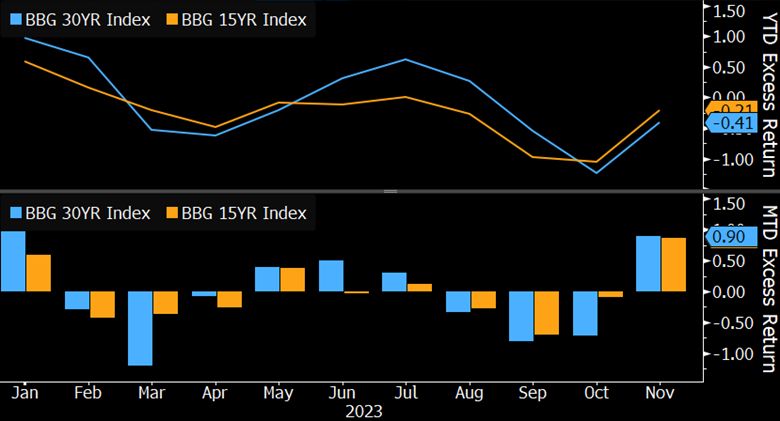
On the MBS front, we see negative returns.
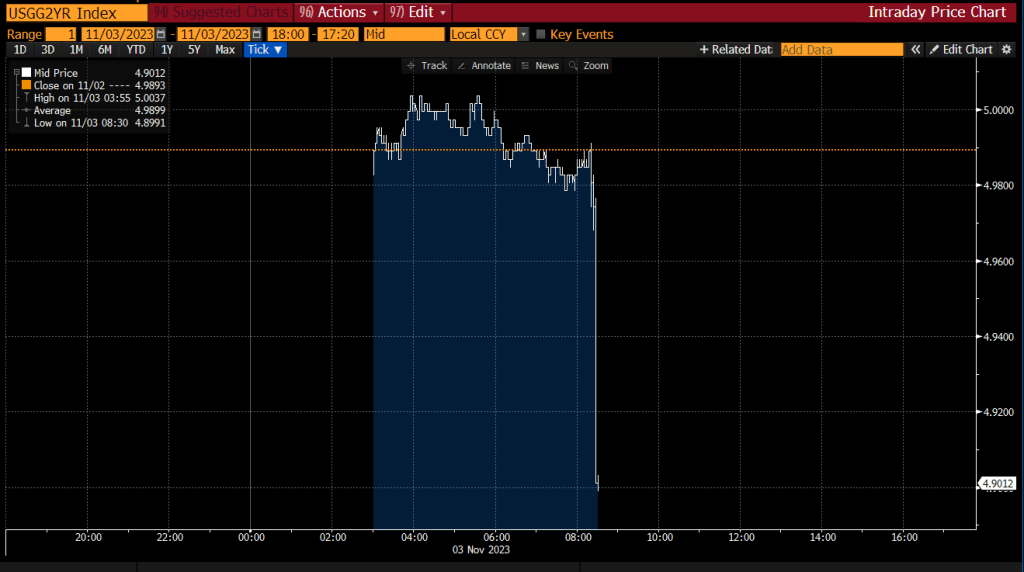
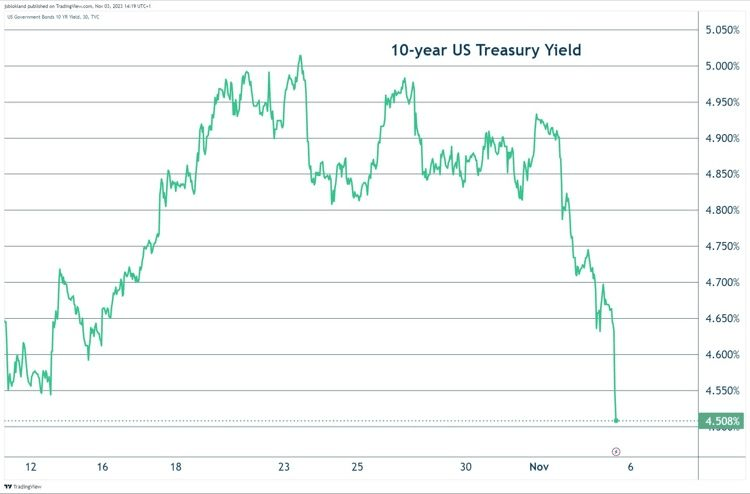
The 2-year Treasury yield is dropping faster than Biden’s polling numbers.
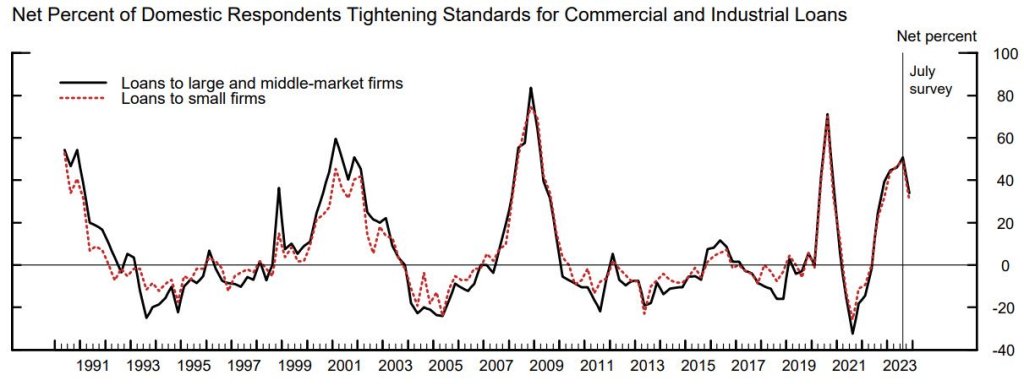
On the credit side, more lenders are tightening standards for C&I loans.
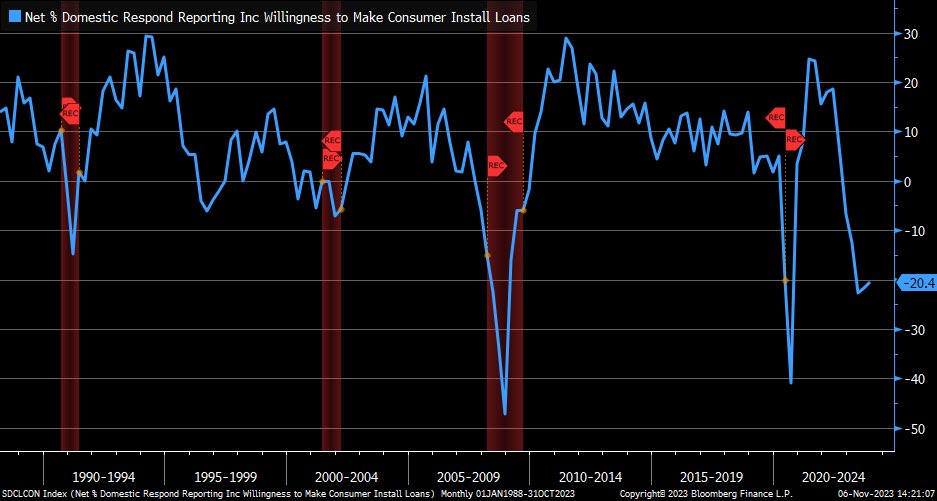
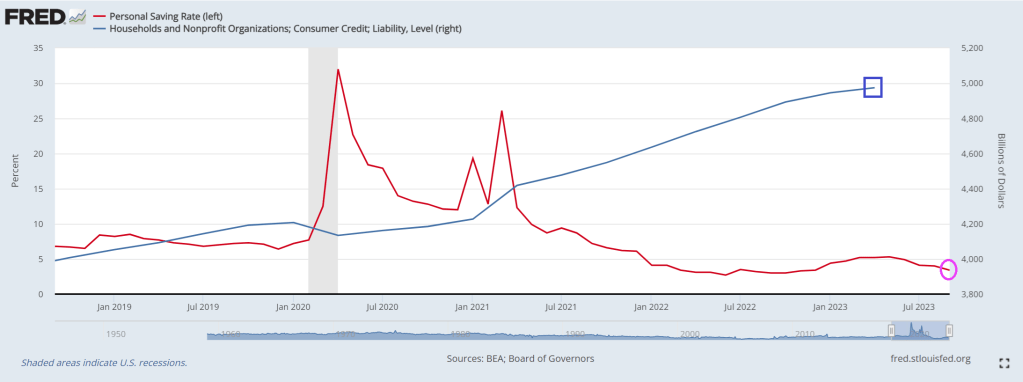
And banks remained restrictive in their willingness (or lack thereof) to make consumer loans, but there was a marginal improvement from prior release.
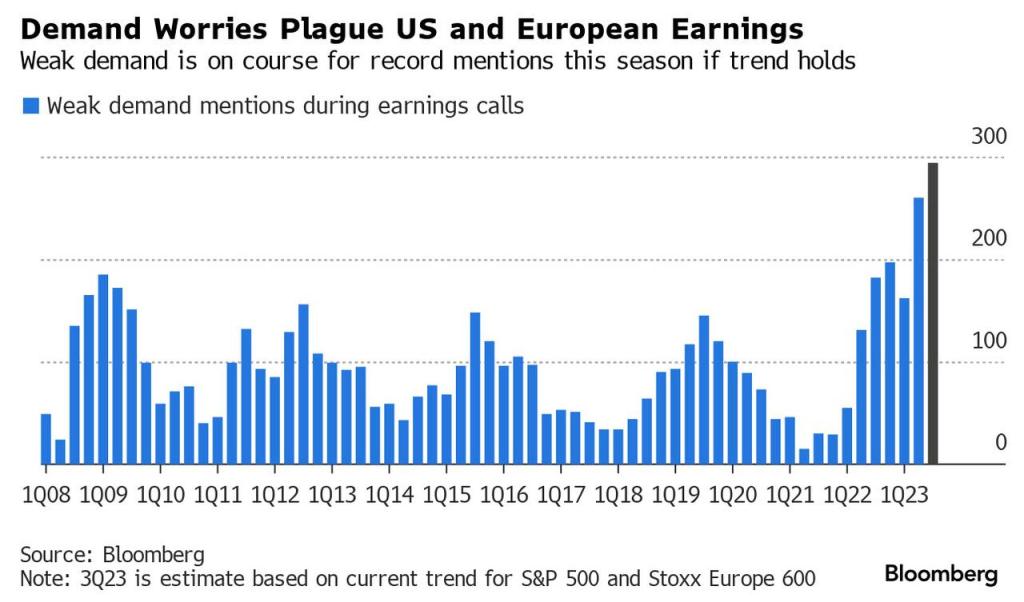
On the global front, Maersk announces plans to cut at least 10,000 jobs due to weakening global trade.
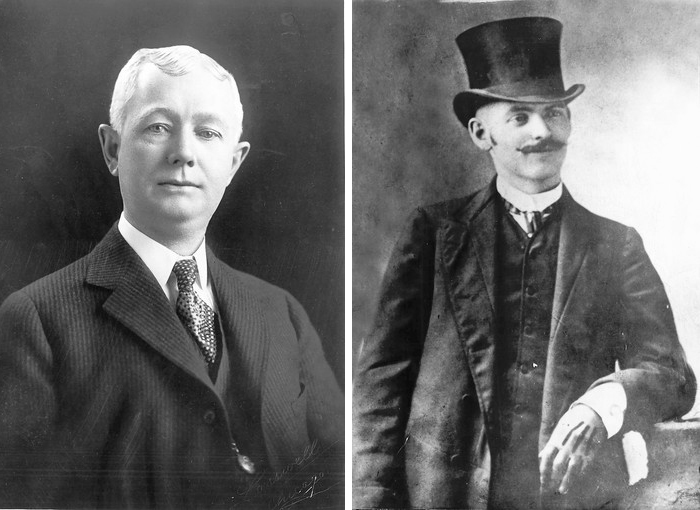
Here is a picture of Hinky Dink (Joe Biden) and Bathhouse Barry Soetoro. I mean Bathhouse John Coughlin, the Lords of the Levee.


You must be logged in to post a comment.