Former Fed Chair Janet Yellen, notorious for leaving rates too low for too long (TLTL) and then suddely raising them after Donald Trump was elected President, wants rates lower again for much longer. Make rates great again (MRGA?).
YELLEN SAYS DEBT SERVICE COSTS WILL BE 1% OF GDP FOR THE NEXT DECADE. – Reuters
Her statement implies that the economy will be strong and the government will run budget surpluses, or interest rates will be near zero for the next ten years.
Instead of guessing what she is pondering, we do some math and arrive at the only possible answer.
The Government Can’t Afford Today’s Interest Rates
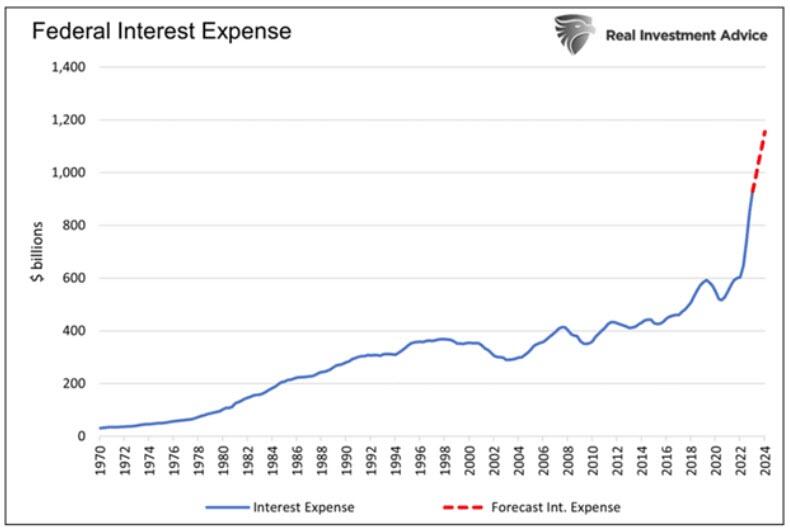
Before walking through various scenarios to figure out what Yellen may be implying, it’s helpful to provide background on what drives her mindset. In our article The Government Can’t Afford Higher For Longer, Much Longer, we shared the following graph and commentary:
Total federal interest expenses should rise by approximately $226 billion over the next twelve months to over $1.15 trillion. For context, from the second quarter of 2010 to the end of 2021, when interest rates were near zero, the interest expense rose by $240 billion in aggregate. More stunningly, the interest expense has increased more in the last three years than in the fifty years prior.
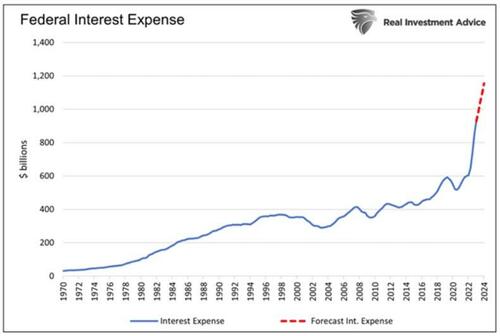
The graph above is just the tip of the fiscal iceberg. Every month, lower-interest-rate debt matures and will be replaced with higher-cost debt.
Higher interest rates are an additional funding burden for the federal government. Janet Yellen surely understands the damaging situation and grasps that higher interest rates are not feasible given current debt levels.
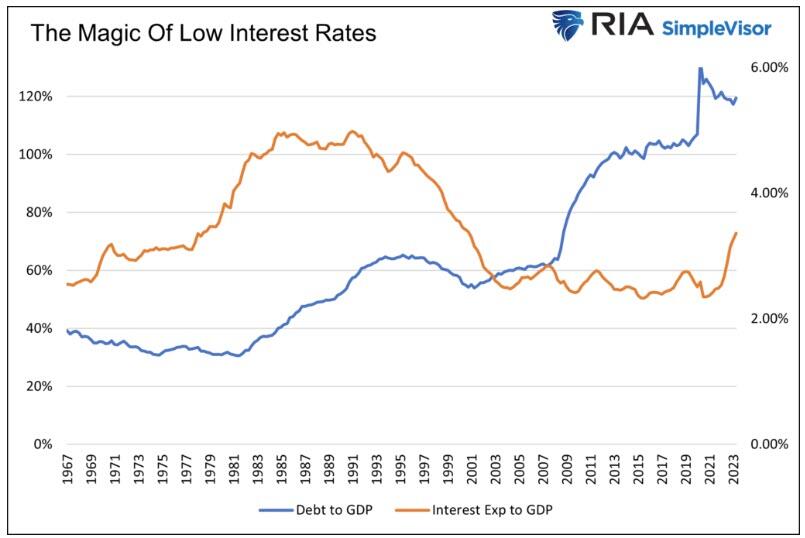
Low-Interest Rates Make Debt Manageable
The government’s debt-to-GDP ratio has climbed three-fold since 1966. Yet, until very recently, the ratio of the federal interest expense to GDP was at its lowest level since 1966.
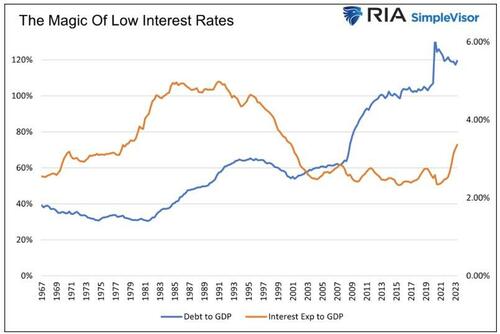
While the amount of debt rose sharply, its cost was offset by rapidly falling interest rates. As a result, higher debt levels were very manageable.
If $1 trillion of debt with a 4% coupon matures, and the Treasury replaces it with $2 trillion at a 2% coupon, the interest expense doesn’t change despite doubling the debt. While a simplified example, that is essentially what has occurred for the last 30 years.
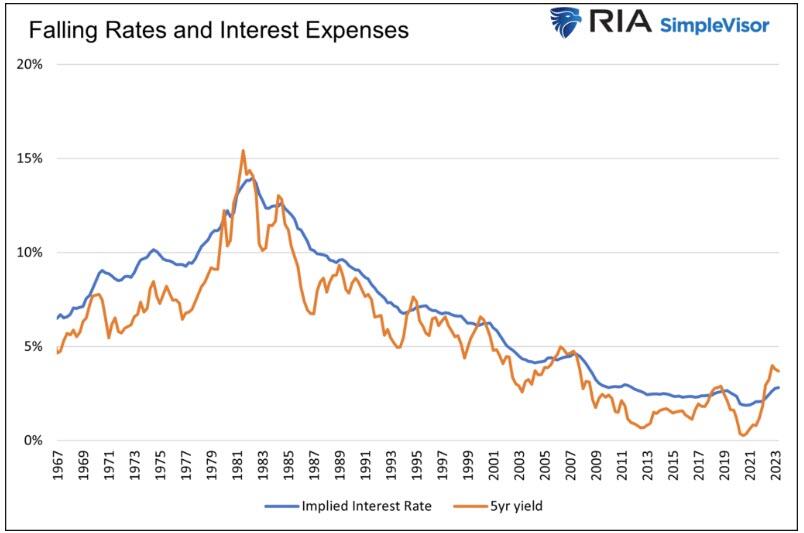
The following graph compares the 5-year U.S. Treasury note and the implied cost of funding the government’s debt.
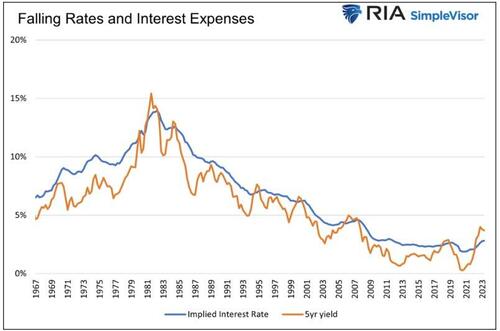
In time, as lower interest rate debt is replaced with higher interest rate debt, the benefits of lower rates work in reverse.
“Debt Service Costs At 1%” – Is It Possible?
We return to Janet Yellen’s message and discuss why she is likely correct.
Balanced Budgets and Unicorns
In the five years leading up to the pandemic, nominal GDP grew at 5.03% annually. Let’s optimistically assume growth continues at 5% consistently for the next ten years. Now, let’s tack on an even bolder presumption: the government balances its budget every year for the next ten years. Thus, the amount of outstanding debt will remain constant. For context, in the last 57 years, there has only been one year in which the amount of debt has not increased.
In such a far-fetched scenario, the debt-to-GDP ratio would drop considerably to 70%. However, interest costs would equal 2% of GDP. Such is much better than the current 3.36% but double Janet Yellen’s 1% objective.
Budget surpluses for the next ten years would lower interest expenses even more and possibly get the interest expense to GDP ratio to 1%. However, the odds of a unicorn spraying rainbows across the sky and the government running a surplus are the same: zero percent.
Consequently, we exclude surpluses as a viable way to reduce the interest expense to a more manageable level.
Budget Deficits And The Magic Of Low-Interest Rates
Balanced budgets or surpluses are unrealistic, given the political and fiscal trends. Further, the economy relies heavily on government spending. While fiscal prudence would be good in the long run, the short-run effect would be a recession.
Instead of using pipe dreams as scenarios, let’s get realistic. The more likely, albeit still optimistic, scenario involves the debt and GDP growing at the same rate. Let’s also assume interest rates remain at current levels. In this exercise, we assume an average borrowing cost of 4.75%, which is a little below the current weighted average funding cost for the government. Under this “realistic” picture, interest expense would climb to 5.6% of GDP.
The only logical variable in the equation that can make Janet Yellen correct is the future interest rate.
To arrive at Yellen’s 1% figure, assuming debt grows at the rate of GDP, interest rates must be much lower.
In time, a weighted average interest rate of 0.85% would put the nation’s interest expense at 1% of GDP.
When Janet Yellen tells us the debt cost to GDP ratio will be 1% over the next ten years, she is really saying interest rates will be below 1% for the next ten years.
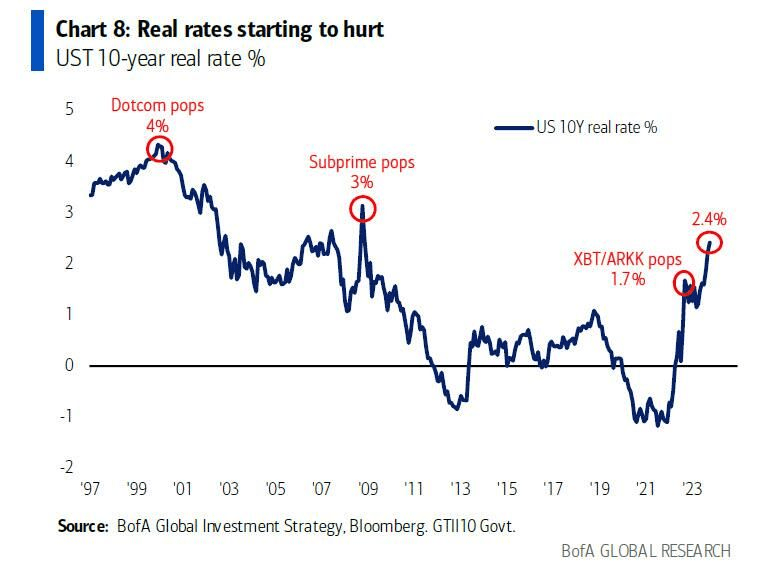
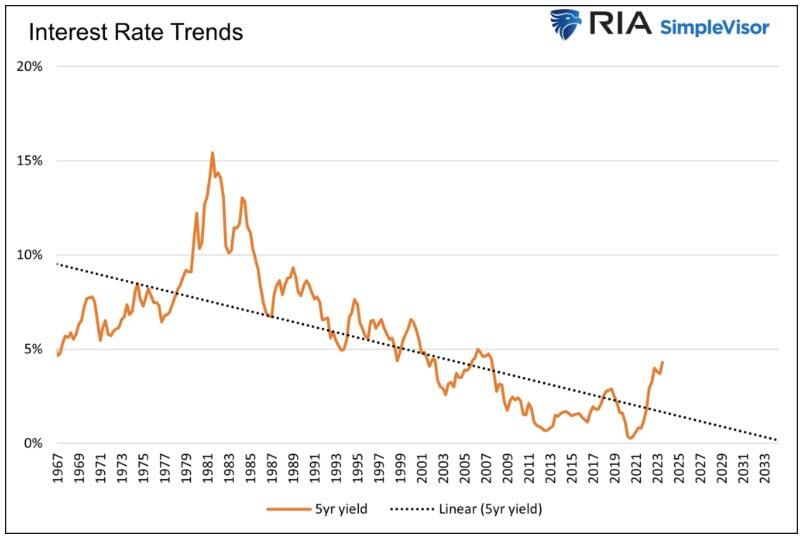
Therefore, Janet Yellen must believe that the recent spike in inflation and yields is an anomaly. If the pre-pandemic economic and interest rate trends resume, she will be correct.

Summary
Part of Janet Yellen’s job is to exude confidence to its investors. In this case, it means telling the public that the current jump in interest expenses will not last. While she would probably prefer to be straightforward and say interest rates will be much lower, she must also be sympathetic to the Fed’s job of getting inflation down. Therefore, to walk the party line, she must speak in code, so to speak.
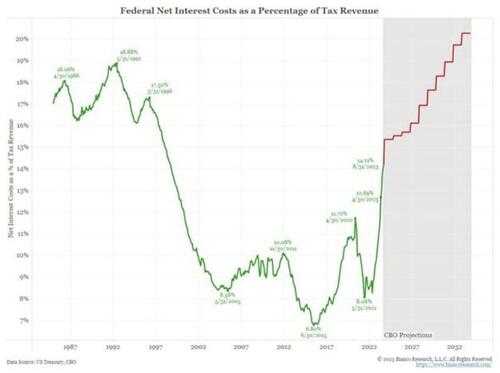
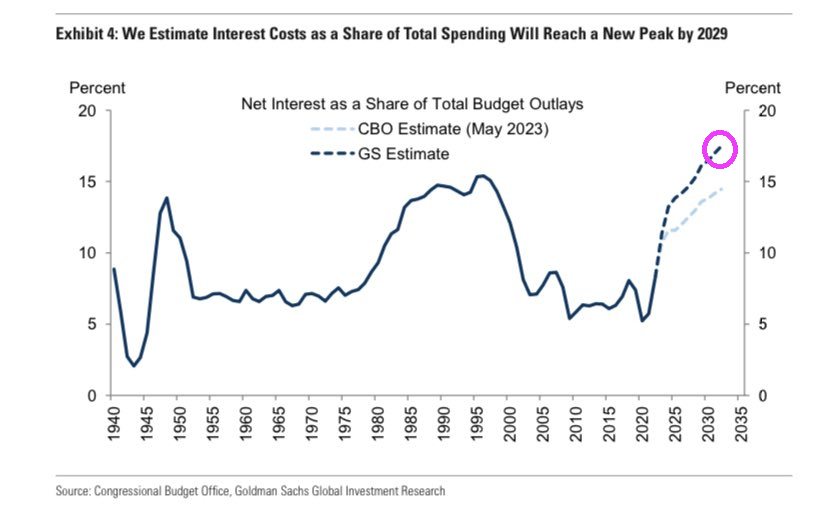
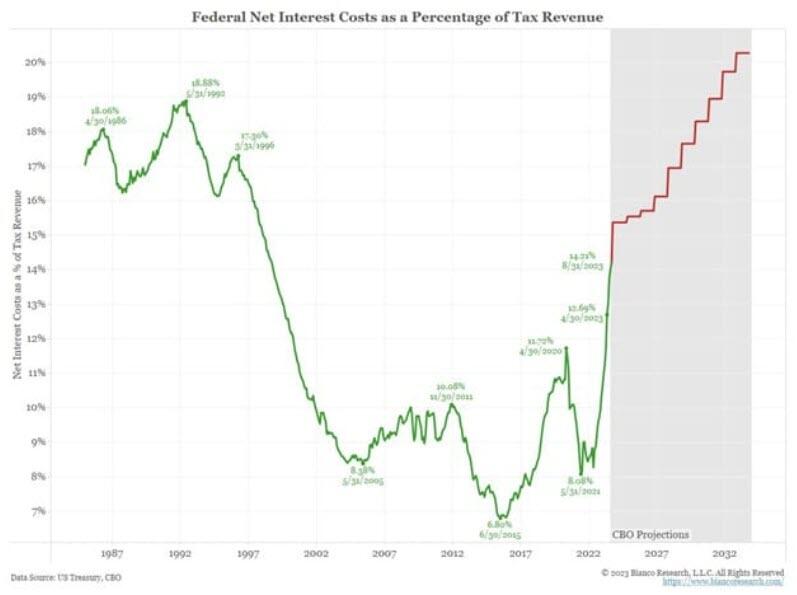
Whether you agree with Yellen’s projection or not, the following CBO graph projecting interest costs as a percentage of tax revenues, courtesy of Bianco Research, highlights that the government has no choice but lower for longer interest rates. The current level of interest rates will bankrupt the nation.
This makes sense. Two global elitists who look down with disdain and want to reprogram MAGA voters. Can we reprogram the MRGA types into letting rates float to market.


You must be logged in to post a comment.