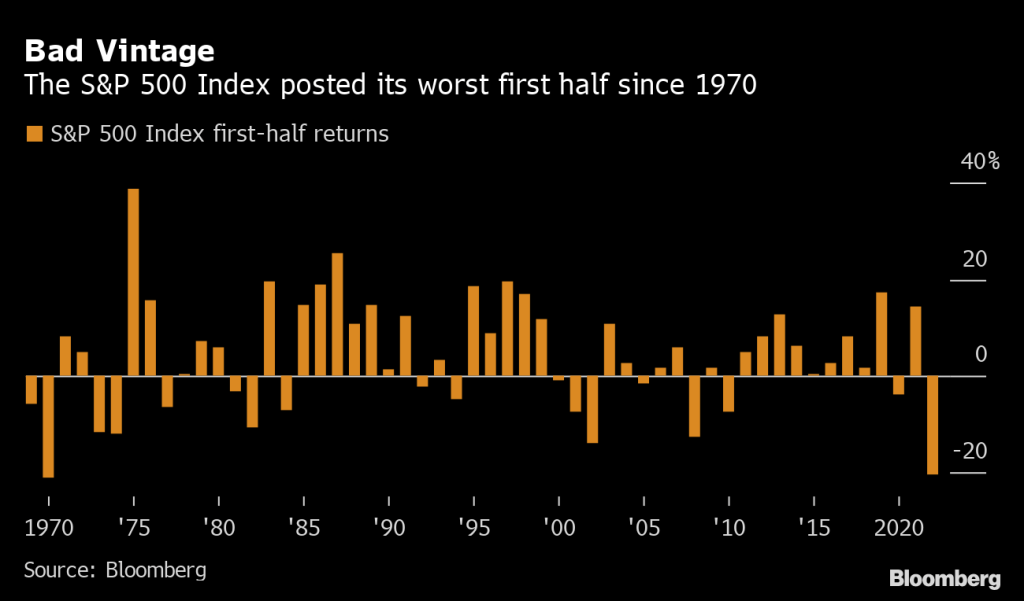
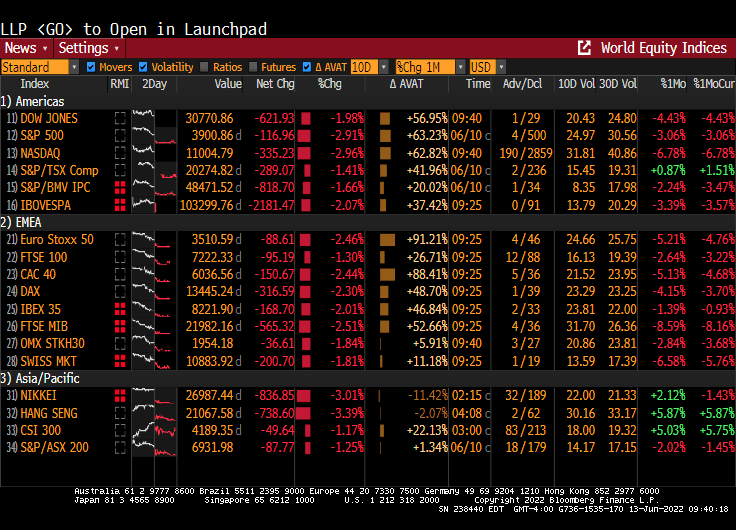
A “recession shock” begins for markets following the worst first-half for the S&P 500 in more than 50 years.
And investors are running to Treasuries for safety as US Treasury 10-year yields tank 14 basis points.
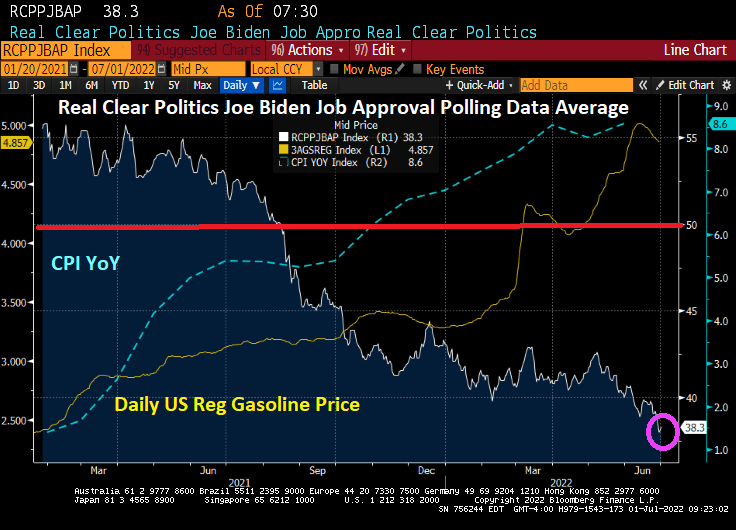
Biden’s approval rating has collapse with inflation and rising gasoline prices. Note that Biden’s approval rating dropped below 50 in mid-August 2021, long before the Russian invasion of Ukraine in late February 2022. Gasoline prices had risen 49% since Biden’s inauguration as President, but before the Russian invasion of Ukraine.
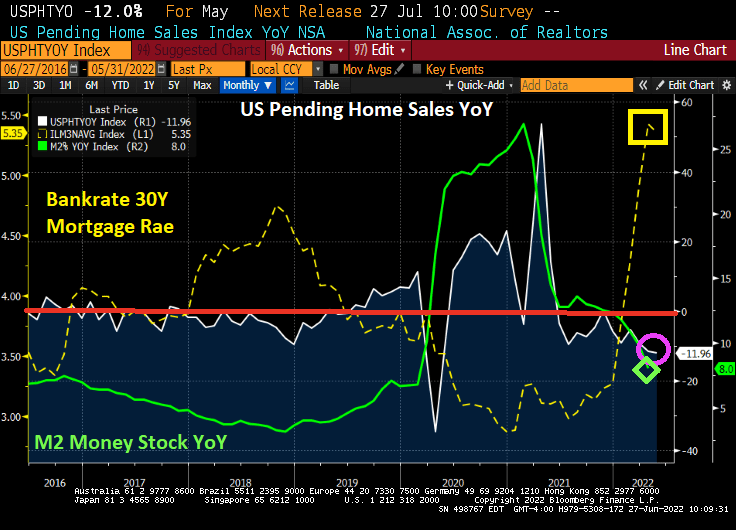
US pending home sales declined -12% YoY in May as The Fed cranked up mortgage rates. That was 11 out of the last 12 months had declining pending home sales.
Consumers are healthy? It is true that the US U-3 uemployment rate is low (3.6% versus 14.70% in April 2020 thanks to government shutdowns over Covid). But even though unemployment is low, consumer sentiment is at its lowest point since 1977.
Generally, consumer sentiment is high when unemployment is low, but not this time around. Currently, inflation is at the highest level since March 1980 even though consumer sentiment bottomed-out in April 1980.
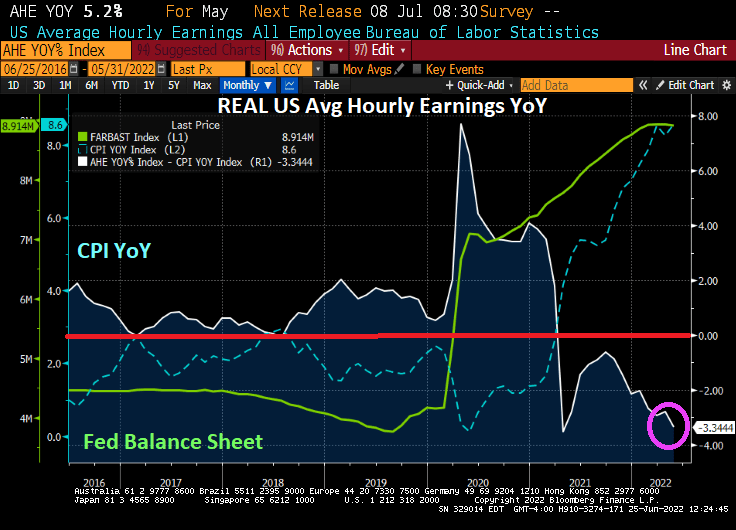
Here is my chart showing that REAL average hourly earnings growth YoY is negative and getting worse, hardly a sign of “healthy consumers.”
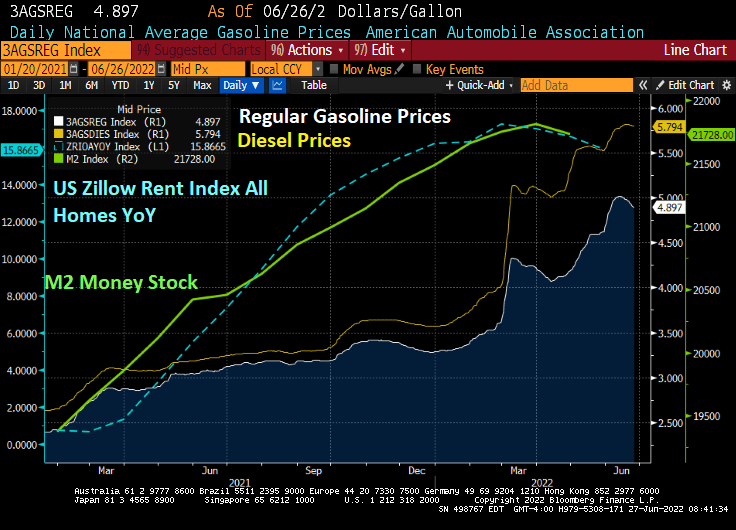
Of course, rising gasoline and diesel prices have risen dramatically since 2021, but are declining slightly thanks to the global economic slowdown (read “lower demand”).
And a M2 Money Stock (green line) declined, US rents (blue line) declined as well.
Most of us are painfully aware of rising food prices, particularly with the US fighting a proxy war with Russia. Wheat prices have doubled under Biden and the Russian invasion of Ukraine.
But inflation is everywhere. Rising home prices, rising gasoline and diesel prices, etc. When Jeep can see a Wagoneer for $100,000+, you know we have inflation.
The surprise this morning was retail sales, up 0.9% MoM (though still less than expected), despite rising prices. Odd since REAL wage growth is negative.
But the other bit of good news this AM is that US industrial production rose +1.1% MoM in April. And US Capacity Utilization is rising dangerously towards 80%, it is at 79% in April.
You will notice that Fed monetary tightening occurs when capacity utilization hits 80%, indicating an overheated (or OVERSTIMULATED) economy. Yes, we still have The Fed Funds Target Rate (Upper Bound) at only 1% and The Fed Balance Sheet still near $9 trillion. So, Fed stimulypto is still in play.
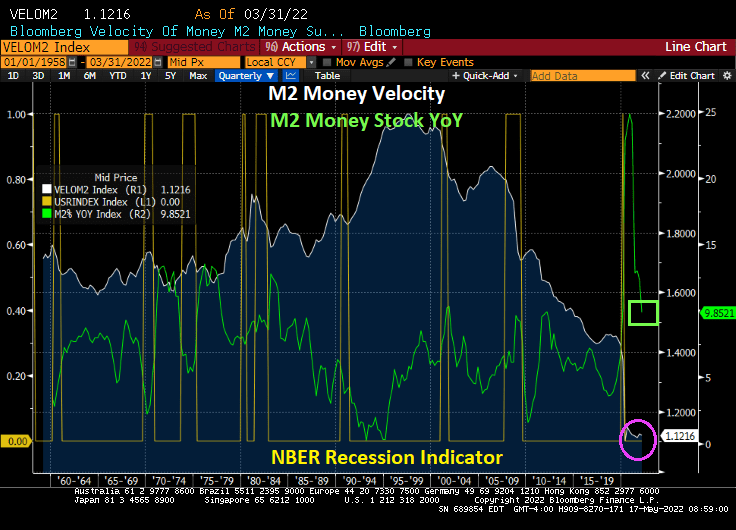
Meanwhile, M2 Money Velocity is near its historic low and M2 Money YoY is still sizzling at 9.85% YoY.
Wheat prices have doubled under Biden, and you can see how wheat futures soared when Russia invaded Ukraine.
I hope America’s foreign policy wizards (Biden, Harris and Blinken) weren’t relying on the Russian Ruble staying pulverized, because the Ruble (relative to King Dollar) has regained all its losses.
On the other hand, the Japanese Yen and Chinese Yuan have crashed harder than Biden’s popularity.
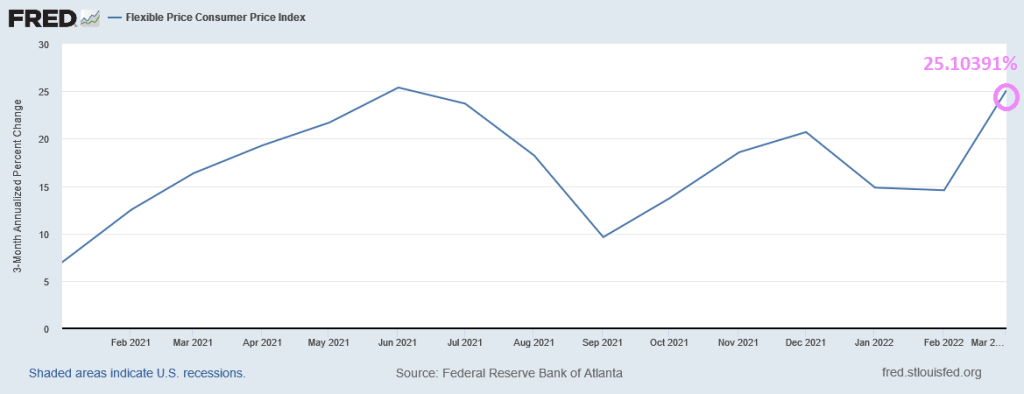
Actually, The Atlanta Fed’s flexible price inflation rate is 25%, up from 3.90% Pre-Joe.
Perhaps Biden, Harris and Blinken think Putin is a pasta sauce.
Today, the US Treasury 10-year yield exploded upwards by over 12 basis points. With it, the 30-year mortgage yield is above 5%. And MBA Mortgage Purchase Applications are actually increasing.
The 10-year Treasury term premium, the amount by which the yield on a long-term bond is greater than the yield on shorter-term bonds, remains steeply negative (white line) as The Federal Reserve steps up its attack (aka, monetary tightening). Meanwhile, the 10Y-2Y curve actually rose into positive territory.
Historically, the 10-year Treasury Term Premium declines before a recession.
Meanwhile, 3 month Treasury bill to Overnight Indexed Swaps spread is crashing to the lowest level since 2017.
But with inflation raging at the fastest pace in 40 years, the REAL 10-year Treasury yield remains negative at -5.236% while the REAL 30-year mortgage rate is -3.01%. Both were in positive territory when Biden was installed as President.
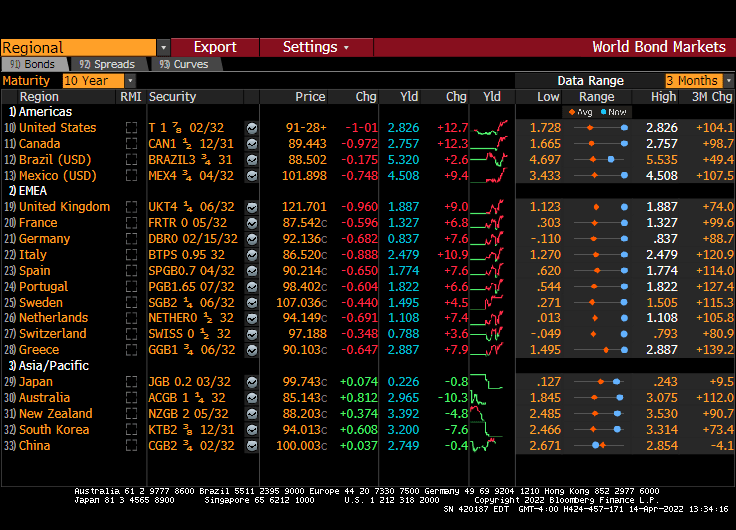
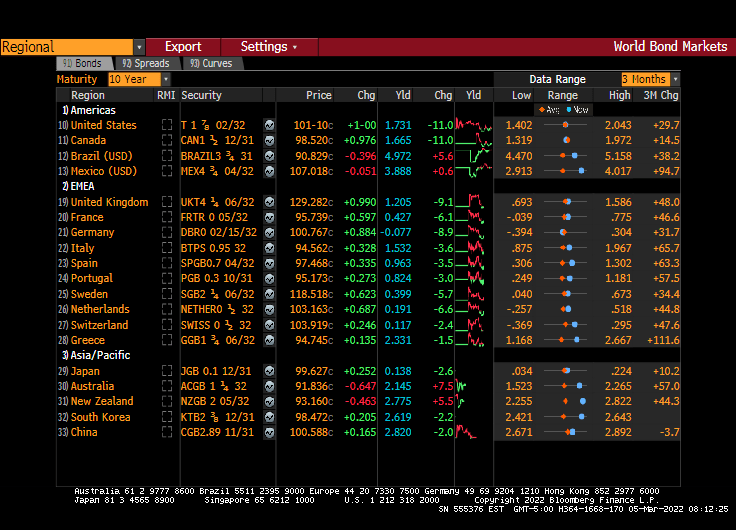
Speaking of interest rates, the infamous PIGS (Portugal, Italy, Greece, Spain) are all seeing surges in their 10-year sovereign yields. Sweden, while not a PIG has the largest spike today at 13.8 BPS.
Actually, the biggest spike in sovereign yields occurred in Ukraine where their 2-year yield popped +205.8 BPS. But Lebanon has the highest 2-year yield at 162.29%. Turkey is in third place in the sovereign demolition derby at 23.52%. Sadly, Poland’s 2-year yield is up 16 bps today.
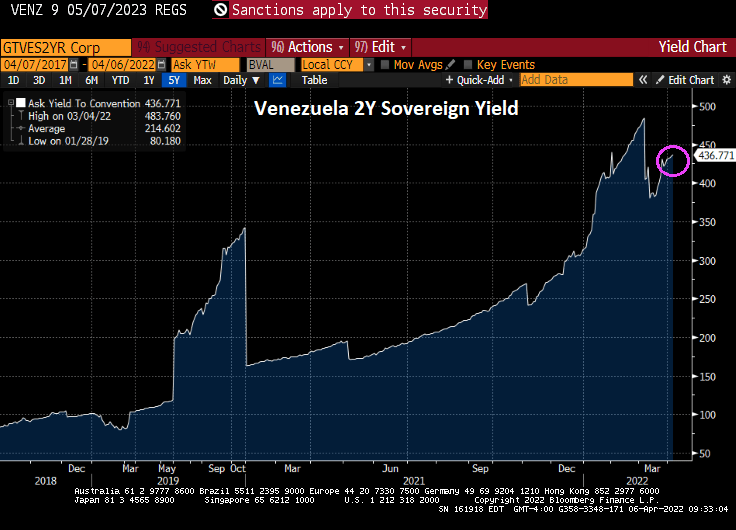
But the winner of the sovereign debt demolition derby is …. drumroll … VENEZUELA! At 436.77%.
I am really surprised that Biden hasn’t adopted Maduro’s fashion sense.
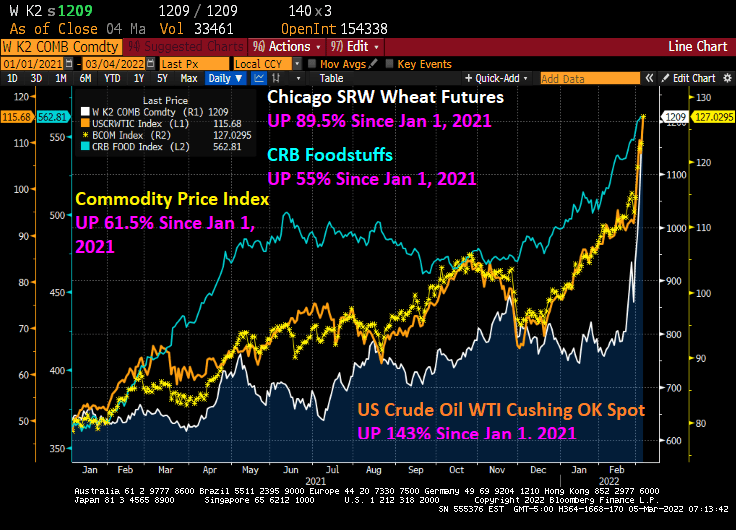
This has been a brutal week for consumers. With the Russia/Ukraine conflict raging and Congress seems determined to not allow for additional oil and gas production, and Biden’s anti-fossil fuel edicts still in place, we are seeing dramatic price increases in wheat (UP 89.5% since January 1, 2021), WTI Crude (UP 143% since January 1, 2021), and food stuffs (UP 55% since January 1, 2021).
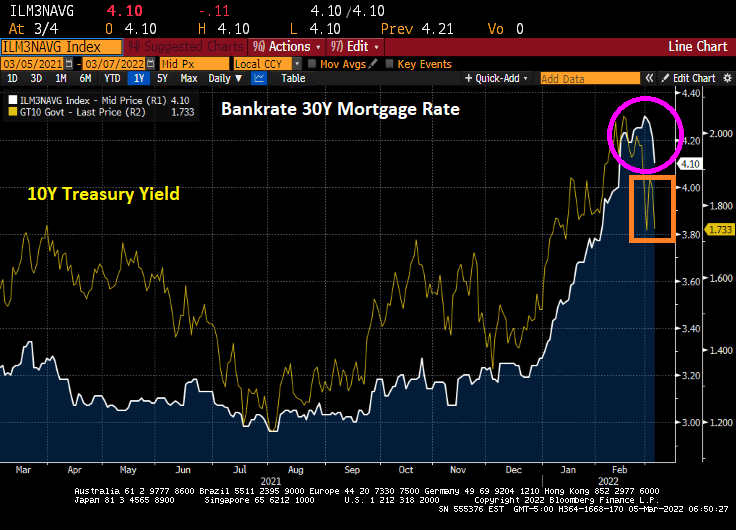
Bankrate’s 30-year mortgage rate has actually been falling the last several days, which is good for prospective home buyers as the 10-year US Treasury Note yield has been declining.
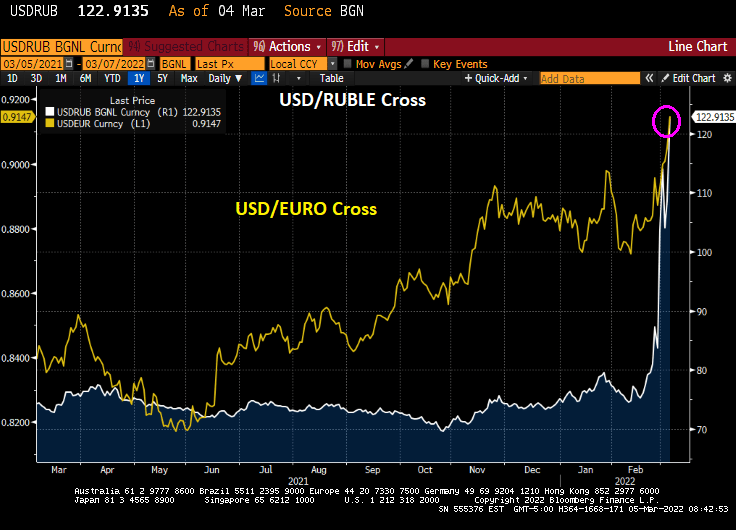
The USD/Russian Ruble cross is skyrocketing and the USD/Euro is doing likewise. Russians visiting the US will find that their trip is suddenly unaffordable (as do many American citizens will its rampant inflation). As Bruce Willis said in “Die Hard,” “Welcome to the party, pal.”
On Friday, the US Treasury 10-year yield declined 11 bps.
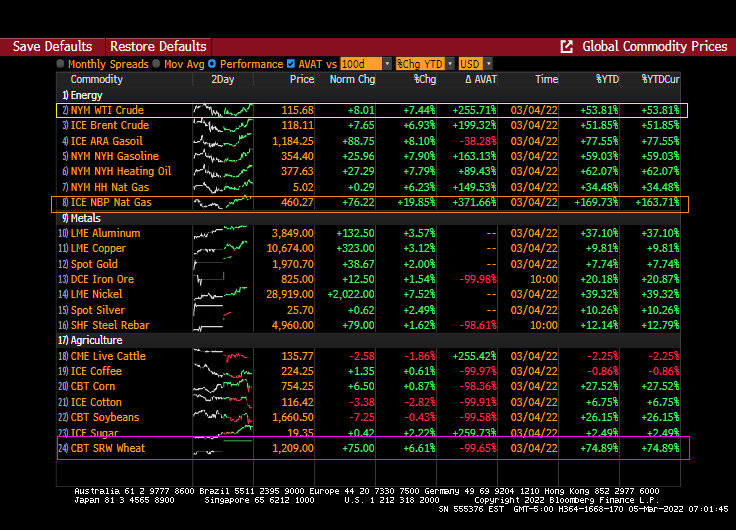
And energy prices continue to soar, particularly UK Natural Gas Futures that rose 19.85% overnight.
The US inflation data will be released on March 10th and the consensus is that February CPI inflation will rise to 7.9% YoY.
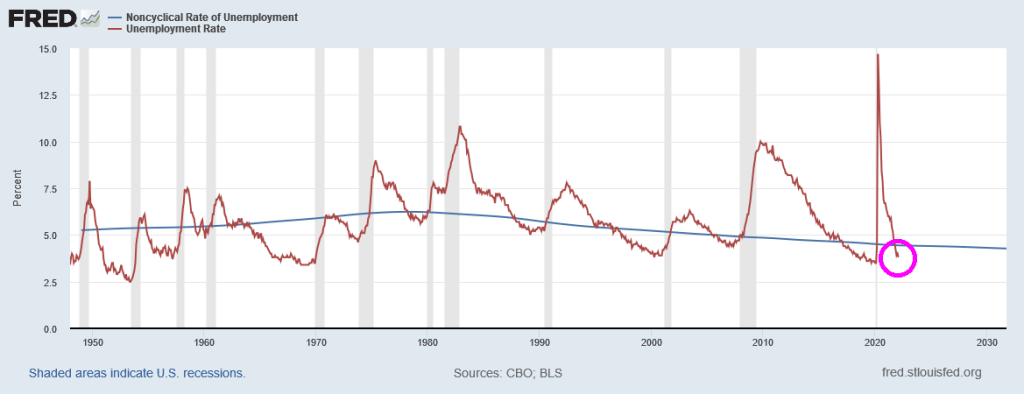
But even the latest unemployment rate report (3.8%) is signalling that The Fed should be raising interest rates since it is lower than the Natural Rate of Unemployment or NAIRU (4.44%).
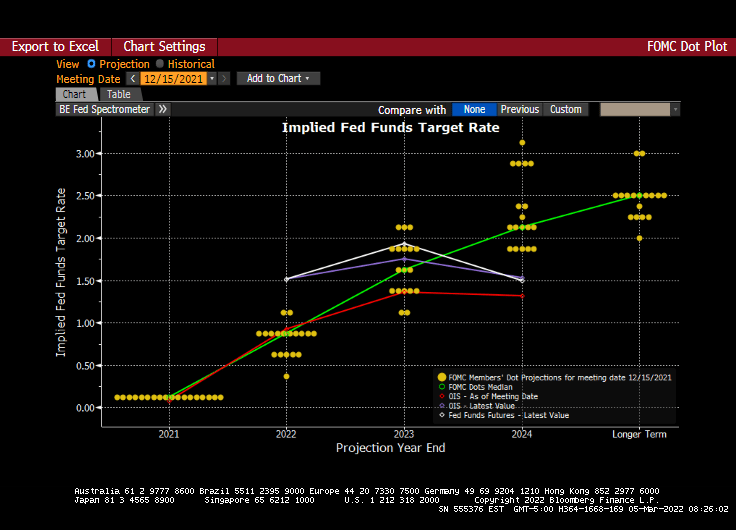
And we have the next Fed policy error on March 16th. The Fed dots plot looks like the glide slope for an aircraft, but the message is that rates will be going up at future meetings.
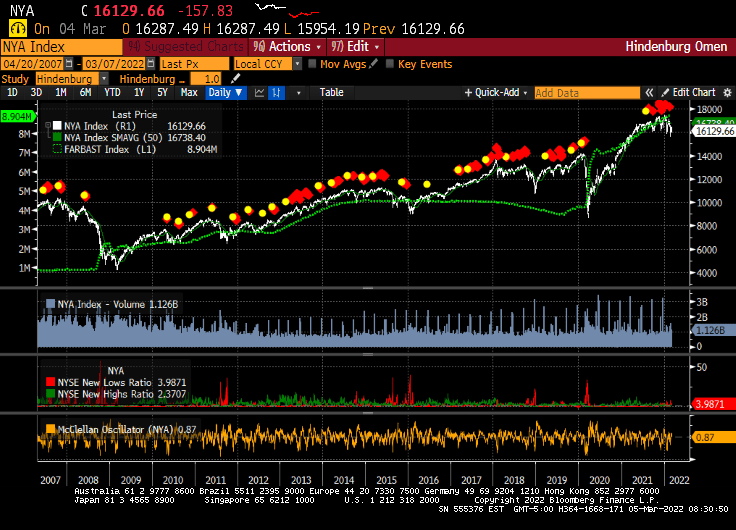
And just for amusement, I present to you the infamous Hindenburg Omen chart that forecast the 2008/2009 stock market correction. Since that correction, the Hindenburg Omen has been flashing “danger” but the only correction was the COVID-linked correction of early 2020. While the Hindenburg Omen is flashing red right now, The Federal Reserve’s balance sheet (green line) has protected against market corrections. Let’s see what happens if and when The Fed decides to remove the epic monetary stimulus.
Its anyone’s guess as to whether The Fed will actually tighten monetary policy.


You must be logged in to post a comment.