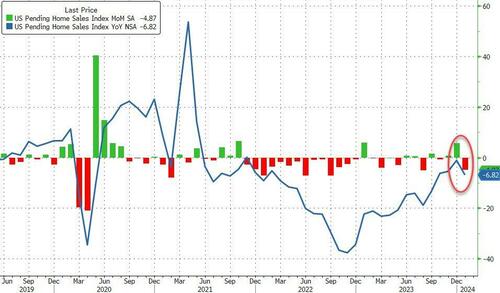
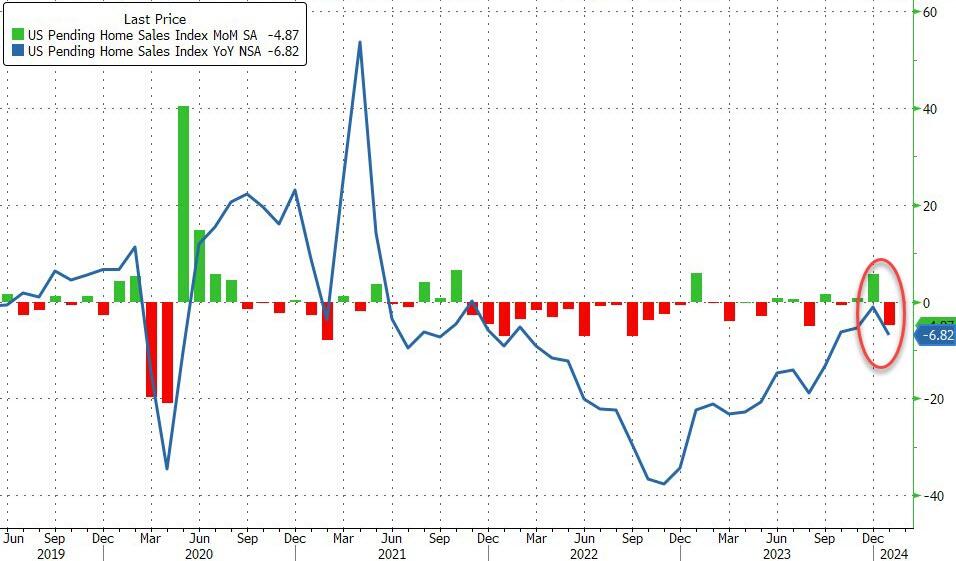
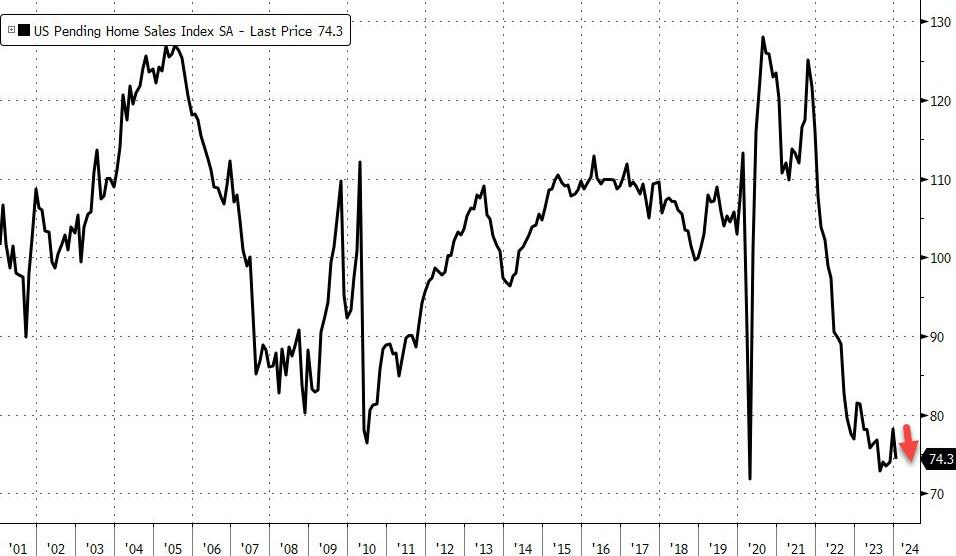
Pending home sales puked in January, tumbling 4.9% MoM (vs +1.5% MoM exp). This was made worse by a large downward revision for December (from +8.3% MoM to +5.7% MoM)…
Source: Bloomberg
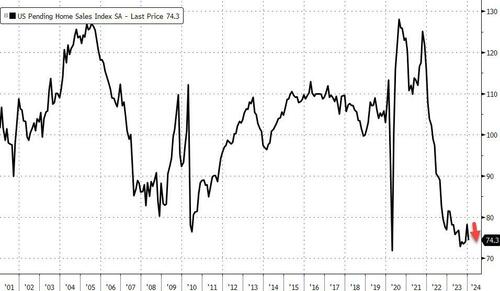
That was the biggest MoM decline since August and dragged the YoY sales decline to -6.82%, tumbling back near record lows…
Source: Bloomberg
Realtors gonna realtor…
“This combination of economic conditions is favorable for home buying,” Lawrence Yun, NAR’s chief economist, said in a statement.
“However, consumers are showing extra sensitivity to changes in mortgage rates in the current cycle, and that’s impacting home sales.”
WTF are you talking about Larry?
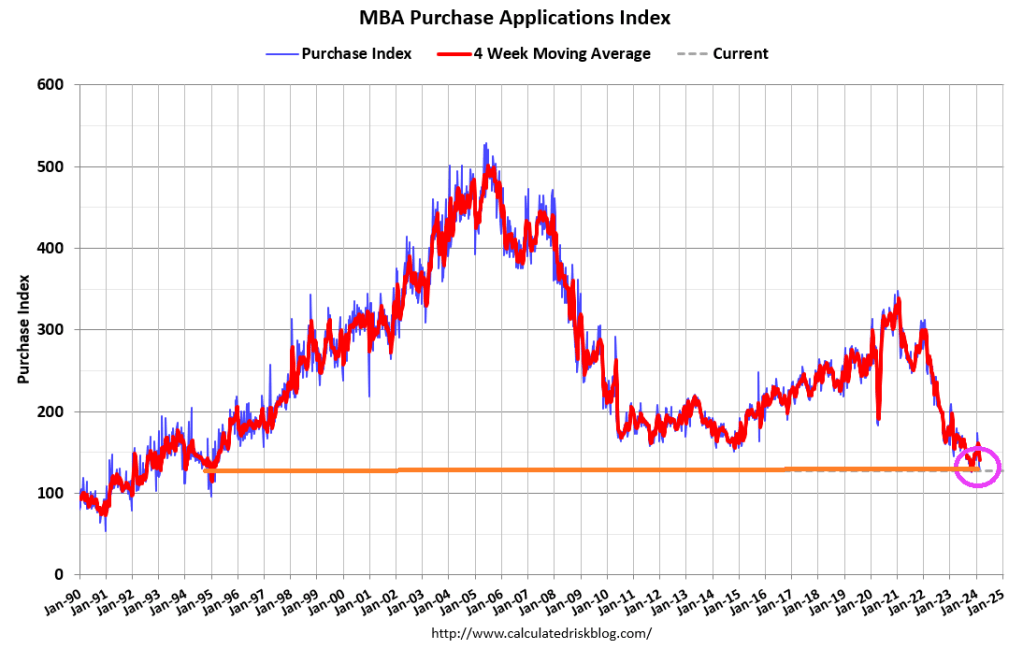
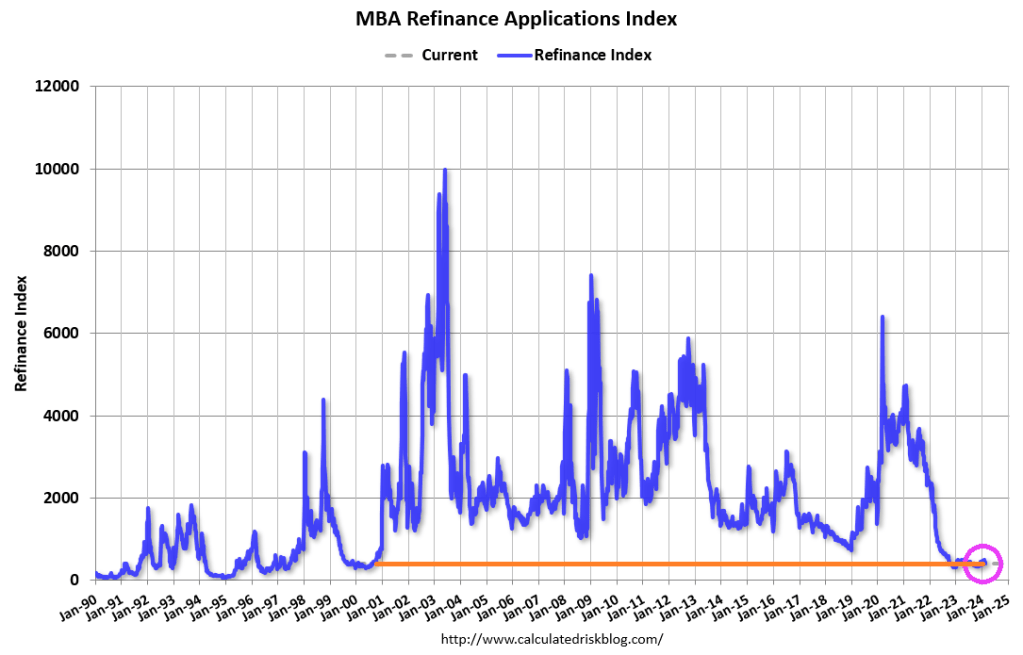
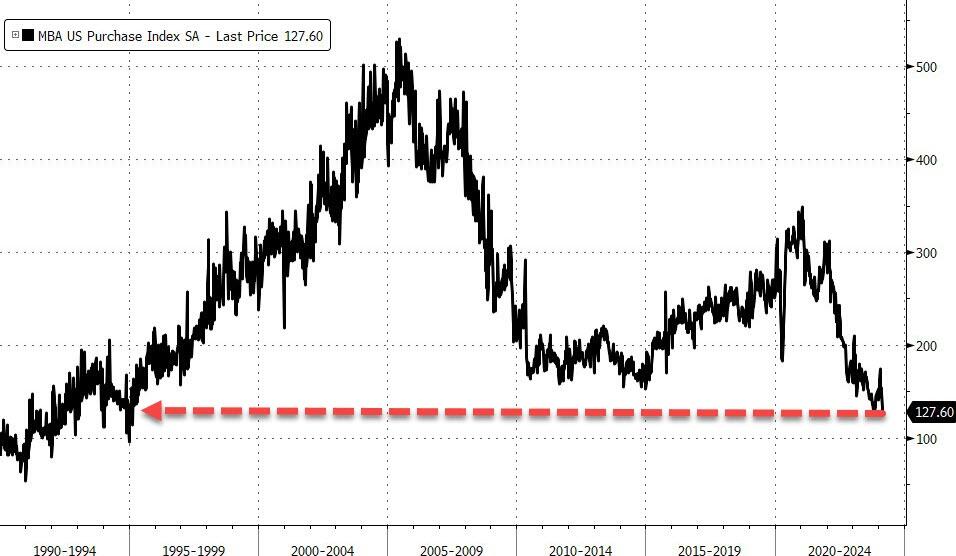
Earlier this week, a gauge of US mortgage applications for home purchases fell for a fifth week, nearing its lowest level since 1995.
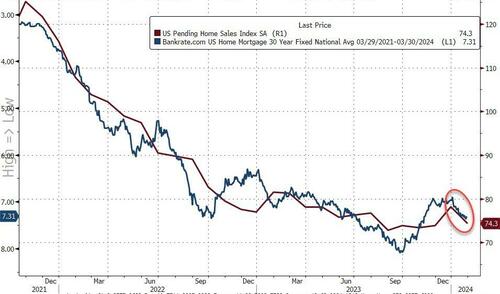
Who could have seen that coming? As rates surged once again…
Source: Bloomberg
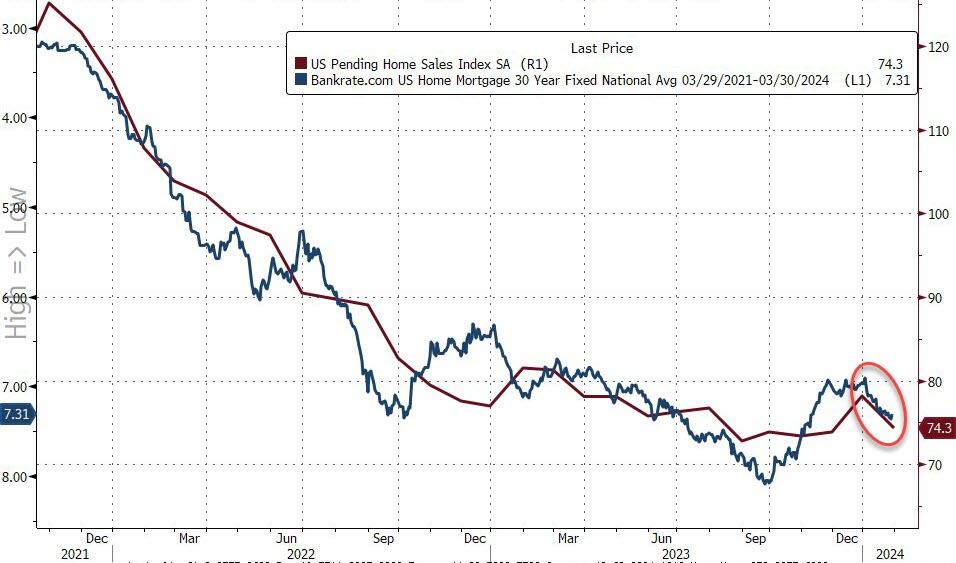
The pending-home sales report is a leading indicator of existing-home sales given houses typically go under contract a month or two before they’re sold.
The index of contract signings decreased 7.3% in the South, the nation’s biggest housing market.
Pending sales also fell 7.6% in the Midwest, but climbed 0.8% in the Northeast and 0.5% in the West.
“Southern states and those in the Rocky Mountain time zone experienced faster job growth compared to the rest of the country,” Yun said.
“As a result, long-term housing demand is increasing more significantly in these regions. However, the timing and number of purchases will largely depend on the prevailing mortgage rates and inventory availability.”
Overall sales are expected to increase 13% this year, according to NAR’s economic outlook, but as the chart above shows, unless rates start tumbling soon, that ain’t gonna happen.
Mortgage applications decreased 5.6 percent from one week earlier, according to data from the Mortgage Bankers Association’s (MBA) Weekly Mortgage Applications Survey for the week ending February 23, 2024.
The Market Composite Index, a measure of mortgage loan application volume, decreased 5.6 percent on a seasonally adjusted basis from one week earlier. On an unadjusted basis, the Index decreased 3 percent compared with the previous week. The seasonally adjusted Purchase Index decreased 5 percent from one week earlier. The unadjusted Purchase Index decreased 1 percent compared with the previous week and was12 percent lower than the same week one year ago.
The Refinance Index decreased 7 percent from the previous week and was 1 percent lower than the same week one year ago.
The average contract interest rate for 30-year fixed-rate mortgages with conforming loan balances ($766,550 or less) decreased to 7.04 percent from 7.06 percent, with points increasing to 0.67 from 0.66 (including the origination fee) for 80 percent loan-to-value ratio (LTV) loans.
Confidence! It’s what consumers DON’T have under Bidenomics.
For the fourth straight month, The Conference Board revised its consumer confidence data significantly lower. In fact January’s was the biggest downward revision since Feb 2022. And Conference Board Consumer Confidence was DOWN to -3.90 in January, the worst since Feb 2022.
It really isn’t surprising the consumer confidence stinks. Food prices (CPI) are UP 21% under Vacation Joe Biden. Diesel fuel prices are UP 90% under Listless Joe.
Well, Biden’s appearance on (unfunny) Seth Myer’s Late Night Show certainly didn’t make me feel more confident about America’s future.
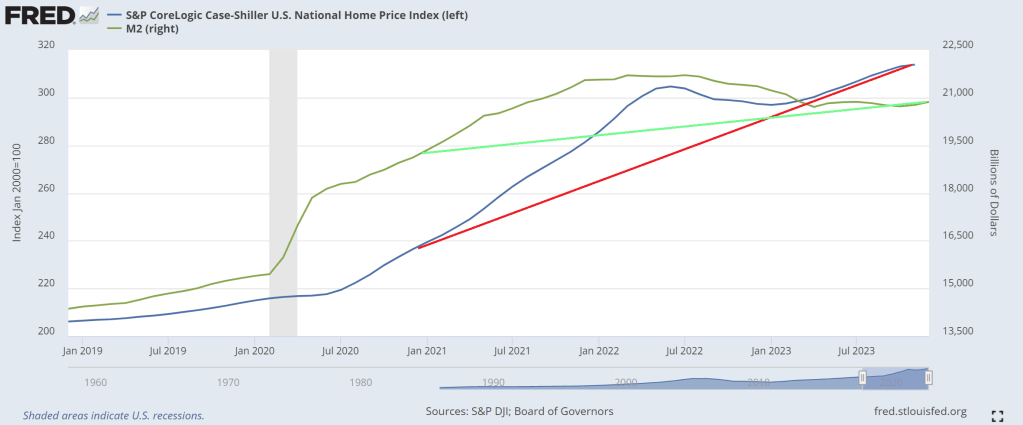
The Fed’s love potion #9: Printing endless supplies of money. But it still isn’t creating a large enough growth in new homes. The Fed’s money printing has helped drive housing prices up 32.7% under Biden, making housing unaffordable for millions of households.
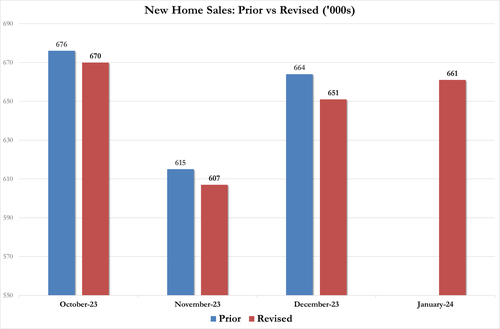
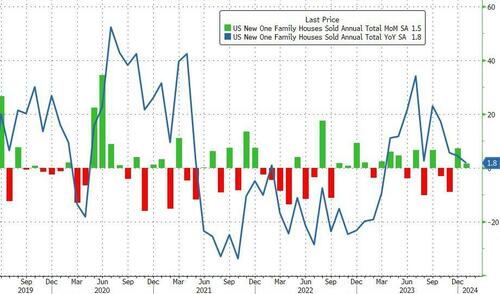
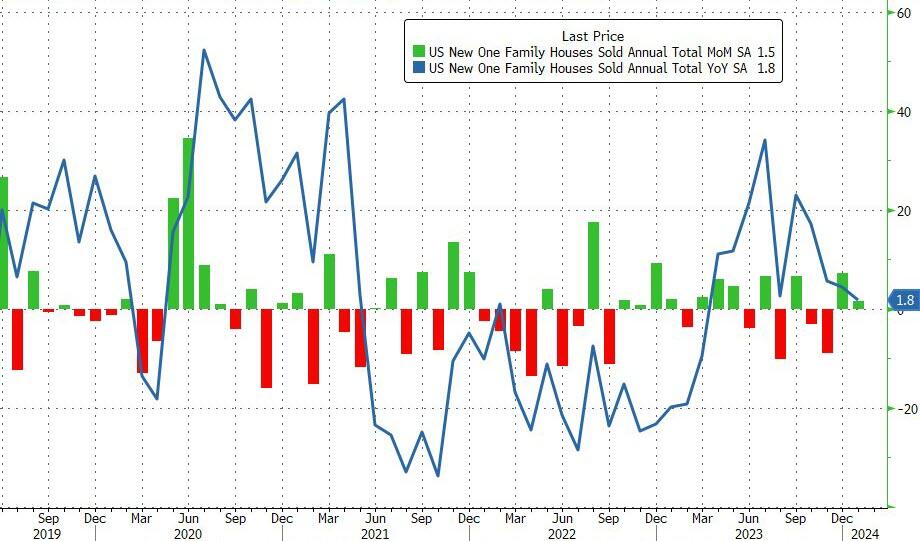
After December’s 8.0% surprise jump was revised down to +7.2% MoM, January sales rose just 1.5% MoM (half the 3.0% expected). In fact all three of the last months’ data was revised lower…
The downward revision and disappointment reduced the YoY sales growth to just 1.8%…
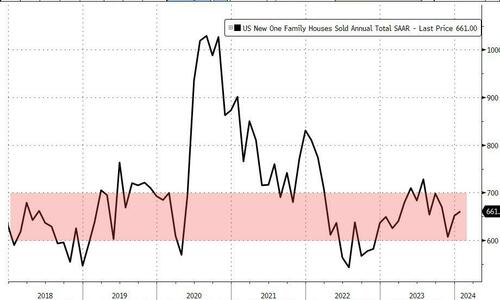
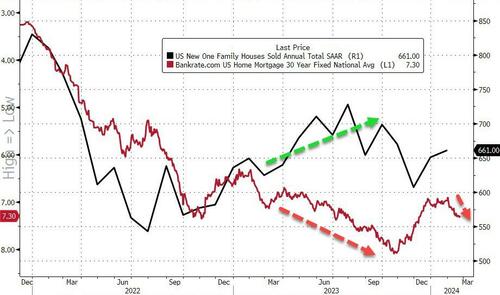
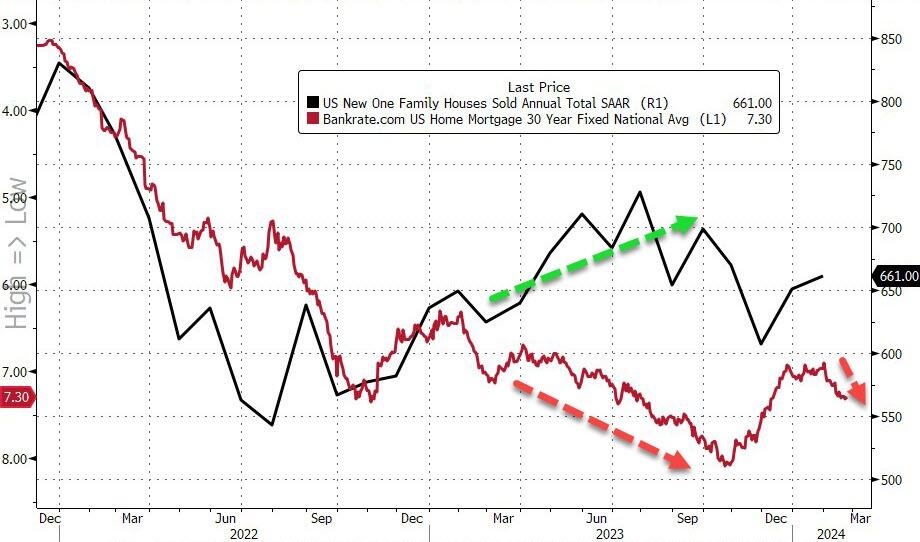
The total new home sales SAAR rose from a downwardly revised 651k to 661k in January (well below the 684k expected)…
Source: Bloomberg
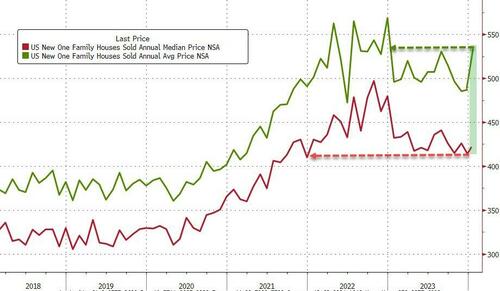
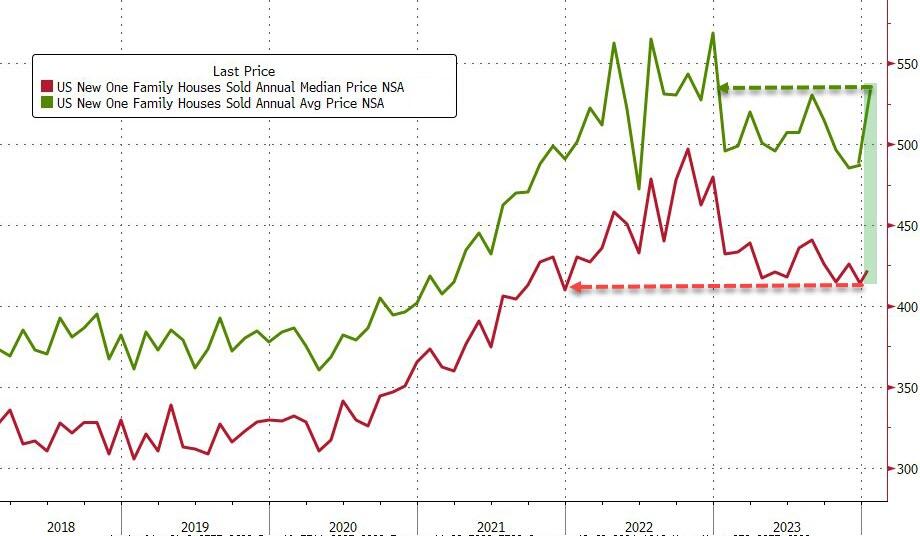
The median sales price of a home decreased to $420,700 in January from a year ago, marking the fifth-straight decline (up marginally from the $413,000 in December which was two year low).
Interestingly, the average price (NSA) soared from $493.4k to $534.3k)… which signals more higher-priced homes selling…
Source: Bloomberg
Mortgage rates are back on the rise, not exactly a good sign for new home sales as homebuilders margins collapse…
Source: Bloomberg
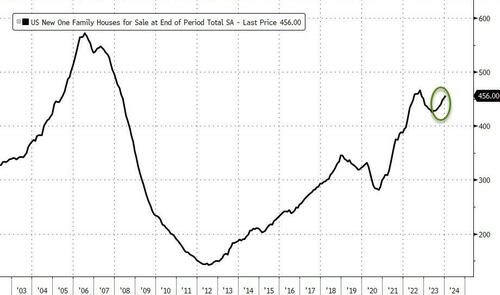
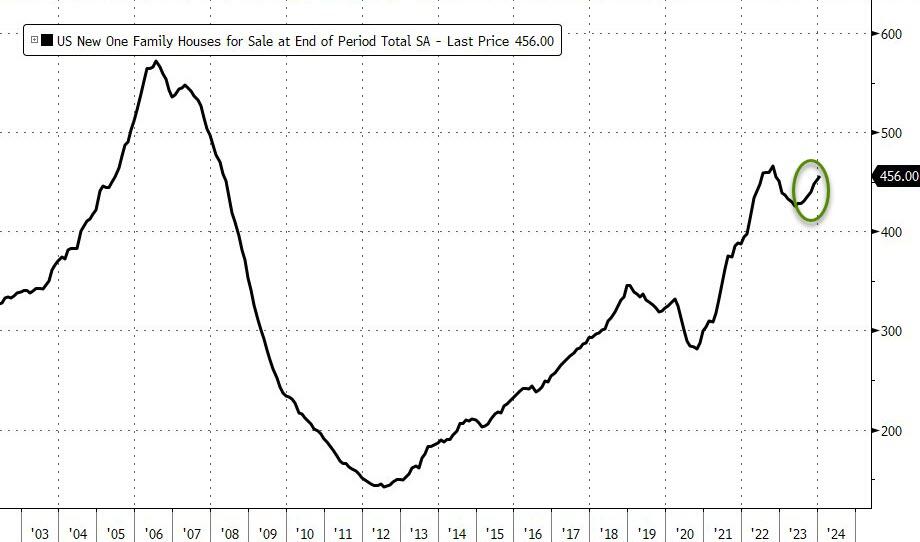
Finally, new-home supply increased to 456,000 from the prior month, the most in over a year.
Source: Bloomberg
Is reality about to set in for the US housing market? Or will Powell step in (with a banking crisis excuse) to save all that ‘wealth’?
…
Source: Bloomberg
The total new home sales SAAR rose from a downwardly revised 651k to 661k in January (well below the 684k expected)…
Source: Bloomberg
The median sales price of a home decreased to $420,700 in January from a year ago, marking the fifth-straight decline (up marginally from the $413,000 in December which was two year low).
Interestingly, the average price (NSA) soared from $493.4k to $534.3k)… which signals more higher-priced homes selling…
Source: Bloomberg
Mortgage rates are back on the rise, not exactly a good sign for new home sales as homebuilders margins collapse…
Source: Bloomberg
Finally, new-home supply increased to 456,000 from the prior month, the most in over a year.
Source: Bloomberg
Is reality about to set in for the US housing market? Or will Powell step in (with a banking crisis excuse) to save all that ‘wealth’?
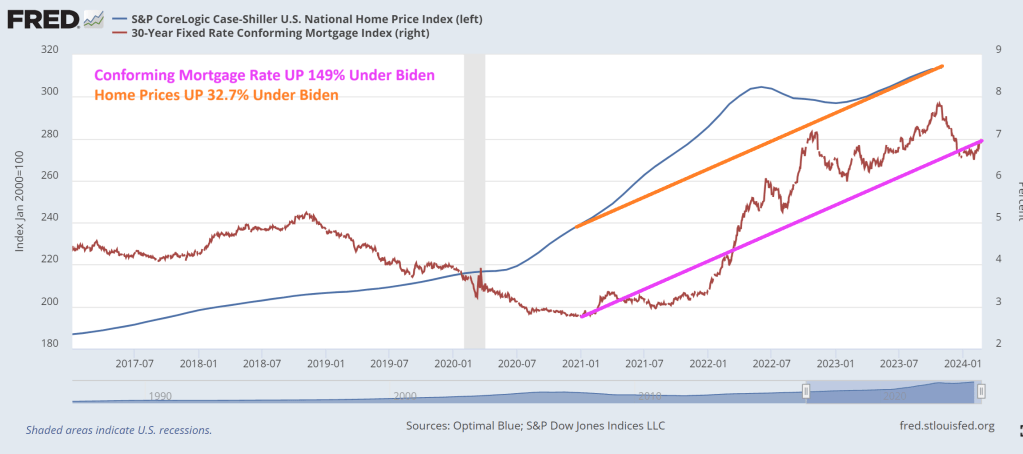
Of course, mortgage rates rising 149% under Biden might have something to do with it.
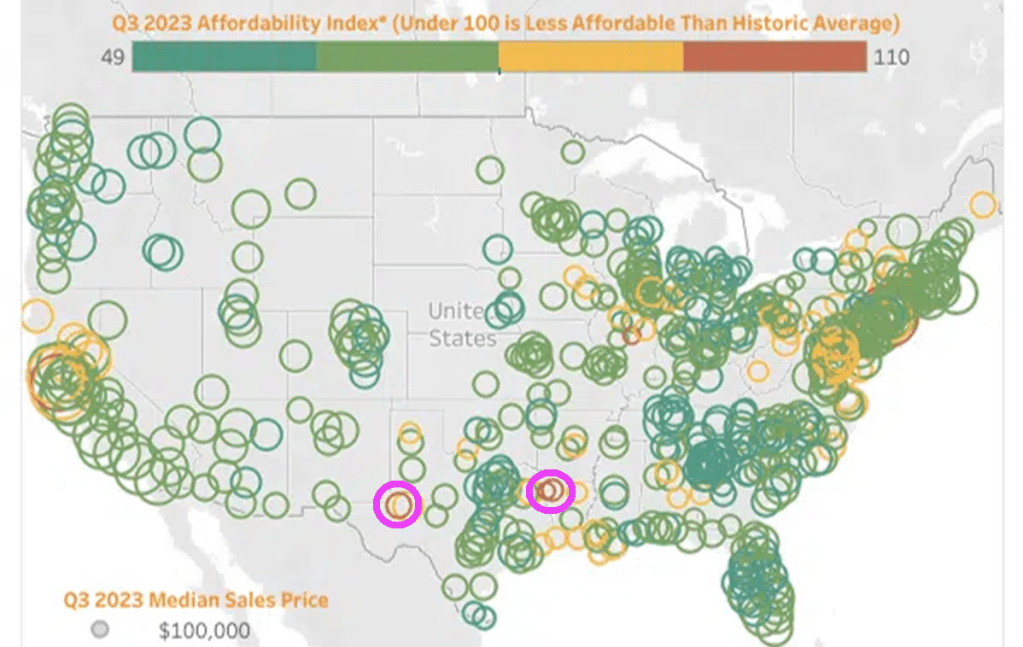
Although the Attom data is from Q3 2023, not much has changed. Under Biden (and his HUD Secretary Marcia Fudge, Fed Chair Jay Powell, and Treasury Secretary Janet Yellen), I did manage to find TWO AFFORDABLE areas to live: Shreveport Louisiana and Midland/Odessa Texas. The housing market remains unaffordable for millions of Americans.
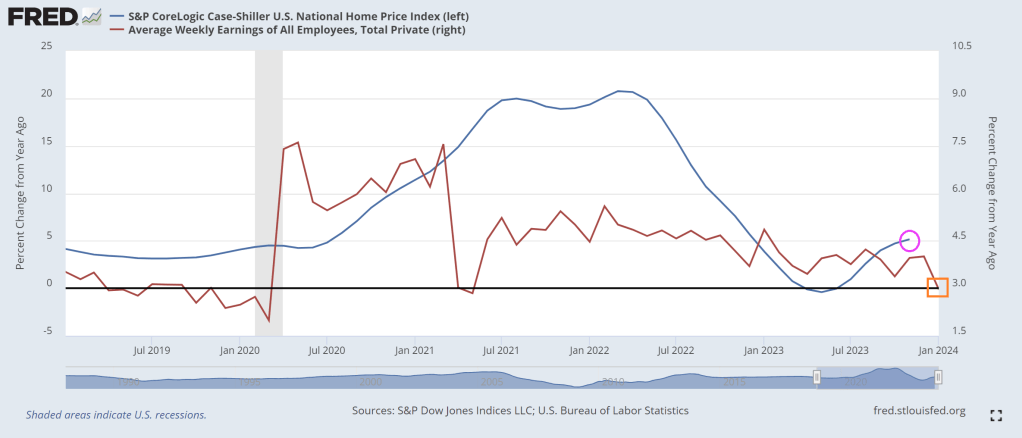
I am not surprised given that the Case-Shiller National home price index has risen by 32.7% under Biden while mortgage rates are up … 149%.
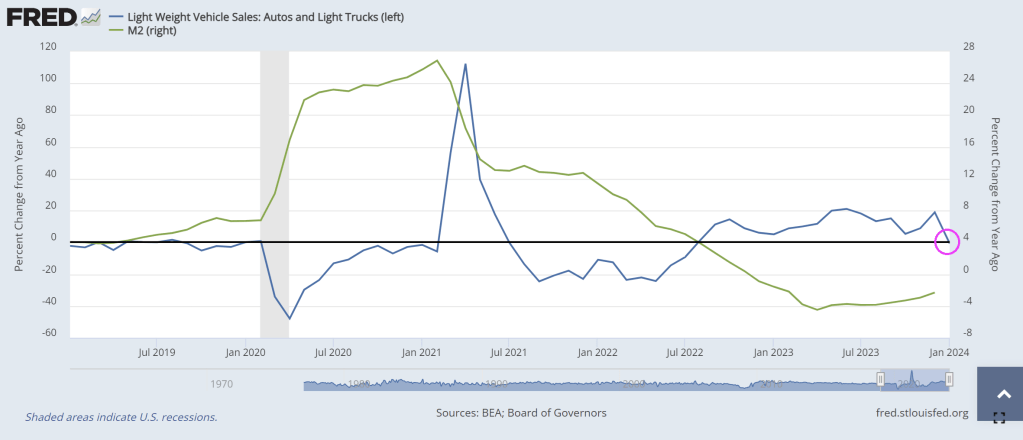
Cars and light trucks are seeing declining YoY sales in January (-0.7%) as M2 Money growth remains negative.
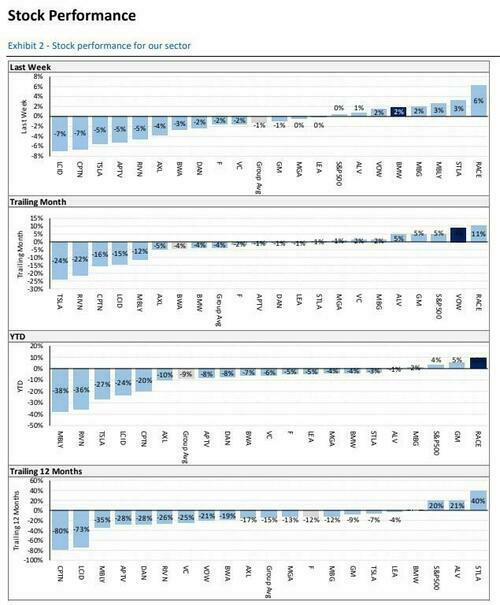
Automotive News was the first to report Ford Motor Co. halted shipments of all 2024 F-150 Lightning electric pickup trucks for an undisclosed quality control issue just weeks after slashing production volumes for the EV model due to sliding demand.
“We expect to ramp up shipments in the coming weeks as we complete thorough launch quality checks to ensure these new F-150s meet our high standards and delight customers,” company spokeswoman Emma Bergg wrote in a statement.
Last month, Ford announced plans to slash the Lightning production in April “to achieve the optimal balance of production, sales growth and profitability.”
The automaker (and many others, like Mercedes Benz) is recalibrating its electric vehicle strategy as the Biden administration plans to downshift the EV transition as demand plummets.
Thousands of auto dealers nationwide recently warned the ‘climate change warriors’ in the White House: the 2030 EV push is backfiring.
“Currently, there are many excellent battery electric vehicles available for consumers to purchase. These vehicles are ideal for many people, and we believe their appeal will grow over time. The reality, however, is that electric vehicle demand today is not keeping up with the large influx of BEVs arriving at our dealerships prompted by the current regulations. BEVs are stacking up on our lots,” the dealers said.
They warned: “Already, electric vehicles are stacking up on our lots which is our best indicator of customer demand in the marketplace.”
“Key takeaways thus far from earnings season are that the EV slowdown is not showing any evidence of an inflection, Level 4 autonomy headwinds continue to persist, and fears over supplier inventory overbuild are likely overblown.
The Hollies said it best: Stop, stop, stop. FIAT Money Printing that is.
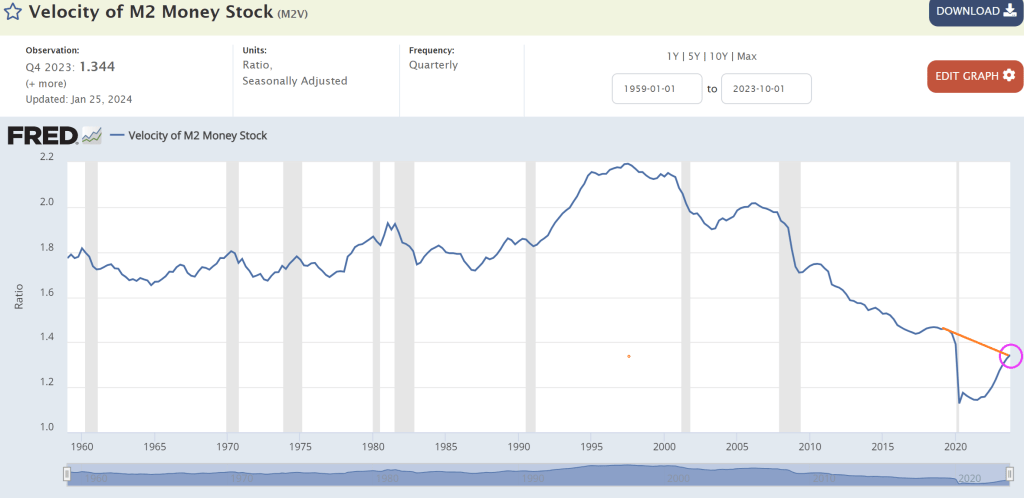
Typically, we look at M2 Money Velocity (GDP/M2) as a measure of how much the economy grows by expanding the money supply.
M2 Money Velocity is currently at 1.344, and still below where we were under Trump prior to Covid. After Powell printing palooza after Covid, M2 Money Velocity collapsed and is slowly rising, but remains low by historic standards.
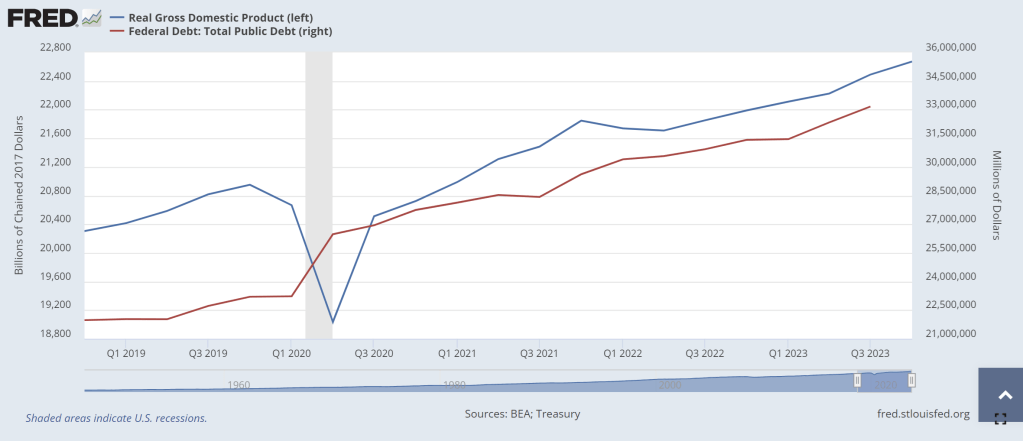
Perhaps a more interest velocity is DEBT velocity (GDP/DEBT). Under Biden’s Reign of Error, Federal debt has increased by $6,539,359 million while real GDP has increased by only $1,948.731 billion (or roughly $2 trillion in GDP growth after $6.54 trillion in debt). Or a DEBT velocity of 0.3. Yikes! No wonder China is bailing on US debt!
This chart makes debt issuance look better than it really is. Again, the DEBT VELOCITY of 0.3 is terrible meaning that for every $1 of Federal debt, we get 30 cents in Real GDP under Biden. One of my macroeconomics textbooks stated that debt growth is fine as long as real GDP growth rises faster than debt growth. Apparently, Treasury Secretary Janet Yellen didn’t read that textbook! Real GDP has grown by 9.43% under Biden while Federal debt has grown by … gulp .. 24%.
Yes, the US is borrowing like the proverbial drunken sailor while they “invest” in green energy, wars in Ukraine and the Middle East, and massive social welfare programs (like the old breads and circuses from the dying Roman Empire). When watching the media’s obsession with Taylor Swift and Chief’s Tight End Travis Kelce at The Super Bowl, it reminded me of “Breads and Circuses” as our nation is collapsing like a dying star. (That is why I Iike Gold, Silver and Bitcoin!)
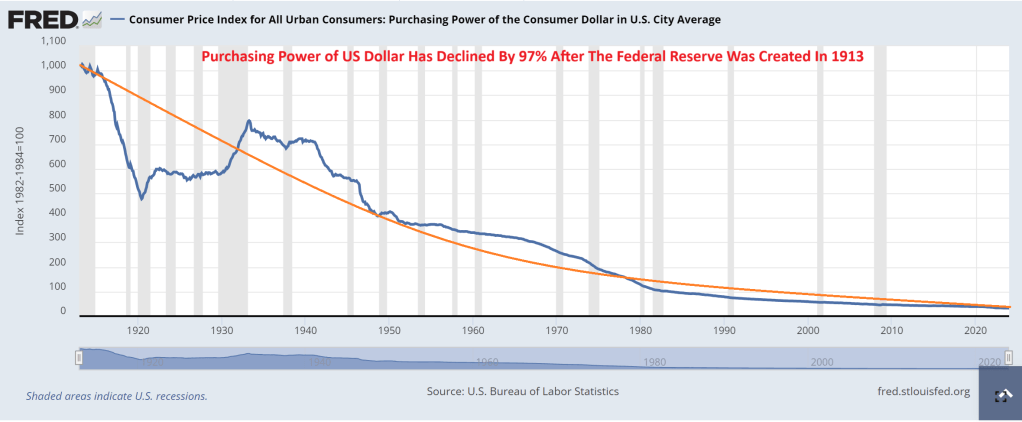
What about The Federal Reserve? It was created in 1913 after signed into existence by President Woodrow Wilson. Since The Fed’s inception, consumer purchasing power has declined by 97%.
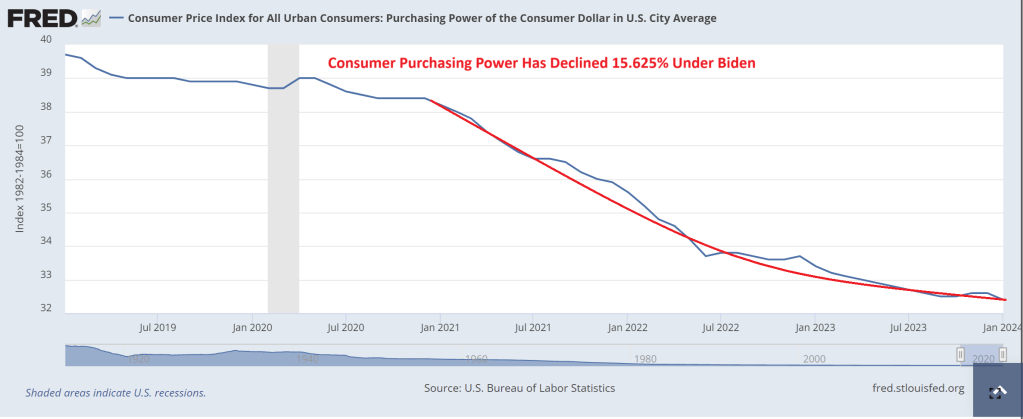
And under Biden, inflation has been so bad that consumer purchasing power is down 16%.
In summary, The Federal Reserve has been printing like crazy (I would say Batshit Crazy, but I actually think bats are adorable). And Treasury (under former Fed Chair Janet Yellen) has been borrowing like crazy too. While politicians claim the economy is in great shape, it is really because The Fed is printing wildly, Yellen is borrowing wildly, and much of US GDP is not due to the private sector, but Federal government spending … to the donor class. This is NOT a sustainable and will eventually crash into a ravine.
Silence is not golden. Particularly when it comes to a silent DEPRESSION. Talking is cheap, people follow like sheep. Particularly when are told by Biden, Press Secretary Karine Jean-Pierre and NY Times economic spinster Paul Krugman say its the best economy in decades. It isn’t. In fact, the US is in a silent depression.
Typically, a recession is defined as two consecutive quarters of negative GDP growth. If we use 2 consecutive quarter of negative GDP growth, we are not in a recession. But ….
Why these results? Bidenomics is based on costly Keynesian boom-and-bust policies. With so much whiplash, it’s no wonder people are conflicted about the economy.
In the latest jobs report for January, a net increase of 353,000 nonfarm jobs from the establishment survey appears robust, as it was well above the consensus estimate of 185,000 new jobs. But let’s dig deeper.
Last month, household employment declined by 31,000, contradicting the headlines. The divergence of jobs added between the household survey and the establishment survey has widened since March 2022. This period coincides with declining real gross domestic product in the first and second quarters of 2022 (usually that’s deemed a recession, but it hasn’t been yet). Indexing these two employment levels to 100 in January 2021, they were essentially the same until March 2022, but nonfarm employment was 2.5 percent higher in January 2024.
While this divergence mystifies some, a primary reason is how the surveys are conducted.
The establishment survey reports the answers from businesses and the household survey from individual citizens. The establishment survey often counts the same person working in multiple jobs, while the household survey counts each person employed. This likely explains much of the divergence, as many people work multiple jobs to make ends meet. The surge in part-time employment and more discouraged workers underscores
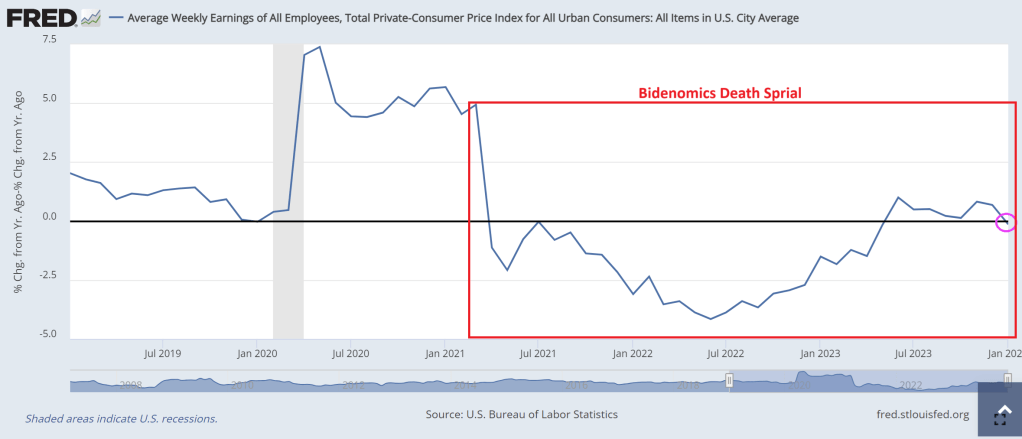
Though average weekly earnings increased by 3 percent in January over a year prior, this is below inflation of 3.1 percent. Real average weekly earnings had increased for seven months before falling last month. And there had been declines in year-over-year average weekly earnings for 24 of the prior 25 months before June 2023. These real wages are down 4.4 percent since Biden took office in January 2021.
As purchasing power declines, mounting debts become more urgent.
Total US household debt has reached unprecedented levels, with credit card debt soaring by 14.5 percent over the last year to a staggering $1.13 trillion in the fourth quarter of 2023. Such substantial growth in debt raises concerns about the current (unsustainable?) consumption trends, business investment, and a looming financial crisis.
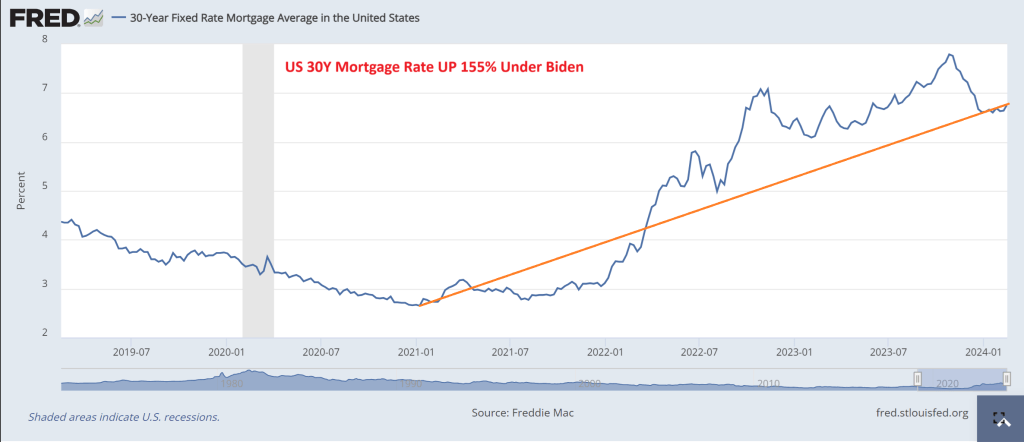
The surge in mortgage rates to over seven percent for the first time since December and rising home prices exacerbate housing affordability challenges, particularly for aspiring homeowners. An integral component of what some consider the “American Dream,” housing affordability is a major factor discouraging Americans. Remember, Bidenomics has seen a 155% increase in mortgage rates.
The euphoria surrounding the January 2024 jobs report is misplaced. Policymakers should heed these warning signs and enact meaningful reforms to address root causes.
Biden’s policy approach undergirds most of these difficulties. Bidenomics focuses on his Build Back Better agenda that picks winners and losers by redistributing taxpayer money for supposed economic gains through large deficit spending (and most of the gains went to political donors).
We haven’t seen an agenda of this magnitude since LBJ’s Great Society in the 1960s or possibly since FDR’s New Deal in the 1930s. Both were damaging, as the Great Society dramatically expanded the size and scope of government, contributing to the Great Inflation in the 1970s, and the New Deal contributed to a longer and harsher Great Depression.
These four bills will add nearly $4.3 trillion to the national debt. But at least another $2.5 trillion will be added to the national debt for student loan forgiveness schemes, SNAP expansions, net interest increases, Ukraine funding, PACT Act, and more. In total over the past three years, excessive spending will lead to more than $7 trillion added to the national debt, which now totals $34 trillion — a 21 percent increase since 2021. There seems to be no end to soaring debt with the recent discussions of more taxpayer money to Ukraine, Israel, the border, and the “bipartisan tax deal,” collectively adding at least another $700 billion to the debt over a decade.
Record debts accrued by households and by the federal government (paid by households) are not signs of a robust economy. This will likely worsen before it improves, as household savings dry up. And with interest rates likely to stay higher for longer because of persistent inflation, debts will crowd out household finances and the federal budget.
The Federal Reserve has monetized much of this increased national debt over the last few years by ballooning its balance sheet from $4 trillion to $9 trillion and back down to a still-bloated $7.6 trillion. This helps explain persistent inflation, massive misallocation of resources, and costly malinvestments across the economy, keeping the economy afloat yet fragile.
Excessive deficit spending weighs heavily on future generations, saddling them with unsustainable debt levels they have no voice in. Today, everyone owes about $100,000, and taxpayers owe $165,000, toward the national debt. Of course, these amounts don’t include the hundreds of trillions of dollars in unfunded liabilities for the quickly-going-bankruptwelfare programs of Social Security and Medicare.
Future generations will be on the hook for even more national debt if Bidenomics continues and Congress doesn’t reduce government spending now. This is why the national debt is the biggest national crisis for America. We’re robbing current and future generations of their hopes and dreams.
Fortunately, there’s a better path forward if politicians have the willpower. This path should be chosen before we reap the major costs of a bigger crisis. Look at Argentina’s president Javier Milei who managed to balance the budget in 60 days and generate a whopping SURPLUS of $589,000,000. How? By cutting massive government waste and closing agencies and programs.
In short, we need a fiscal rule of a spending limit covering the entire budget based on a maximum rate of population growth plus inflation. There should also be a monetary rule that ideally reduces and caps the Fed’s current balance sheet to at least where it was before the lockdowns. My work with Americans for Tax Reform shows that had the federal government used this spending limit over the last 20 years, the debt would have increased by just $700 billion instead of the actual $20.2 trillion. That’s much more manageable and would point us in a more sustainable fiscal and monetary direction.
Together, fiscal and monetary rules that rein in government will help reduce the roles that politicians and bureaucrats have in our lives so we can achieve our unique American dreams. If not, we will have wasted many dreams on Bidenomics that can make things look good on the surface, but cause rot underneath.
Clarification: When Biden and various members of Congress tout Biden as having created more jobs that previous Presidents, that is the ultimate gaslighting of the American people. Trump actually saw more job creation than Biden until Covid struck and politicians shut down the economy (and schools closed). Then like magic, after Biden was elected, many jobs returned. Biden and his lackies take credit for the incredible job market, but NEW jobs (rather than simply old jobs returning) had nothing to do with Biden’s Keynesian policies. Rather, Biden’s policies have helped destroy the jobs market.
And yes, the US is under invasion by the United Nations who are helping millions of migrants ILLEGALLY cross the US border, creating horrible stress on the economy and helping keep inflation high. Not to mention soaring crime. Its as if Biden (and his master Obama) are using the Cloward-Piven strategy of overwhelming the economy so it breaks.
All we hear about from Biden and Schumer (and their ilk) is about spending billions MORE on Ukraine and their oligarchs to “protect their borders” while Biden and Mayorkas (Cuba Pete) leave American borders over to invasion.
Yes, Democrats like The Clintons, Obamas and Bidens LOVE the Cloward-Piven strategy. Hey, they are all multi-millionaires and are insulated from all the damage they inflict on the middle class and low wage workers.
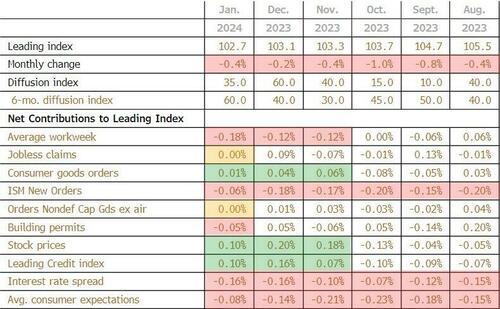
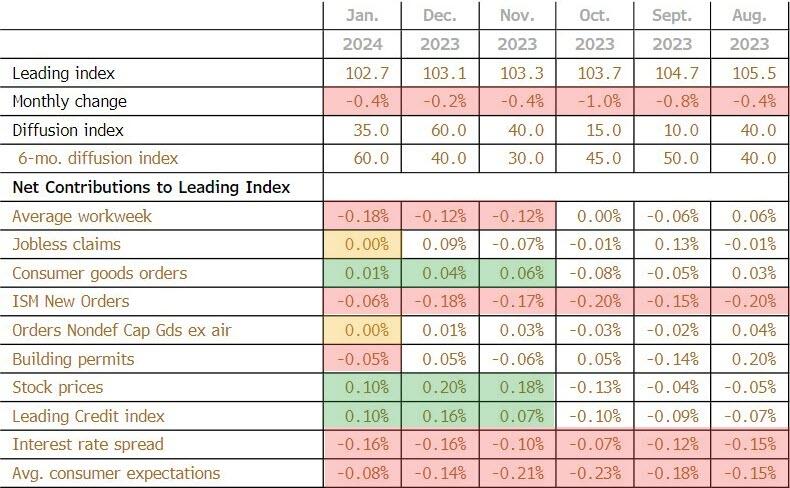
The biggest positive contributor to the leading index was stock prices (again)at +0.10
The biggest negative contributor was average workweek at -0.18
This is the 22nd straight MoM decline in the LEI (and 23rd month of 25) – equaling the longest streak of declines since ‘Lehman’ (22 straight months of declines from June 2007 to April 2008)
“While the declining LEI continues to signal headwinds to economic activity, for the first time in the past two years, six out of its ten components were positive contributors over the past six-month period (ending in January 2024).
As a result, the leading index currently does not signal recession ahead.
While no longer forecasting a recession in 2024, we do expect real GDP growth to slow to near zero percent over Q2 and Q3.”
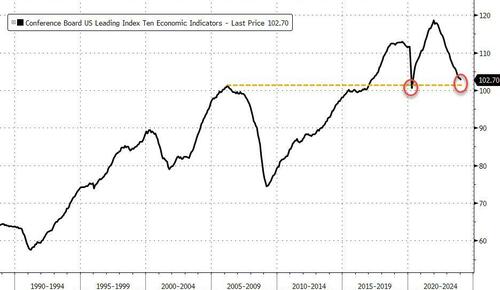
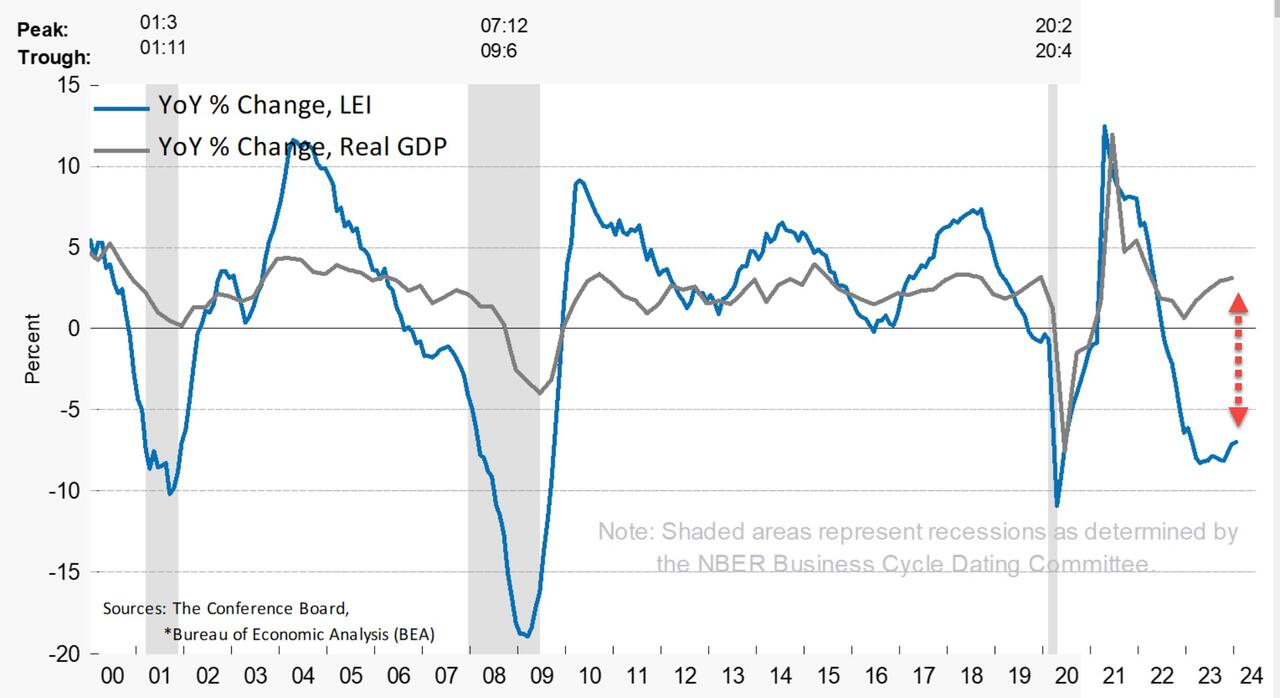
While the Conference Board seems optimistic, we are struggling to see any signs of hope! tumbling back below the peak in March 2006…
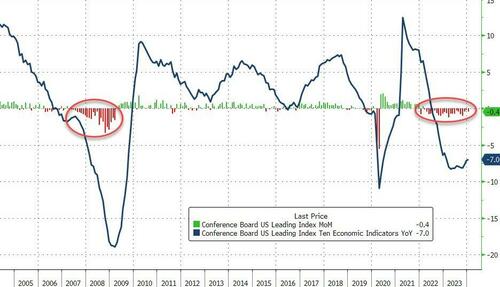
And on a year-over-year basis, the LEI is down 7.0% (down YoY for 19 straight months) – still close to its biggest YoY drop since 2008 (Lehman) outside of the COVID lockdown-enforced collapse (but starting to inflect)…
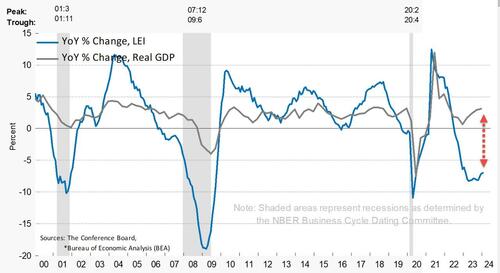
The annual growth rate of the LEI remains deeply negative and decoupled from Real GDP…..
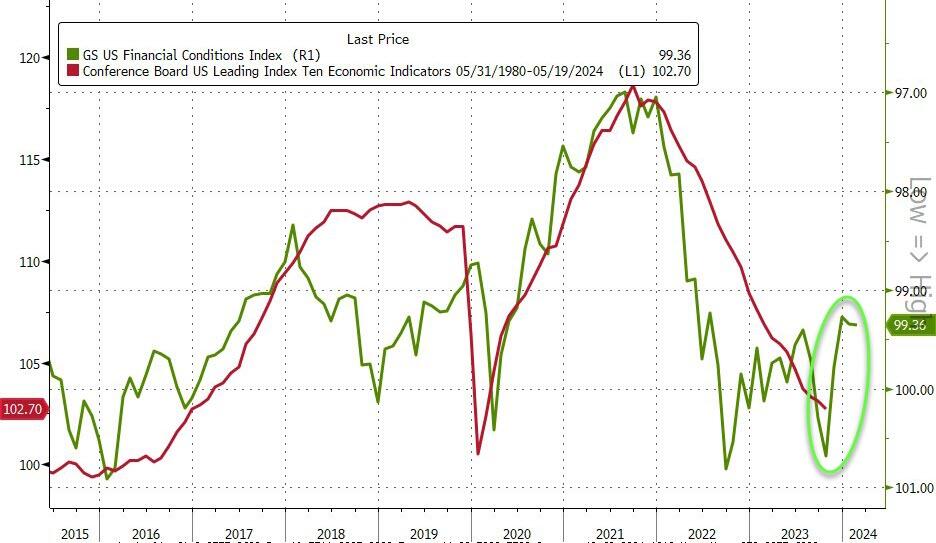
Finally, the massive easing of financial conditions in the last few months suggests a turn in LEI is imminent…
And hence the ‘soft landing’ mission is accomplished… so no need for rate-cuts? (Except for the banking crisis that looms in March).
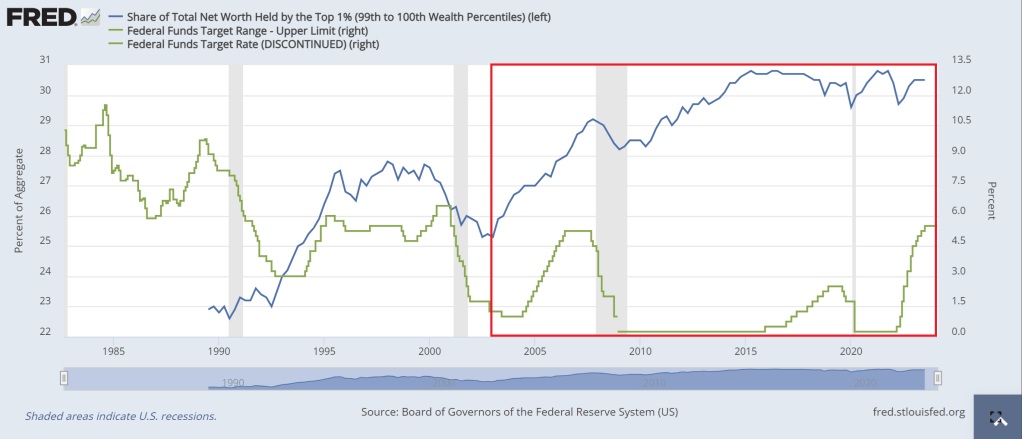
An example of the Sisyphus economy? The top 1% of earners (blue line) have seen an incredible increase in net worth, particularly after Fed Chair Alan Greenspan’s big rate cuts (green line) from 2000 to 2004. Each subsequent rate cuts under Bernanke (2007-2008) and Yellen (who just kept rates too low for too long). The end result? In the red box, the top 1% made out like bandits.
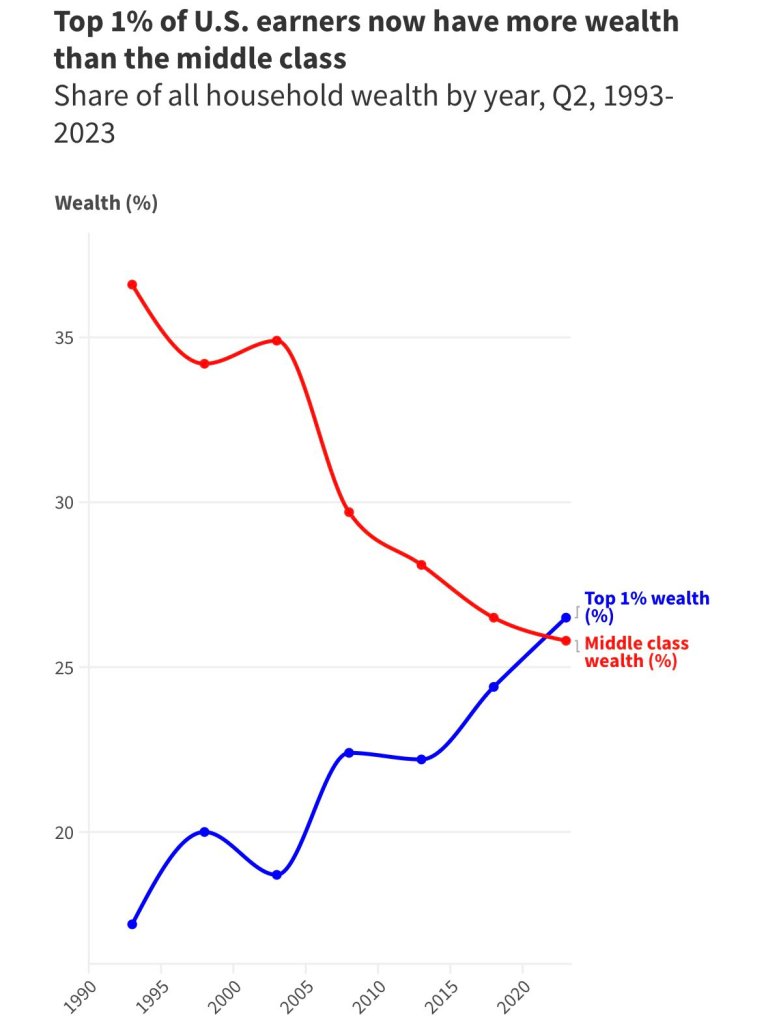
The end result? The top 1% of earners now have more wealth the the middle class.
Of course, asinine Federal government policies (like open borders and making donors wealthy with green energy spending) and the lack of a serious approach to corruption have complicated matters.
So the working class, middle class and low wage workers, are the ones pushing the boulder up a hill while government insiders like Biden make millions through influence peddling. So, unlike the Sisyphus legend, the middle class and low wage workers are being punished by simply existing.
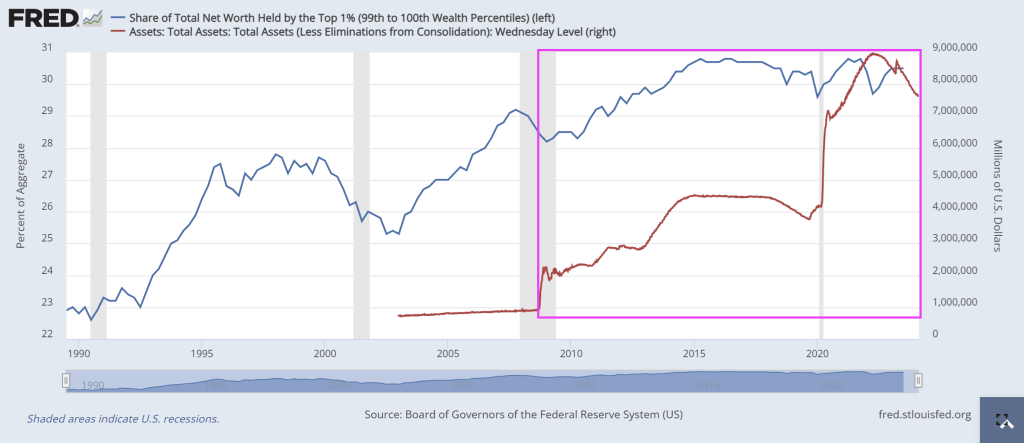
The Fed’s balance sheet has had a similar effect, particularly since the financial crisis of 2007-2008 when The Fed truly became unhinged under Janet Yellen. So of course, Yellen was made Secretary of Treasury, the largest honey pot in the world, so she could continue growing the elites power while minimizing the wealth of all others.
Should we end The Fed? Of course! But we can’t even have a rational discussion on why we are funding a war in Ukraine (to protect their border?) while we leave our borders open to invasion?
Here is one of the 1% who made a fortune by simply having a big mouth and being in politics.


You must be logged in to post a comment.