The Worst Jobs Report Of All-time Cloaked As A Biden Victory (All Job Creation Over Past 4 Years Has Been For Foreign-born Workers, Zero Job-creation For Native Born Workers Since July 2018!)

Today’s jobs report was UGLY! How when the US unexpectedly added 353K “jobs” – the most since January 2023. Remember, Biden is President. And apparenty El Presidente of Latin America, Africa and Asia.

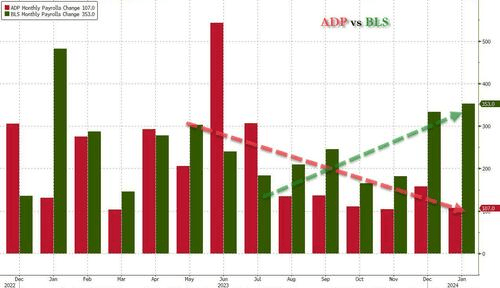
Let me start with the official Biden jobs report versus the ADP jobs report from yesterday. BLS showed an amazing surge while ADP was sigalling a slowdown. Obviously, BLS is measuring employment differently (this is an election year after all). Like seasonal adjustments (always econometric voodoo).

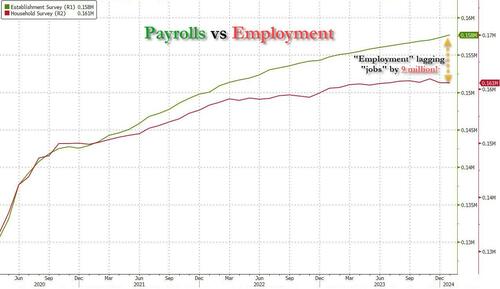
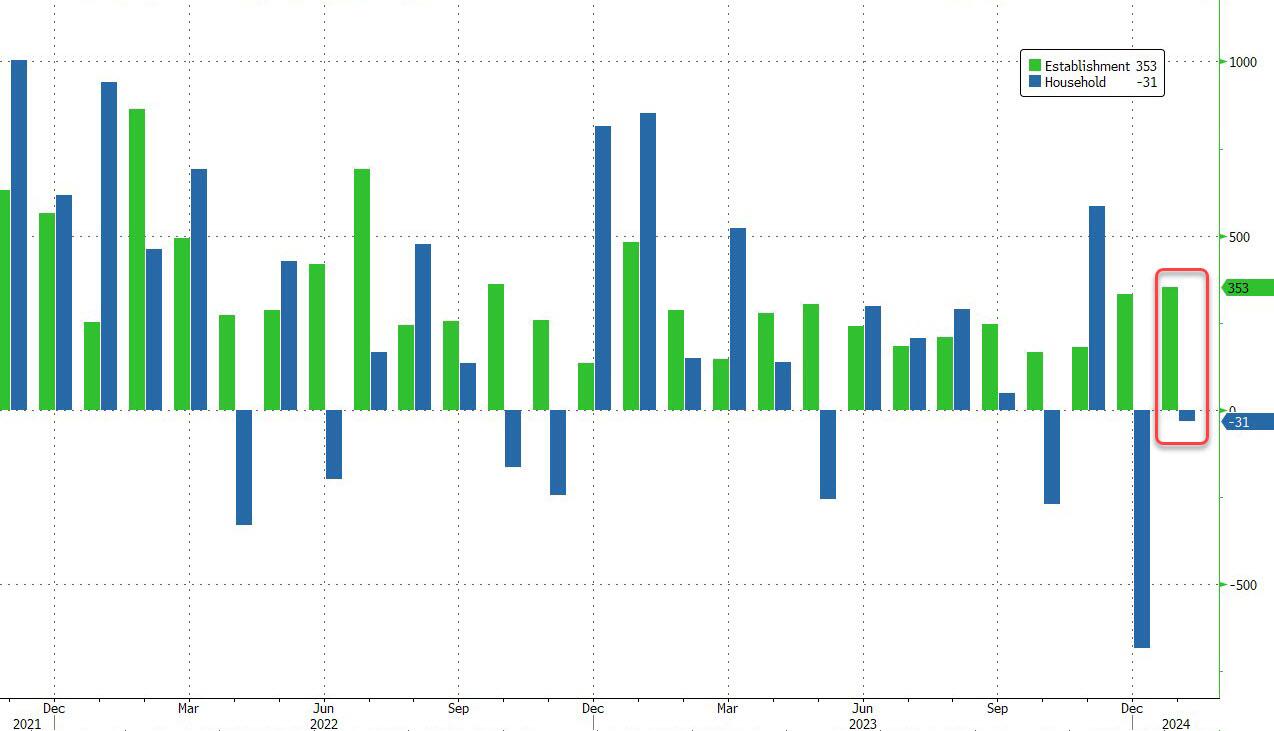
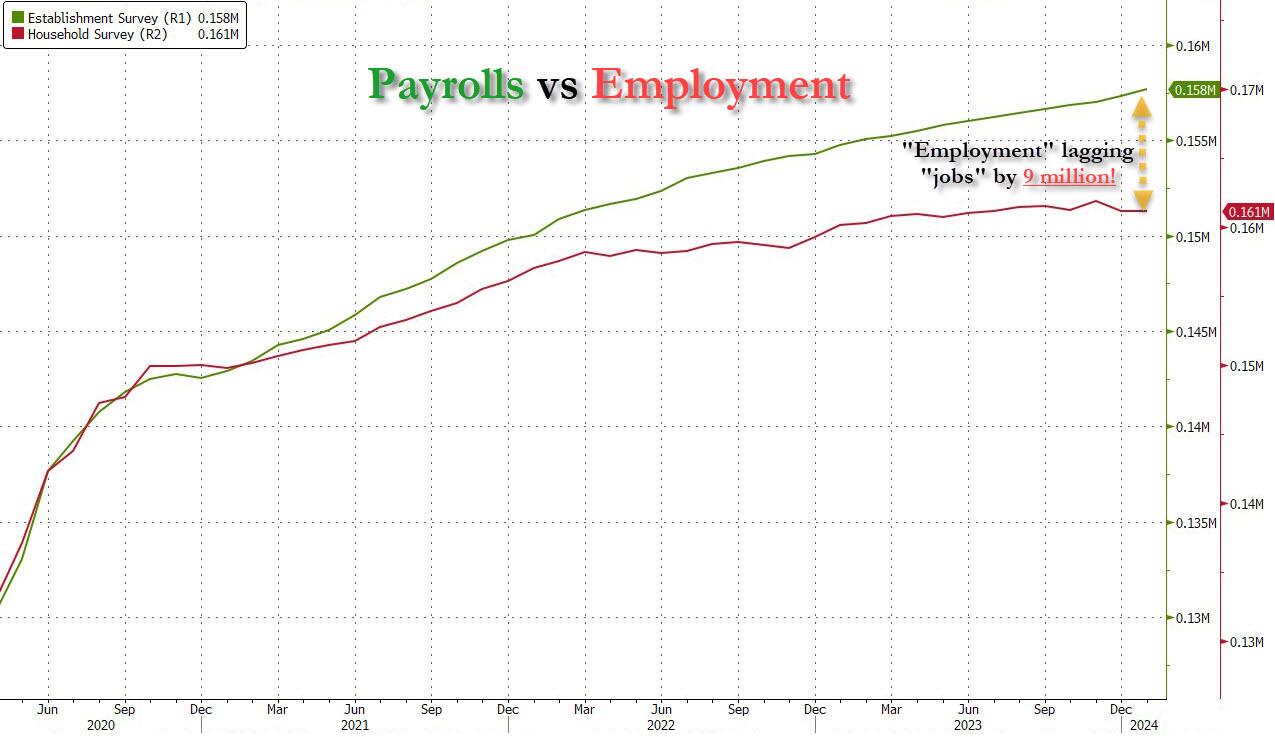
But it’s more than just the Biden admin hanging its “success” on seasonal adjustments: when one digs deeper inside the jobs report, all sorts of ugly things emerge… such as the latest divergence between the Establishment (payrolls) and much more accurate Household (actual employment) survey. To wit, while in January the BLS claims 353K payrolls were added, the Household survey found that the number of actually employed workers dropped again, this time by 31K (from 161.183K to 161.152K).

This means that while the Payrolls series hits new all time highs every month since December 2020 (when according to the BLS the US had its last month of payrolls losses), the level of Employment has barely budged in the past year. Worse, as shown in the chart below, such a gaping divergence has opened between the two series in the past 4 years, that the number of Employed workers would need to soar by 9 million (!) to catch up to what Payrolls claims is the employment situation.

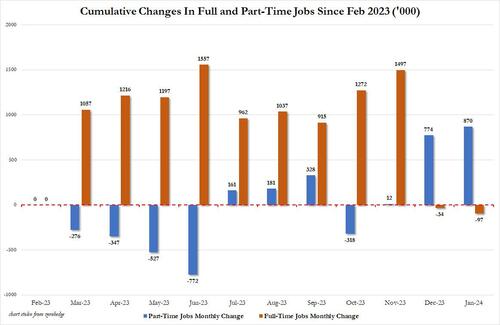
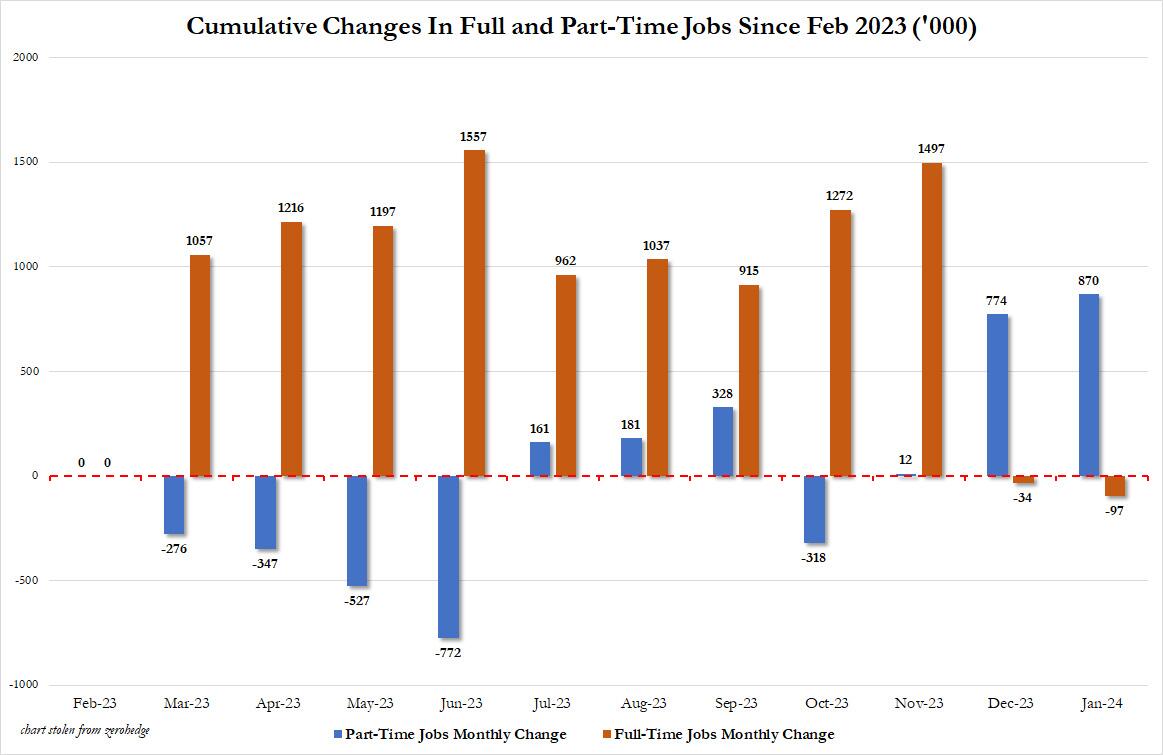
There’s more: shifting from a quantitative to a qualitative assessment, reveals just how ugly the composition of “new jobs” has been. Consider this: the BLS reports that in January 2024, the US had 133.1 million full-time jobs and 27.9 million part-time jobs. Well, that’s great… until you look back one year and find that in February 2023 the US had 133.2 million full-time jobs, or more than it does one year later! And yes, all the job growth since then has been in part-time jobs, which have increased by 870K since February 2023 (from 27.020 million to 27.890 million).

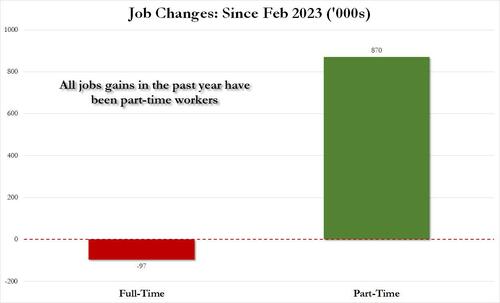
Here is a summary of the labor composition in the past year: all the jobs have been part-time jobs!

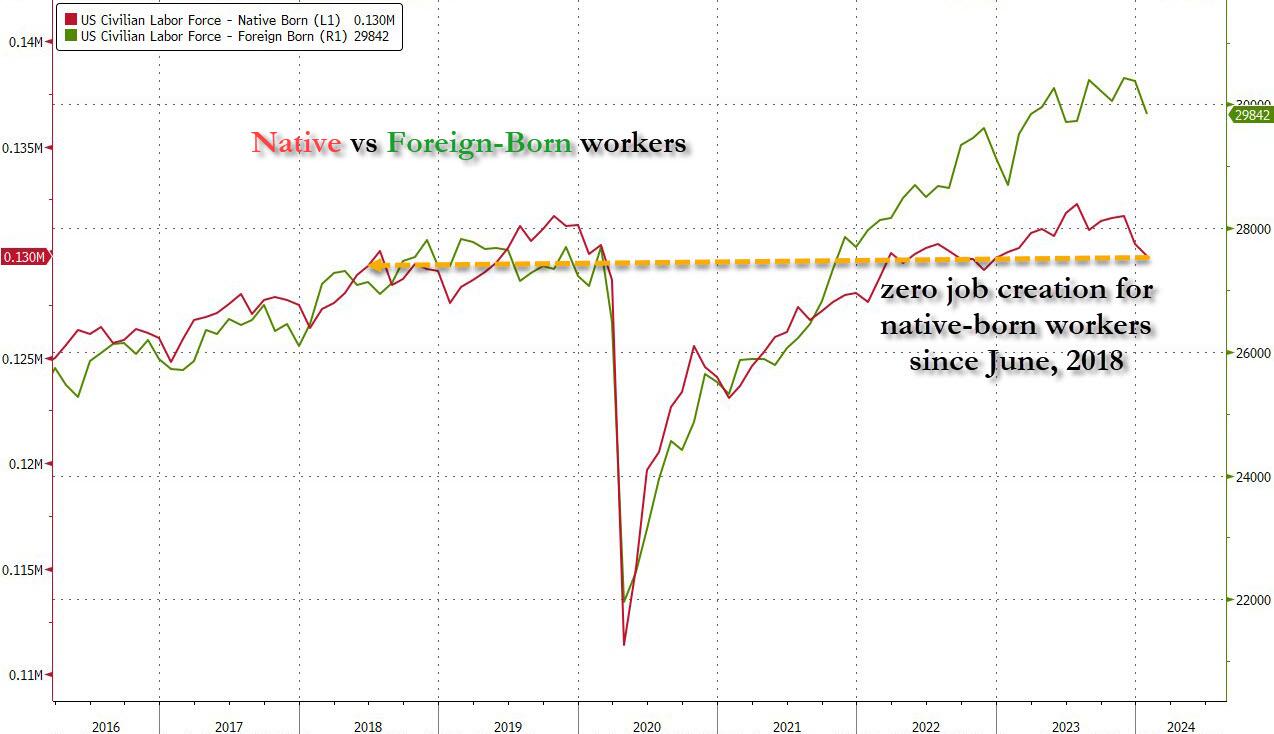
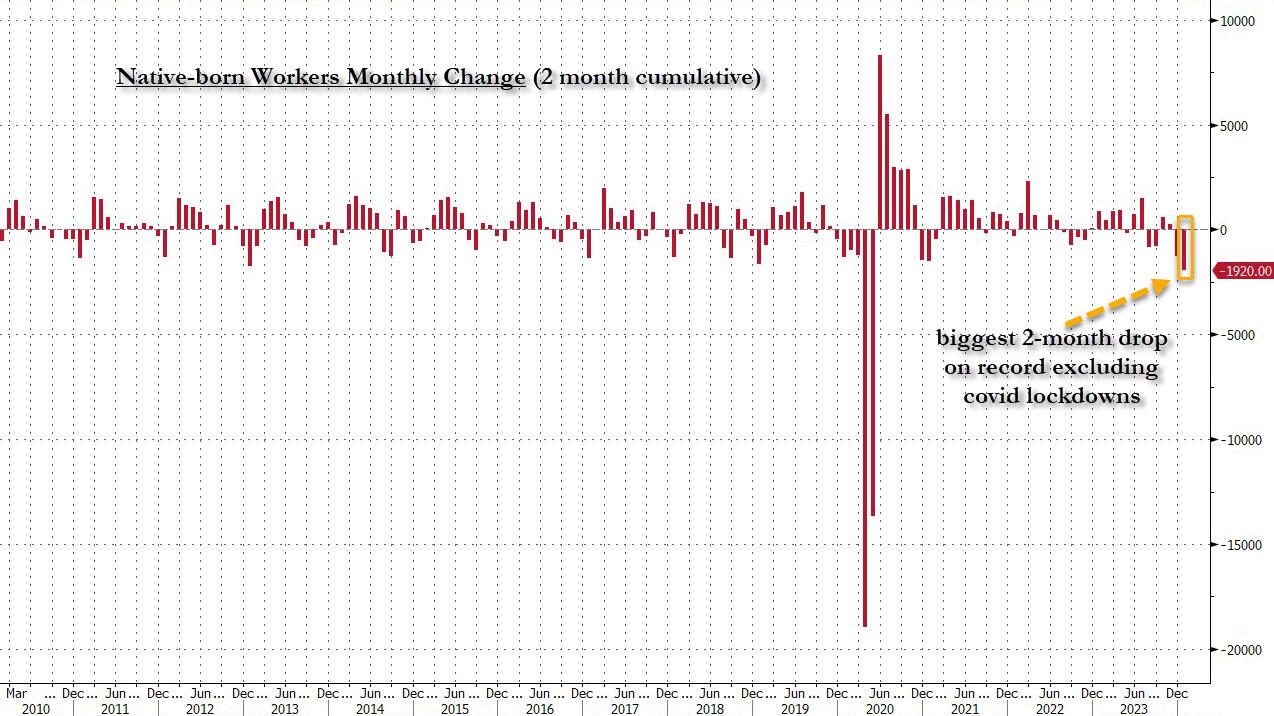
But wait there’s even more, because just as we enter the peak of election season and political talking points will be thrown around left and right, especially in the context of the immigration crisis created intentionally by the Biden administration which is hoping to import millions of new Democratic voters (maybe the US can hold the presidential election in Honduras or Guatemala, after all it is their citizens that will be illegally casting the key votes in November), what we find is that in January, the number of native-born worker tumbled again, sliding by a massive 560K to just 129.807 million. Add to this the December data, and we get a near-record 1.9 million plunge in native-born workers in just the past 2 months!

Said otherwise, not only has all job creation in the past 4 years has been exclusively for foreign-born workers, but there has been zero job-creation for native born workers since July 2018!

Source: St Louis Fed FRED Native Born and Foreign Born

This is a huge issue – especially at a time of an illegal alien flood at the border – and is about to become a huge political scandal, because once the inevitable recession finally hits, there will be millions of furious unemployed Americans demanding a more accurate explanation for what happened – i.e., the illegal immigration floodgates that were opened by the Biden admin.

Which is also why the Biden admin will do everything in his power to insure there is no official recession before November… and is why after the election is over, all economic hell will finally break loose. Until then, however, expect the jobs numbers to get more and more ridiculous.

I wonder if “Union Joe” is telling US labor union about no growth for native (American born) workers.

Slowdown! ADP Reports an Increase of 107,000 Private Payrolls As Powell Proclaims “No Sugar Tonight” (Why Do We Need Millions Of Illegal Immigrants?)

Slowdown! Bidenomics, based on historic binge spending and Fed sugar, is wearing out as the enormous sugar (stimulus) rush is over.

The hiring slowdown of 2023 spilled into January, and pressure on wages continues to ease. The pay premium for job-switchers shrank to a new low last month.

Another Soft Landing Proclamation

“Progress on inflation has brightened the economic picture despite a slowdown in hiring and pay. Wages adjusted for inflation have improved over the past six months, and the economy looks like it’s headed toward a soft landing in the U.S. and globally,” says Nela Richardson, Chief Economist, ADP.

ADP National Employment Report

The ADP National Employment Report shows Private Sector Employment Increased by
107,000 Jobs in January; Annual Pay was Up 5.2%

Job Switching Payouts

  • Year-over-year pay gains for job-stayers reached 5.2 percent in January, down from 5.4 percent in December.
  • For job-changers, pay was up 7.2 percent, the smallest annual gain since May 2021.
  • Median Change in Annual Pay (ADP matched person sample) Job-Stayers 5.2%, Job-Changers 7.2%

ADP Notice

January’s report presents the scheduled annual revision of the ADP National Employment Report, which updates the data series to be consistent with the annual Quarterly Census of Employment and Wages (QCEW) benchmark data for March 2023. In addition, this revision introduces technical updates, namely, in re-weighting of ADP data to match QCEW data. The historical file was updated to reflect these revisions.

Notice Translation

ADP revises its data to match annual BLS data from March of 2023. The BLS will do the same in its annual revisions.

The BLS does not even back adjust the numbers so its historical record is bogus. And despite being incredibly lagging, the Fed makes key decisions on the data.

Job Openings Rise in December But Quits Tell the Real Story

There’s lots of meaningless chatter yesterday about job openings. However, actions speak louder than openings.

This report comes after Fed Chair Jerome Powell said “No Sugar Tonight” as in no expected rate cuts. That is, until it becomes obvious that Biden will lose the election, THEN The Fed will start cutting rates like crazy.

An example of the trash that Biden and Democrats are importing from Latin America, Africa and China. Among other sewers. I am sure that employers are lining up to hire this guy. … NOT! Correction: Biden may appoint this creep to his cabinet with the other losers.

Taper Tantrum? Bank Credit Growth Negative For 26th Straight Week As Fed Plans End Of QT (Fed’s Balance Sheet Remains Enormous!!)

Oh Susie QT. The Fed loves you. And The Fed has put a spell on the economy.

Where do we sit today? Bank credit growth has been negative for the last 26 weeks. As M2 Money growth has stalled.

What will The Fed do?

While the FOMC may start the discussions around tapering QT as soon as at this meeting, tapering itself is still a ways off, and the actual end of QT will come early next year.

In January and May 2022, the FOMC published the principles and then the plan for QT. The fact of a taper this year is not news. More recent communication from Fed officials (for example from President Logan and Governor Waller) reinforced a preference for the reverse repo (RRP) facility to be drawn down to zero, and we infer that getting the RRP near zero will be the starting point for the taper.

Historically, the FOMC has taken at least two meetings to finalize these types of plan, and the December minutes stressed a desire to give the market lots of advance notice. As a baseline, we think the FOMC announces the parameters for the QT taper at its May meeting and enacts that taper in June, by cutting the runoff of Treasury securities in half. Because the Fed’s RRP facility has been declining rapidly, that timing could shift earlier by a month or so.

The change to shedding $30 billion per month in Treasuries would slow the pace of runoff materially, but there is clearly a chance that the subsequent pace is even slower. President Logan pointed out that running off the balance sheet slowly could ultimately allow the Fed to shrink the balance sheet even more while mitigating the risk of money market disruptions. A June taper would be consistent with our house view on the path of the RRP facility, which we expect to stand at approximately $225 billion at the end of May and be depleted by August.

We anticipate that reserves will remain broadly around current levels until RRP is depleted. But from there, we think reserves will ultimately fall to roughly $3.2 trillion, around $300 billion below current levels, and the FOMC will call off QT in early 2025. That view on the ending level of reserves reflects our outlook on the SOFR – IORB (Secured Overnight Funding Rate – Interest on Reserve Balances) spread turning positive, indicating the end of abundant reserves.

For broader markets, however, our strategy team does not expect the tapering and end of QT to be a significant event. Our rates strategists think the phenomenon is mostly in the price and, if anything, front-end swap spreads may have already overreacted to the news of an early taper. With a limited effect on rates, and the tapering and end of QT largely anticipated, our MBS and credit strategists similarly see few if any implications. Of course, some market narrative is focused on QT’s effects on the banking sector. While the intuitive notion that QT must destroy deposits is widespread, we have highlighted the data which show in fact that deposits have edged up, not down, in recent months as QT has progressed. Banks can always choose to bid for wholesale deposits, so instead of focusing on the quantity of “money” and how that changes, a better question is how bank funding costs are evolving.

So, the next step is for the Fed to shift from “talking about talking about tapering QT” to actually talking about tapering QT. Only after that step will we start to look for the end of QT, which the Fed will determine with an eye on money market conditions. In particular, the Fed is looking at whether SOFR is trading below the rate the Fed pays on reserves, in which case it will likely judge conditions to be accommodative, or above the rate the Fed pays on reserves, in which case the Fed’s calculus will change and the discussions about the end of QT will pick up steam.

The Fed’s balance sheet remains greatly expanded despite the increase in The Fed’s target rate. Nothing has been the same since the banking crisis of 2008-2009. And Covid in 2020.

Bidenomics Has Added $1.78 TRILLION In Public Debt But REAL Avg Hourly Earnings Declined By -1.3% (Don’t Stand Too Close To Joe!)

Here comes the Federal government, spending and borrowing like insane people then presenting us with the bill.

Only The Federal government and Joe Biden would borrow $1.78 TRILLION, producing REAL average hourly earnings that are -1.3% lower.

Meanwhile, Obama and his wife Michelle are singing “Don’t stand to close to Joe!”

Dammit, Janet! Janet Yellen Bets $2 Trillion That Rates Will Not Be Higher-For-Longer (Funds US At Short-end Of Curve)

Dammit Janet! Stop borrowing money that we have to pay back!

Don’t forget! US Q4 GDP grew by $182.6 billion while Janet Yellen increased borrowing by $834 billion. (Public Debt By 4.5 Times GDP Growth).

In 2023, the Treasury added $2.6T to the national debt. While that number alone should be enough to scare anyone, the details reveal something even more concerning. $2T of it, or 77%, was financed entirely with short-term Treasury Bills maturing in less than a year. The chart below shows the debt issuance trend over the last 20 years. As shown, the Treasury typically relies on medium-term debt (2-10 Year Notes) to fund the budget deficit. 2023 was a massive change in standard procedure as shown by the giant light blue bar on the right of the chart.

Figure: 1 Year Over Year change in Debt

The only other times Bills were used as a primary funding source was in 2008 during the Great Financial Crisis and 2020 during Covid. Neither year came close to 77% of total new debt issuance. These were also emergency times, and specifically in 2021, almost half the short-term debt was retired in favor of Notes and Bonds to undo the 2020 Bill issuance.

The Treasury has spent nearly two decades trying to extend the maturity of the debt. This can be seen in the blue line below that shows the average debt maturity. When the short term debt is issued in such a way, it drives down the average maturity, which causes the Treasury to have to roll-over more debt in shorter time periods. So why has the Treasury all of a sudden gone entirely to short-term debt in non-emergency times? The answer lies in the orange line, so let’s dig in.

Figure: 2 Weighted Averages

First, it is important to understand the interest rates the Treasury is facing. The chart below shows the current yield curve as it stands today and 6 months ago. As you can see, short-term rates are a full 1%-1.5% higher than medium-term. What?!? Didn’t we just see that the Treasury has specifically targeted short-term debt?

Why are they paying more than they have to? Had the Treasury financed the $2T with Notes, they would have saved $30B in interest this year alone!

Figure: 3 Tracking Yield Curve Inversion

So, why have they done this? Well, there are two potential possibilities.

First, they may be nervous about the market’s ability to handle so much medium-term debt. The market typically digests short-term debt very easily, but it can become saturated with medium-term debt. The chart below shows the amount of medium-term debt that rolled over last year. This is not new issuance; this is debt maturing that needs to be rolled over.

As shown, nearly $2T rolled over last year. This means, had the Treasury issued Notes instead of Bills, the Market would have had to absorb a whopping $4T in new medium-term debt like they did in 2020. The difference this year is that back in 2020 the Fed bought nearly all of that debt, putting a floor under the market.

Compounding this problem further is that this year is set to be a record year in terms of debt rollover. Nearly $2.9T in Notes need to be rolled over.

Figure: 4 Treasury Rollover

Still, even with that massive amount of debt issuance, there must be more to the story. Why would Yellen specifically pay $30B more in interest just because she is concerned the about the volume of debt issuance. As Figure 1 above shows, this has never been a concern in the past except in emergency situations. Furthermore, why not issue at least some new debt as medium-term.

This lends to a second, and more probable conclusion. Long-term rates are set to fall in the very near term. The Treasury did not want to lock in for 2-7 years at 4% if it knows rates will fall. It will pay a premium ($30B this year), if it means it can lock in lower rates for longer and save the money on the back end.

So, why are long-term rates, going to fall? Because they have to… the chart below shows the current interest owed on the national debt annualized. It’s not a pretty picture, and you can see how the interest from Bills has absolutely ballooned.

Figure: 5 Net Interest Expense

The Fed has come out with their dot plot that shows a calm glide path down. Well, we can take the debt maturity and push it forward at the projected rate of the Fed. Even given the current proposed 6 rate cuts, and getting back to 3.5% by early 2025, the trajectory for interest expense is not looking good.

Given current projections by the Fed, the Treasury will owe over $900B on interest by 2025That is a debt death spiral. The Fed had to pivot back in 2018 when interest expense neared $400B. Next year, the cost will be more than double that!

Figure: 6 Projected Net Interest Expense

There is a potential third option. It’s an election year. Maybe Yellen is doing everything and anything to keep the financial system running smoothly. She has decided that the Treasury market must remain 100% stable and wants to take no chances. Thus, she issues tons of short-term debt, costing the tax payer an extra $30B this year and decides it’s a problem to be fixed at a later date.

While this would be wildly irresponsible and corrupt, the real argument against possibility 3 is the same as possibility 1, the market should be able to ingest at least some medium-term debt. This means the only logical conclusion is that she knows rates are coming down hard and fast. How does she know? Well, she used to be the head of the Fed.

There is no doubt, everyone in Washington can do the simple math above and recognize the Fed cannot take a glide path down. The only option is for rates to come down. Yellen just bet $2T on that outcome.

Here are Janet Yellen, Joe Biden and Jay Powell doing “The Time Warp” fantasizing about the glory days of Marxism in the Soviet Union under Lenin and Stalin.

Joe, Are You Kidding? Core PCE Services Accelerated, Housing Stuck at 5.7% for Six Months

Joe, are you kidding about the sizzling economy? Karine Jean Pierre is also guilty of comedy or gross propaganda.

So right up front – and the Fed has been talking about this, though no one listens: The “core services” PCE price index has gotten stuck at 3.5% over the past six months annualized, and accelerated to 4.0% month-to-month annualized in December, with housing inflation stuck at about 6.7% over the past six months annualized, and with other core services components still red-hot.

The core services PCE price index rose by 0.33% in December from November, the second acceleration in a row, according to data from the Bureau of Economic Analysis today. This amounts to an increase of 4.0% annualized (blue).

The six-month moving average, which irons out the huge ups and downs of the month-to-month data, accelerated to 3.5%, and has been in this range since August, after the sharp deceleration in early 2023 (red).

Core services is where consumers spend the majority of their money, and they matter. Which is why Fed governors have said in near unison that they’re in no hurry to cut rates, but have taken a wait-and-see approach, with an eye on core services. And if it goes away, fine.

But on the surface, the PCE price index looks encouraging, and this has been the trend for months, with the overall PCE price index at +2.6% year-over-year in December, the lowest since March 2021; and with the core PCE price index at +2.9% year-over-year, also the lowest since March 2021, and aiming for the Fed’s 2% target.

The factors for the year-over-year cooling in these inflation measures have been the same for months: plunging energy prices, sharply dropping prices of durable goods after the huge spike in 2020 and 2021, cooling food inflation (with prices still rising from very high levels, but slowly), and favorable “base effects” when compared to a year ago.

But energy prices don’t plunge forever, so that will go away; durable goods prices don’t drop sharply forever either, though they can drop for a while longer to unwind some more of the price spike they’d been through in 2020 and 2021; and the base effects are going to get timed out this year, when the base of the year-over-year comparisons become the lower inflation figures of 2023.

Housing inflation, still red hot and not cooling anymore. The PCE price index for housing rose by 0.46% in December from November and has been in this range since March, after the sharp slowdown early in 2023. This amounts to 5.7% annualized (blue in the chart below).

The housing index is broad-based and includes factors for rent in tenant-occupied dwellings; imputed rent for owner-occupied housing, group housing, and rental value of farm dwellings. It’s the largest component of core services.

The six-month moving average annualized, which shows the more recent trends, also rose by 5.7% in December, and has been in the same range since August (red).

So it looks like the PCE price index for housing has gotten stuck at 5.7%.  This stubborn inflation in housing is a blow to theories trotted out for 18 months that housing was lagging, and that we know it will go away as an issue, etc., etc. The increases are less hot than they had been, but remain hot and have become persistent.

The major categories of core services in the PCE price index, as a six-month average of month-to-month changes, annualized:

Core services, major categories, 6-month average, annualized
Housing5.7%Description and chart above
Non-energy utilities2.5%Water, sewer, trash
Health care2.5%Physicians, outpatient, hospital, nursing care, dental, etc.
Transportation services6.1%Auto repair & maintenance, auto leasing & rentals, public transportation, airfares, etc.
Recreation services5.6%Concerts, sports, movies, gambling, streaming, vet services, package tours, etc.
Food services, accommodation2.8%Meals & drinks at restaurants, bars, schools, cafeterias, etc.; accommodation at hotels, motels, schools, etc.
Financial services3.5%Fees & commissions at banks, brokers, funds, portfolio management, etc.
Insurance2.8%Insurance of all kinds, including health insurance
Other services0.1%Collection of other services

Inflation in Transportation services and Recreation services is accelerating on the basis of the 6-month moving average, with the PCE price index for Transportation services rising by 6.1%, and the index for Recreation services rising by 5.6%:

The head-fakes last time.

Inflation in services turns out to be tough to beat, and it can dish up big head-fakes. Last time we had this type of surge of inflation, so that was in the 1970s and 1980s, we thought repeatedly that we had inflation licked, only to find out that we’d fallen for an inflation head-fake. There were three head-fakes in core services on the way to the peak of 11% in 1981:

But Democrats are desperate to stay in power and rake in billons of dollars. Their strategy? Nobody But Joe. Well, except maybe Mike Obama.

The Amazing, Pre-Downward Revision, Advanced GDP Report! Surprise GDP Driven By Cousin Eddies Fueled By Massive Debt

To quote Cousin Eddie from Christmas Vacation, “That there’s an RV.” Recreational goods and vehicles (aka, RVs) were second in Personal Consumption spending after America’s overpriced healthcare.

Spending on RVs makes sense since housing has become unaffordable for millions of households under Bidenomics.

The increase in real GDP reflected increases in consumer spending, exports, state and local government spending, nonresidential fixed investment, federal government spending, private inventory investment, and residential fixed investment (table 2). Imports, which are a subtraction in the calculation of GDP, increased.

Note that GDP growth was better under Trump (pre-Covid).

The increase in consumer spending reflected increases in both services and goods. Within services, the leading contributors were food services and accommodations as well as health care. Within goods, the leading contributors to the increase were other nondurable goods (led by pharmaceutical products) and recreational goods and vehicles (led by computer software). Within exports, both goods (led by petroleum) and services (led by financial services) increased. The increase in state and local government spending primarily reflected increases in compensation of state and local government employees and investment in structures. The increase in nonresidential fixed investment reflected increases in intellectual property products, structures, and equipment. Within federal government spending, the increase was led by nondefense spending. The increase in inventory investment was led by wholesale trade industries. Within residential fixed investment, the increase reflected an increase in new residential structures that was partly offset by a decrease in brokers’ commissions. Within imports, the increase primarily reflected an increase in services (led by travel).

Compared to the third quarter of 2023, the deceleration in real GDP in the fourth quarter primarily reflected slowdowns in private inventory investment, federal government spending, residential fixed investment, and consumer spending. Imports decelerated.

Current‑dollar GDP increased 4.8 percent at an annual rate, or $328.7 billion, in the fourth quarter to a level of $27.94 trillion. In the third quarter, GDP increased 8.3 percent, or $547.1 billion (tables 1 and 3).

The price index for gross domestic purchases increased 1.9 percent in the fourth quarter, compared with an increase of 2.9 percent in the third quarter (table 4). The personal consumption expenditures (PCE) price index increased 1.7 percent, compared with an increase of 2.6 percent. Excluding food and energy prices, the PCE price index increased 2.0 percent, the same change as the third quarter.

Personal Income

Current-dollar personal income increased $224.8 billion in the fourth quarter, compared with an increase of $196.2 billion in the third quarter. The increase primarily reflected increases in compensation, personal income receipts on assets, and proprietors’ income that were partly offset by a decrease in personal current transfer receipts (table 8).

Disposable personal income increased $211.7 billion, or 4.2 percent, in the fourth quarter, compared with an increase of $143.5 billion, or 2.9 percent, in the third quarter. Real disposable personal income increased 2.5 percent, compared with an increase of 0.3 percent.

Personal saving was $818.9 billion in the fourth quarter, compared with $851.2 billion in the third quarter. The personal saving rate—personal saving as a percentage of disposable personal income—was 4.0 percent in the fourth quarter, compared with 4.2 percent in the third quarter.

GDP for 2023

Real GDP increased 2.5 percent in 2023 (from the 2022 annual level to the 2023 annual level), compared with an increase of 1.9 percent in 2022 (table 1). The increase in real GDP in 2023 primarily reflected increases in consumer spending, nonresidential fixed investment, state and local government spending, exports, and federal government spending that were partly offset by decreases in residential fixed investment and inventory investment. Imports decreased (table 2).

The increase in consumer spending reflected increases in services (led by health care) and goods (led by recreational goods and vehicles). The increase in nonresidential fixed investment reflected increases in structures and intellectual property products. The increase in state and local government spending reflected increases in gross investment in structures and in compensation of state and local government employees. The increase in exports reflected increases in both goods and services. The increase in federal government spending reflected increases in both nondefense and defense spending.

The decrease in residential fixed investment mainly reflected a decrease in new single-family construction as well as brokers’ commissions. The decrease in private inventory investment primarily reflected a decrease in wholesale trade industries. Within imports, the decrease primarily reflected a decrease in goods.

Current-dollar GDP increased 6.3 percent, or $1.61 trillion, in 2023 to a level of $27.36 trillion, compared with an increase of 9.1 percent, or $2.15 trillion, in 2022 (tables 1 and 3).

The price index for gross domestic purchases increased 3.4 percent in 2023, compared with an increase of 6.8 percent in 2022 (table 4). The PCE price index increased 3.7 percent, compared with an increase of 6.5 percent. Excluding food and energy prices, the PCE price index increased 4.1 percent, compared with an increase of 5.2 percent.

Measured from the fourth quarter of 2022 to the fourth quarter of 2023, real GDP increased 3.1 percent during the period (table 6), compared with an increase of 0.7 percent from the fourth quarter of 2021 to the fourth quarter of 2022.

The price index for gross domestic purchases, as measured from the fourth quarter of 2022 to the fourth quarter of 2023, increased 2.4 percent, compared with an increase of 6.2 percent from the fourth quarter of 2021 to the fourth quarter of 2022. The PCE price index increased 2.7 percent, compared with an increase of 5.9 percent. Excluding food and energy, the PCE price index increased 3.2 percent, compared with 5.1 percent. 

Annualized interest on the federal debt now exceeds $1 trillion and is projected to breach $3 trillion, annualized rate, by Q4 2030.

What can you get for an $834-billion increase in federal debt? Only a $328-billion increase in GDP. This economic “growth” in Q4 ’23 was fueled by gov’t expenditures and gov’t transfers, which in turn are fueled by deficits – sound sustainable?

This is Cousin Eddie’s RV. Cheaper than a house under Bidenomics!

Will “Animal Spirits” Force “Dovish Trifecta” Off-Course? (Will The Fed Misread Soaring Stock Market And Make Yet ANOTHER Policy Error??)

It smells like … ANIMAL spirits.

The last week or so has seen a tactical ‘hawkish’ reversion in USTs and STIRs to play for a re-pricing lower in March rate-cut expectations, following the recent ‘hard-data resiliency’ with Consumer and Labor, alongside modestly “hawkish” rhetoric (despite soft data weakness)…

And, as Nomura’s Charlie McElligott highlights this morning, we are also seeing new upside being bot in SOFR Options for “dovish outcome”-hedging again, with Core PCE looming later this week.The market has had bunches of March SOFR Downside structures trading over the past few weeks to play for “Fed cut overshoot,” which has been the right trade YTD, as the implied probability distribution shows March Fed cuts now having been slashed by over half the the past week and a half (~80% priced to now just ~40%), and accordingly now we’ve witnessed some monetization of tactical Downside in recent days…

And we see the swaption surface getting mushed…

As he notes, the “dovish-trifecta” right-tail repricing has gotten us to ~4900… and, he says, the actual “realization” could then certainly push us through 5000:It’s my expectations that we could very well see:1) “March Fed cut” to pick-up Delta again after what is expected to be a “light” core PCE print this Friday…and taking back pricing following the past week’s Fed speak pushback and “too resilient” Labor- and Consumer- data, which has driven March Fed meeting “cut” probabilities being sliced in half over the past one week (~80% on 1/12/24 to today’s ~40%)The next potential dovish catalyst is 2) the QRA est / announcement end of Jan / start Feb, with “binary risk” implications on the direction of Duration and Risk-Assets, as the market generally anticipates resumption of larger Coupon issuance from the US Treasury ahead—but what if there is one final announcement where Bills stay high, Coupon increases but isn’t as large as most anticipate, AND Yellen signals that this is the final expected Coupon increase?!

While we’re at it and relate to the Treasury’s QRA discussion, let’s not forget the “other” market- and economic- backstop being applied by the Biden Administration (and aided by what looks to be Janet Yellen’s “politically activist” US Treasury with TBAC sign-off) – which is the continued willingness to run large fiscal deficits in an attempt to “run the economy hot” in this election year, with much of it being “paid for” via Bills (so to prevent long-end Rates from pushing higher, which would tighten US financial conditions)……this is Green build, CHIPS Act, and even fresh “election surprises” like Biden announcement Friday on “forgiveness” of a fresh $5B of student loans, now making the total loan forgiveness approved by the Biden admin $136.6B

And finally as a derivative of the above mention, another hypothetical Treasury QRA where we’d see “Bill issuance remaining high, yet with Coupon increases not as large as most anticipate” would then mechnically see MMF’s continuing pulling from RRP to buy Bills, which will further accelerate the RRP drain…and as outlined in recent weeks, “low” RRP levels will act as “a” key input to Fed reaction function on determining LCLoR……which will ultimately mean 3) a pulling-forward on the market’s expected timing on the “end of QT”

This “dovish-trifecta” is the macro catalyst behind the “right-tail” scenario which has appropriately been repriced higher by the market over the course of the past month, and we’ve seen clients allocate some protection spend to this “crash-UP” scenarioAnd again, IF the above were to realize… without negative catalysts (Earnings fine, no further Rates selloff / Fed repricing, continued disinflationary trajectory rebuilds “Fed cut” implied probability) around that upcoming Feb VIXpery with all that Dealer “short VIX Calls” positioning being hedged… there is absolutely potential for an Equities slingshot if there are no issues and those customer “Long VIX Calls” bleed-out, which will mean Dealers puke out their UX1 Longs (as hedges) back into the market for a potential “kicker” to goose Spot Equities even higher…For now, no-one is worried about downside based on VVIX being back near post-COVID lows…

So what then is the largest DOWNSIDE RISK to Equities? 

Outside of “Mag 7” guidance disappointments, I believe the next worst-case scenario for current positioning in Stocks would be an “Animal Spirits” US data reacceleration which forces the above “dovish trifecta” off-course and blows-out the recently calming “Fed Rates path” distribution again:Why would resumption of better US growth data negatively impact US Equities consensus thematic / singles positioning?Because after the 4Q23 de-grossing of short books and forced “Net-up” to stop the bleed and chase (massive squeeze & cover in low quality / cyclical value / leveraged balance sheet / high short interest “junk”)….2024 YTD has instead seen the market reset the prior “Momentum” regime of “Long Quality / Size / Secular Growth” i.e. MegaCap Tech, while re-shorting that economically-sensitive “low quality / junk” stuff againIn a world of slowing but positive growth to 2% GDP and now with 3m inflation annualizing sub 2% target…you go back to that “QE of old” 2010s -decade playbook of “long stuff that can grow earnings and profits without needing a hot economic cycle”…i.e. long quality, size (liquid) & secular growth / short leverage & cyclical valueBut IF we see the “animal spirits” data reacceleration off the back of the massive FCI easing that the Fed and Treasury have facilitated, plus the persistent wage growth and still too strong labor meaning consumption remains robust, along with ongoing govt fiscal stim / spending…

.

..we risk a chance of inflation pivoting away from the current disinflationary trajectory (God-forbid actual “reflation”) which would could see that “long secular growth / short econ sensitive / cyclical value’ trade get a shock reversal…

…as long-end Yields and accordingly then, financial conditions, re-tighten and smash the “high valuation” Quality / Secular Growth stuff, while the heavily hated / shorted Cyclicals would painfully squeeze higher.Don’t forget, we’ve seen that happen before (yes we know the magnitudes of the inflationary impulse are different, but the timing of the human-emotion/monetary-policy-over-confidence double-rip in inflation is unquestionable)…

So, be careful what you wish for from higher and higher all-time-highs for stocks – the stronger they look (on the back of dovish expectations), the more likely The Fed is to hold back the actual dovish actions so much hope is founded on.

The Bidenomics Roadmap! Existing Home Sales (4.09 million) Drop To Lowest Level Since 1995 (Lowest SAAR Since 2010)

American homebuyers are going down the road of Bidenomics and feeling bad. Is this the roadmap for the US??

Existing Home Sales fell 1.0% MoM in December, worse than the +0.3% expected, leaving sales down

Source: Bloomberg

Total Existing Home Sales in December 2023 were 3.78mm – the lowest SAAR since 2010…

Source: Bloomberg

But, on an annual basis, this is the worst year on record (back to at least 1995)..

Source: Bloomberg

“The latest month’s sales look to be the bottom before inevitably turning higher in the new year,” said NAR Chief Economist Lawrence Yun. “Mortgage rates are meaningfully lower compared to just two months ago, and more inventory is expected to appear on the market in upcoming months.”

Existing Home Sales were flat in the Northeast, lower in the MidWest and the South, and up marginally in the West (driven by single-family-home sales as condo sales declined)…

Source: Bloomberg

Last month, the number of previously owned homes for sale dropped to 1 million, the lowest since March.

At the current sales pace, selling all the properties on the market would take 3.2 months.

Realtors see anything below five months of supply as indicative of a tight resale market.

That lack of inventory is helping to keep prices elevated.

The median selling price climbed 4.4% to $382,600 in December from a year ago, reflecting increases in all four regions. Prices hit a record of $389,800 in 2023.

Source: Bloomberg

But, with mortgage rates having tumbled (and given the lagged responses), are sales about to start rising again?

Source: Bloomberg

So The Fed managed to kill sales, collapse inventories, send home prices higher, destroying affordability… and now what is going to happen?

Is Bidenomics the Highway To Hell?

Who designed this photoshoot for an accordian band?? Not sure I want to have a party with this crew!

Biden Brags About Mortgage Rates Dropping In 2024 (Inside Info On Disease X?? Or Admission That The Economy Actually Sucks)

As only Clueless Joe can do, Biden brags about something that he has nothing to do with: falling mortgage rates.

Mortgage rates (30-year conforming rate) are up 392 basis points or a whopping 142% under Biden. Mortgage rates are down from the 2023 peak of 7.83% to 6.69% as of yesterday. One reason that mortgage rates are stable is that M2 Money GROWTH has been negative since the end of 2022.

Of course, it is The Federal Reserve acting to slow down inflation caused by excessive Federal government spending that is leading to mortgage rates declining, not Biden’s open border policy or his green agenda.

But for the future, does Biden know something that we don’t know? Like is Biden buying into the hypothetical Disease X (20 times worse than Covid) that was discussed in Davos at the World Economic Forum. If a major pandemic is unleashed (again) in the election year, The Fed would have to cut rates (again) to offset the damage done by another round of goverment economic shutdowns. Not to mention the shutting down of schools again.

Or did Biden just tell us that he knows the US economy is slipping and The Fed will come riding to the rescue of Biden (or Newsom or Michelle Obama) like in an old John Ford western with John Wayne. That would also lead to declining mortgage rates in 2024.

But all is not well in the banking sector. Use of Fed funding tool jumps most since April to fresh record: Banks borrowed record sum of $161.5bn from Fed’s Bank Term Funding Program, w/demand at $14.3bn climbing the most in 9 months as they piled into a reliable arbitrage trade just weeks ahead of its scheduled closure.

The availability of mortgage credit remains VERY TIGHT.

Whether its Disease X (unleashed The Kraken!) or just a slowing economy, The Fed (the master manipulator) will likely cut rates in 2024. Making mortgage rates come down.

And what is a dancing sandwich??