While the Nestea plunge was meant to be refreshing, the housing starts plunge is not refreshing at all. Just another warning about the shortcomings of Bidenomics.
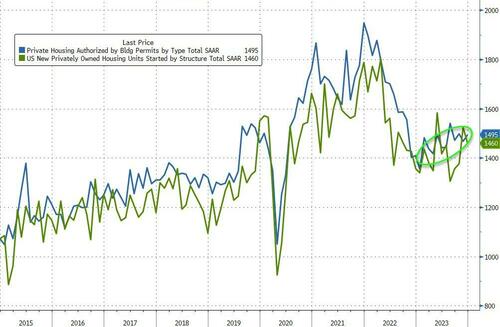
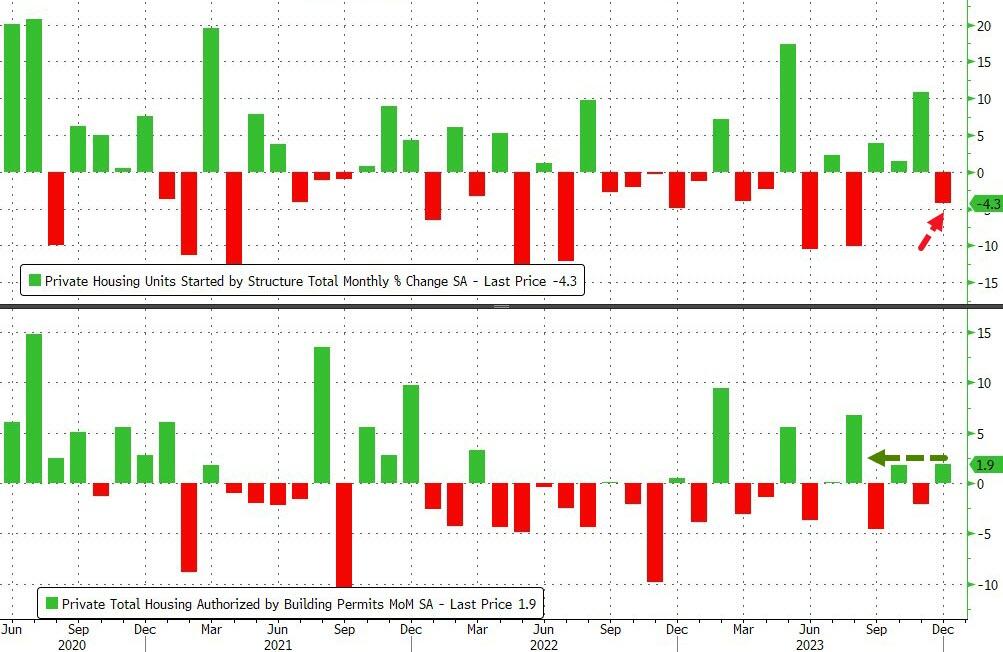
Analysts were right in direction but wrong in magnitude – too bearish. Housing starts declined 4.3% MoM (vs -8.7% MoM exp and +10.8% MoM in November, a big downward revision from the initial +14.8% MoM). Building permits also rose more than expected (+1.9% MoM vs +0.6% exp but saw November’s 2.5% MoM decline upwardly revised to -2.1% MoM…
Source: Bloomberg
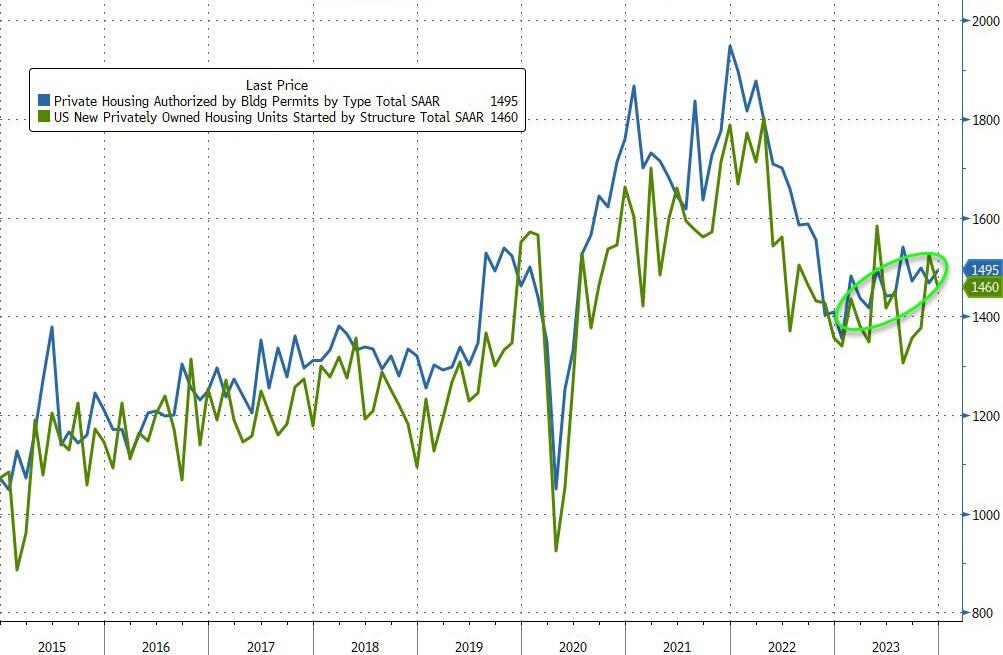
On a SAAR basis, Housing Starts and Building Permits are higher YoY
Source: Bloomberg
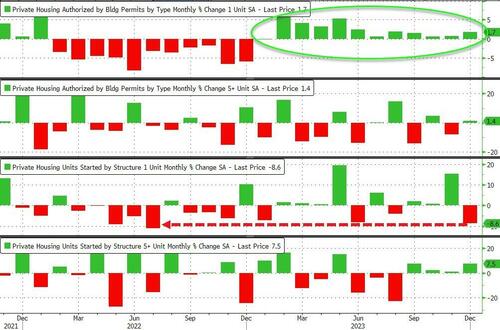
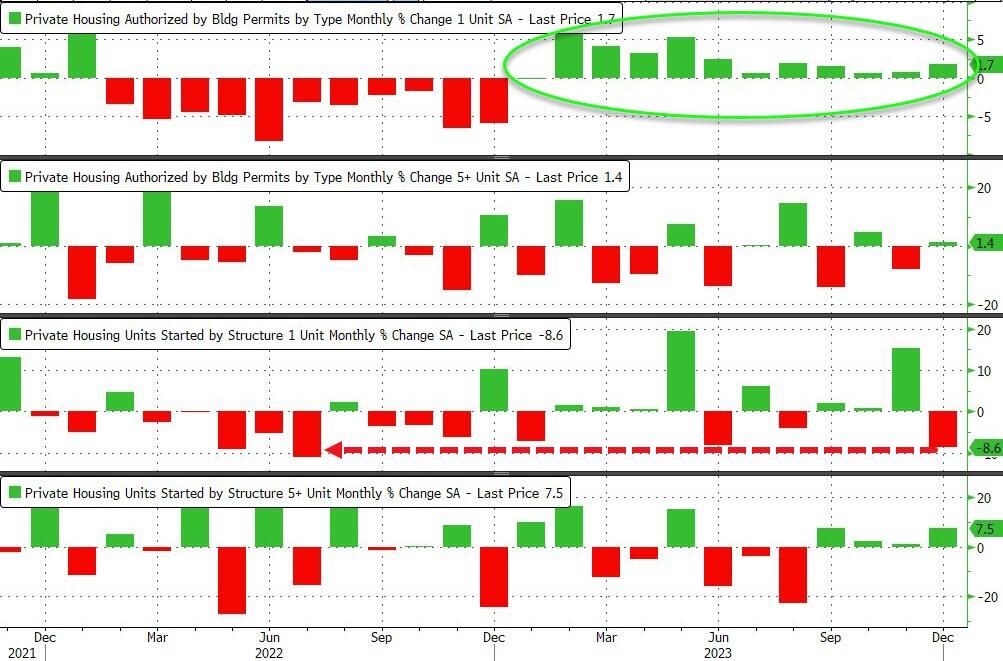
Under the hood, single-family permits rose for the 12th month in a row (i.e. every month in 2023) but single-family home starts plunged 8.6% MoM after surging 15.4% MoM in November… that is the biggest monthly decline since July 2022…
Source: Bloomberg
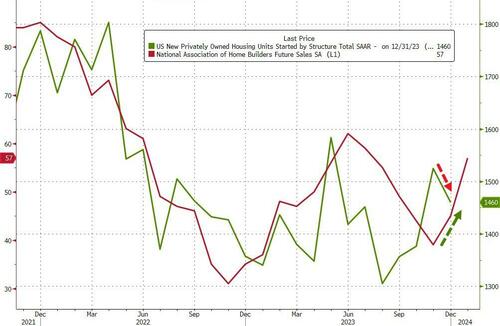
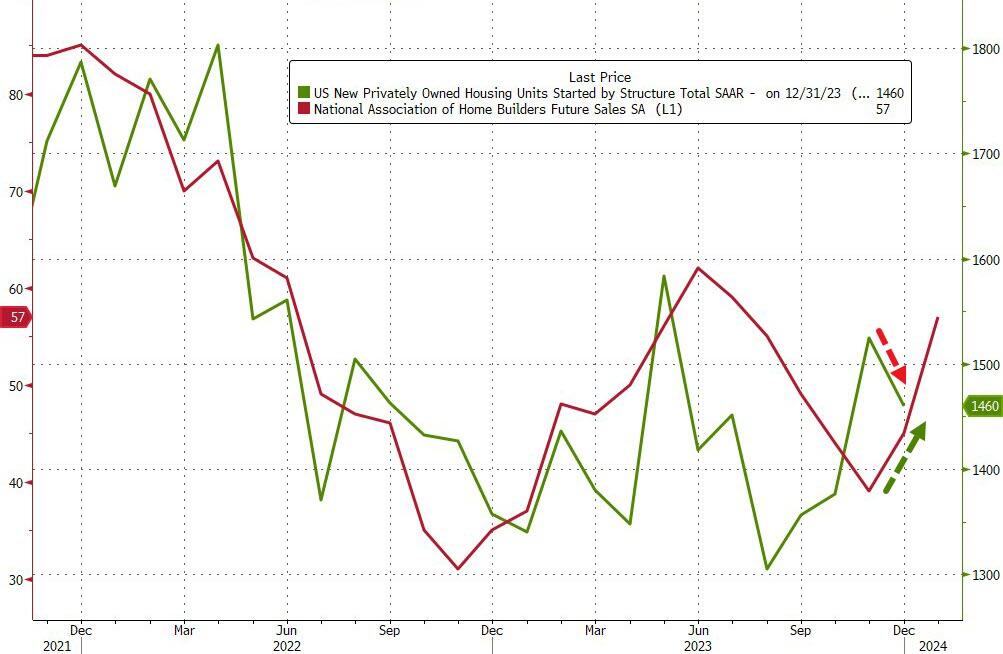
Perhaps the optimism among homebuilders about future sales is a little overdone given their actions?
Source: Bloomberg
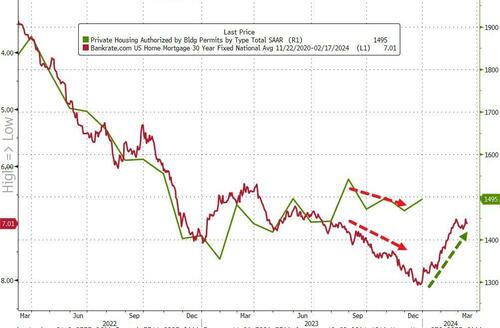
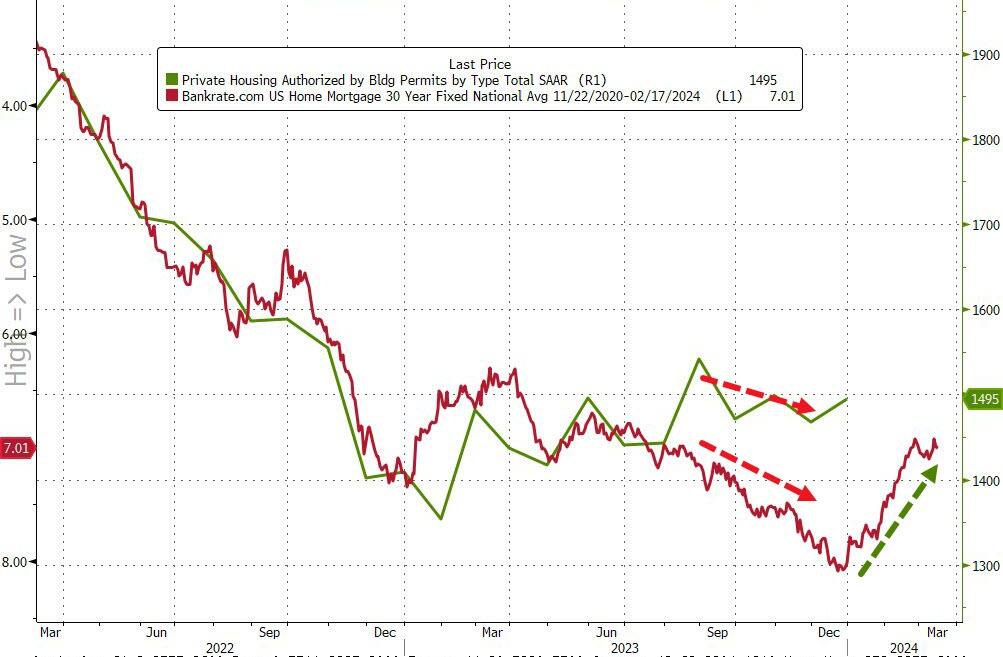
And why would starts be down so much if rates are tumbling?
Source: Bloomberg
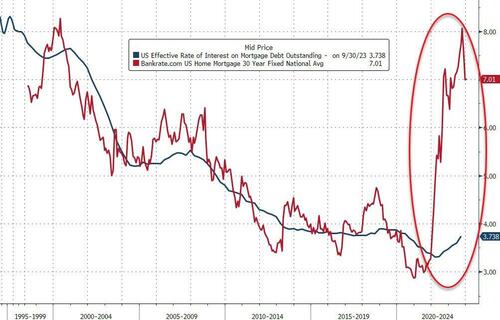
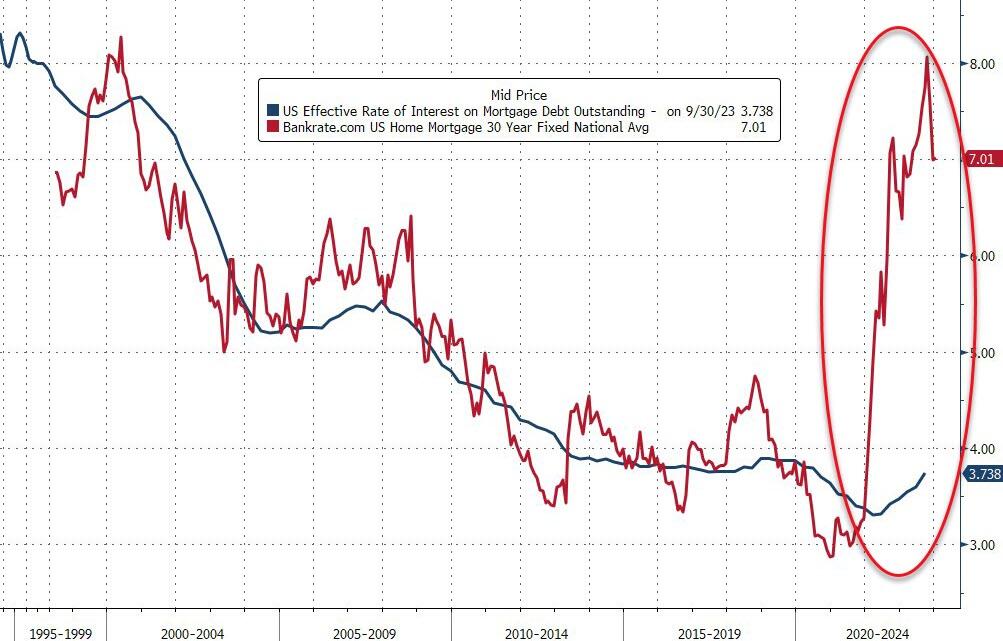
Still along way to go for mortgages to be affordable…
Source: Bloomberg
Will less supply of new homes do anything to help the Shelter component of CPI (hint – no!).
Housing is simply unaffordable under Bidenomics, a strange brew of big corporate green subsidies, political handouts (any wonder why Biden is forgiving student loans in an election year?) and bad Fed policy errors.
But young Americans don’t always have a sugar daddy like Hunter Biden has who are willing to pay for rent for political parasites like those in Washington DC.
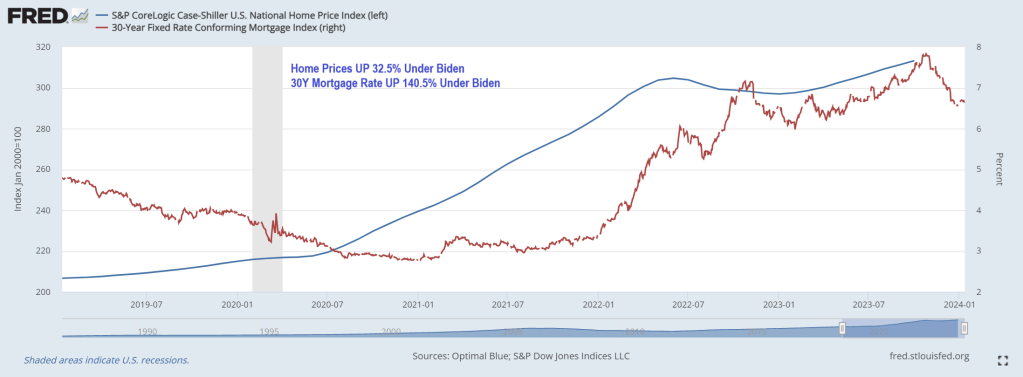
Young adults used to dream of moving out of their parents’ homes and into their own apartments, but living alone has become a luxury not everyone can afford. Not surprising, since home prices under Biden have risen 32.5% while 30-year mortgage rates are up a staggering 140.5% under Clueless Joe.
But in growth terms (year-over-year), White House Propagandists Karine Jean Pierre and John Kirby will no doubt focus on the cooling of housing prices and mortgage rates … although both are reaccelerating.
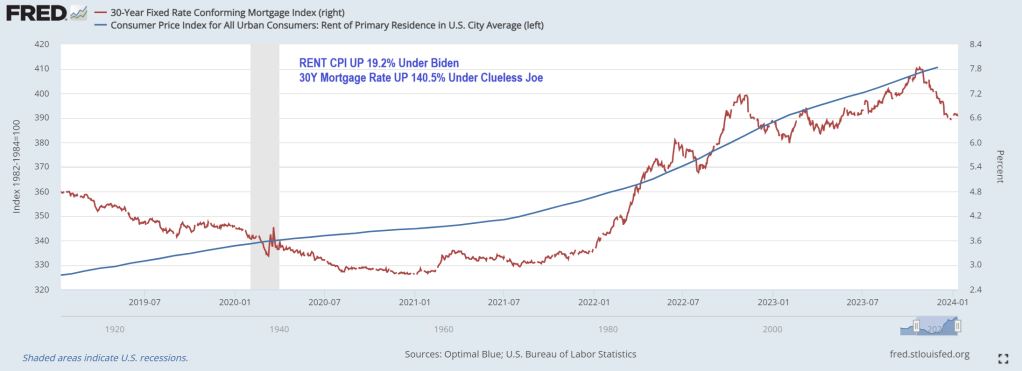
Rent CPI is up 19.2% under Clueless Joe.
How does this impact younger Americans? According to a recent study by Intuit Credit Karma, 31% of Gen Zers are living with their parents because they can’t afford to rent or buy their own place. Overall, 11% of American adults still live at home with their parents.
“The current housing market has many Americans making adjustments to their living situations, including relocating to less-expensive cities and even moving back in with their families,” said Courtney Alev, a consumer financial advocate at Intuit Credit Karma.
Even young adults who live alone are reconsidering their living arrangements because costs are too high.
About a quarter (27%) of Gen Zers reported that they could no longer afford rent and 25% said they’ll have to move back in with family to make ends meet.
Millennials are in the same boat: 30% say rent is unaffordable, and 25% are thinking about moving back in with their parents.
The research is consistent with a 2021 study conducted by the U.S. Census Bureau, which showed that one in three adults ages 18 to 34 live with their parents.
In a 2022 study, Pew Research also found that the percentage of Americans living with their parents has increased steadily since 2000. Pew calls these living arrangements “multigenerational households,” and said young adults ages 25 to 29 are most likely to cohabit with their parents.
Different studies, but all tell the same story: Finances are the top reason young adults are still living with family.
Housing and rental costs rise
It’s hardly surprising that young adults are struggling to make ends meet. Housing costs and living expenses have skyrocketed since the pandemic, and younger generations have faced the most financial hardship.
As Creditnews Research reports, Millennials and Gen Zers have been locked out of homeownership due to rising home prices, elevated interest rates, and stagnant real wages (adjusted for inflation).
For example, in 2023, Millennials accounted for only 28% of homebuyers despite being in their prime home-buying age. Gen Zers barely made a dent in the housing market, accounting for a paltry 4% of all buyers.
According to Fed data, average home prices were $431,000 as of the third quarter of 2023.
The rental market isn’t much better. Although rent costs have declined for three straight months, landlords are still asking for $1,964 per month on average, per Redfin data. Average rents were below $1,650 at the start of Covid.
But the problem of surging rents goes back much longer than that. According to a report from Moody’s Analytics, rent prices grew 135% between 1999 and 2022, while average incomes for all age groups were up 77% over the same period.
In terms of earning potential, younger generations are at the lower end of the totem pole, so they’re more likely to be affected by rising rent prices.
Where’s the “strong economy” everyone always talks about?
While the U.S. economy has steered clear of recession and unemployment remains near historic lows, Americans are still struggling to afford basic expenses. This is especially true for younger generations.
A 2023 study conducted by Deloitte found that more than half of Millennials and Gen Zers were living paycheck to paycheck. Perhaps shockingly, 37% of Millennials and 46% of Gen Z reported taking another part-time or full-time job just to afford their bills.
Working longer hours and barely scraping by is one of the main reasons why younger adults feel they’re worse off financially than their parents were at their age.
An August 2023 study conducted by The Harris Poll found that 74% of Millennials and 65% of Gen Zers believe they are starting further behind financially than previous generations.
“They’re telling us they can’t buy into that American dream the way that their parents and grandparents thought about it—because it’s not attainable,” said The Harris Poll CEO John Gerzema.
Remember, Clueless Joe Biden is in charge!(or Obama, take your pick).
Well, we have news for you: if 2023 was bad, 2024 – an election year of course – is shaping up to be far worse.
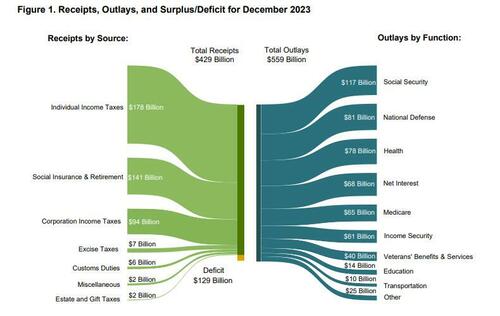
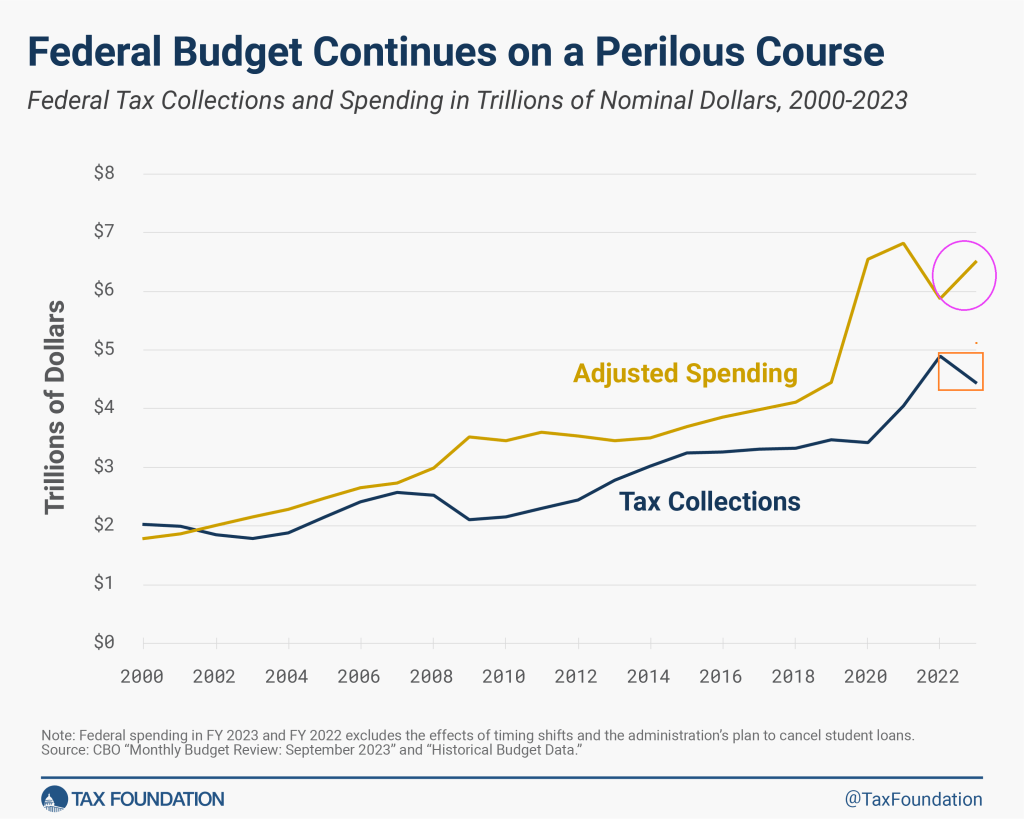
Moments ago the US Treasury reported the budget deficit picture for December and it will come as no surprise to anyone that the US has continued to spend like a drunken sailor, or rather, even more. As shown in the chart below, in the month of December, the US collected $429 billion through various taxes, while total outlays hit $559 billion…
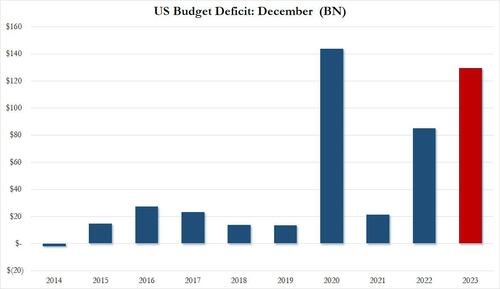
… resulting in a December deficit of $129.4 billion.This may not sound like a lot, but December is actually one of those months when the US deficit is relatively tame, or used to be.
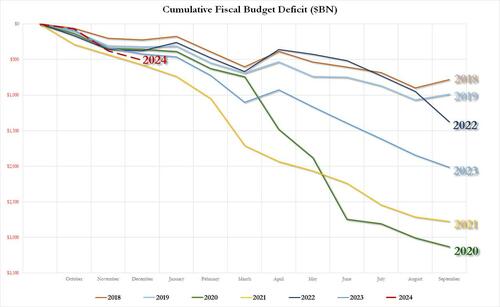
As shown in the next chart, traditionally the December deficit was barely in the $10-20BN range… until 2020 when it exploded to an all time high of $140BN. And while it dropped sharply in 2021, it rebounded dramatically in 2022, and rose to just shy of the December crisis high last month!
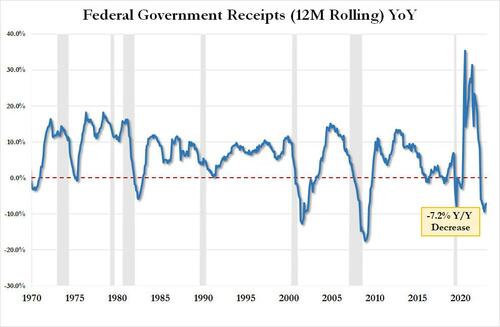
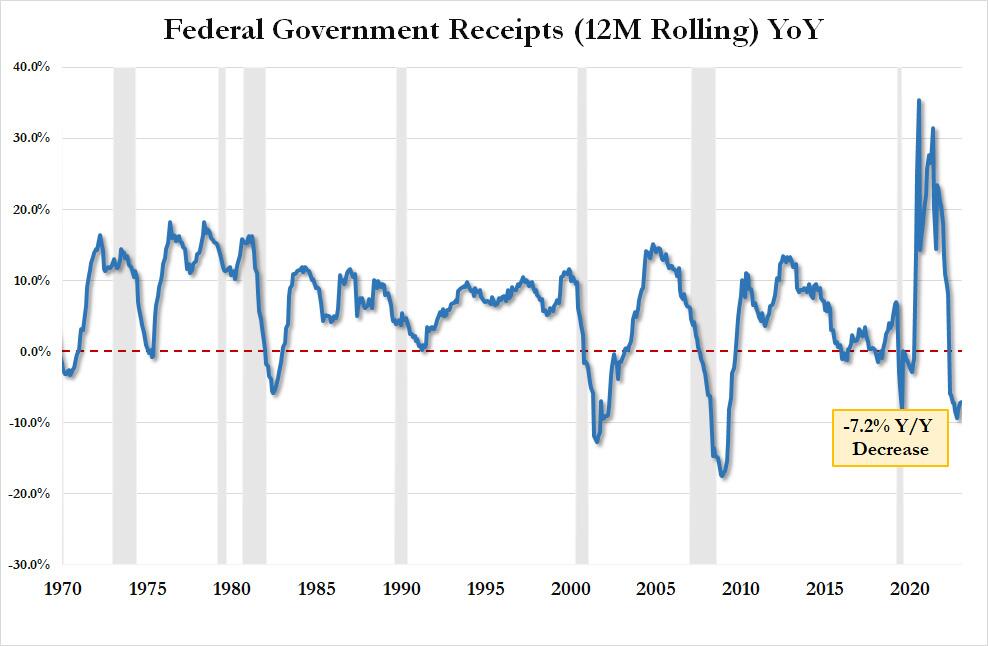
Here is some more context: tax receipts of $429.3BN in December were down 5.6% from the $454.9BN in December 2022 and down a whopping 11.8% from December 2021. On an LTM basis, US total tax receipts were $4.521TN, or down 7.2% YoY. This is now the 9th consecutive YoY decline in LTM tax receipts, something that historically has only taken place when the US was in a recession. As an aside, the “smart economists” were certain that the collapse in tax receipts would reverse after November when the postponed California taxes would be collected. Well, November has come and gone and the big picture is just as ugly.
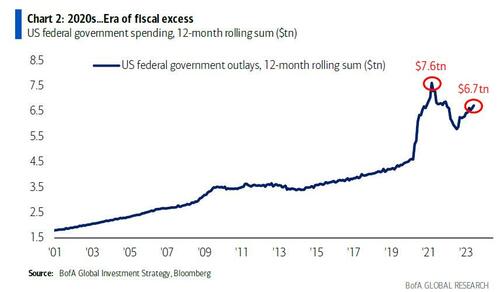
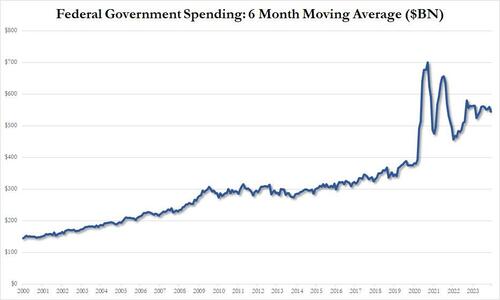
Looking at outlays, unlike tax receipts, there is danger of a decline… ever; and indeed in December the US spent a total of $559 billion, up 3.5% from the $540BN spent a year ago, and up even more from the $508BN in 2021. On a 6 month moving average basis, we are rapidly approaching the exponential phase even when accounting for the spending burst in 2020 and 2021.
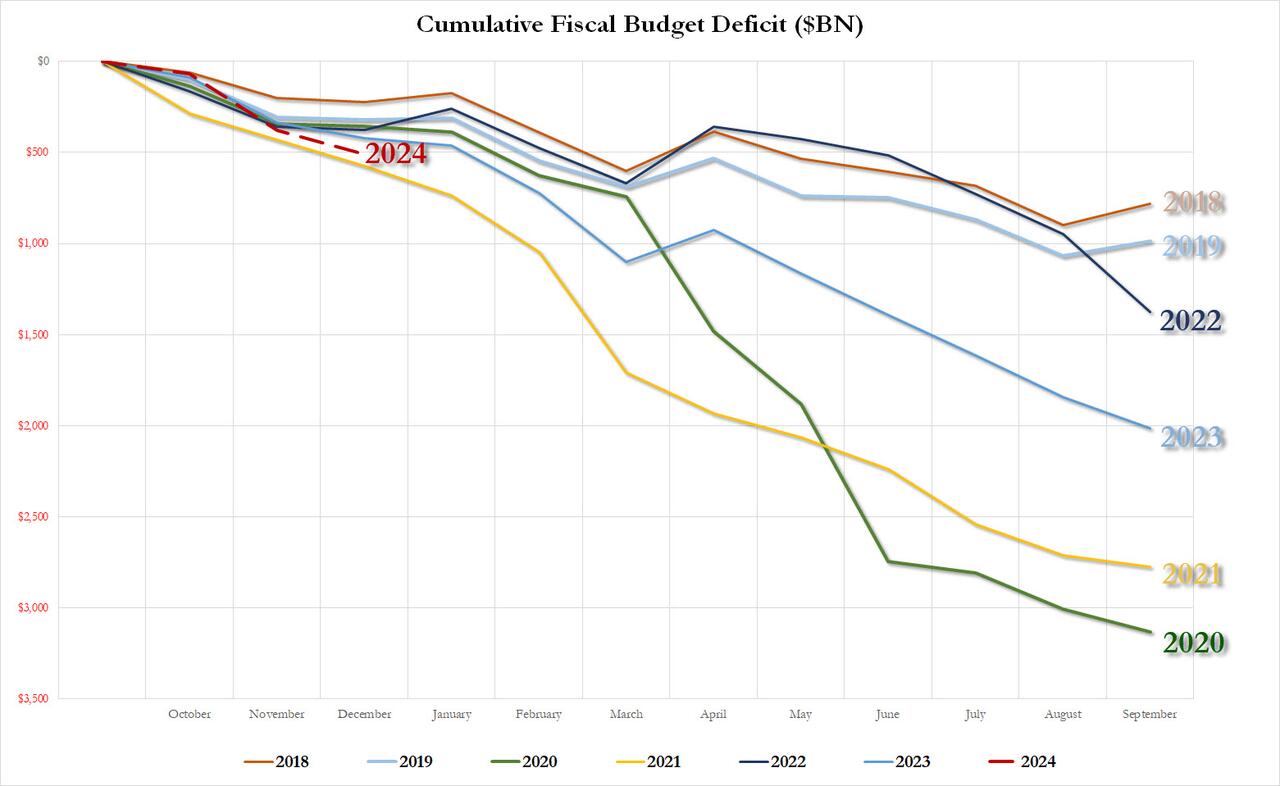
Putting it all together, we get the scariest chart of all: the YTD budget deficit three months into fiscal 2024 is already $509 billion, which would be the biggest deficit in US history after one quarter with the exception of the covid outlier year of 2021 when the US injected multiple trillions in stimmies.
As for the final, and most shocking, data point, the December budget deficit of $129.4 billion was more than $40BN higher than the $87.5BN median estimate, and was more than 50% higher compared to the $85BN December deficit in fiscal 2022.
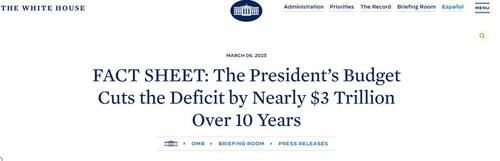
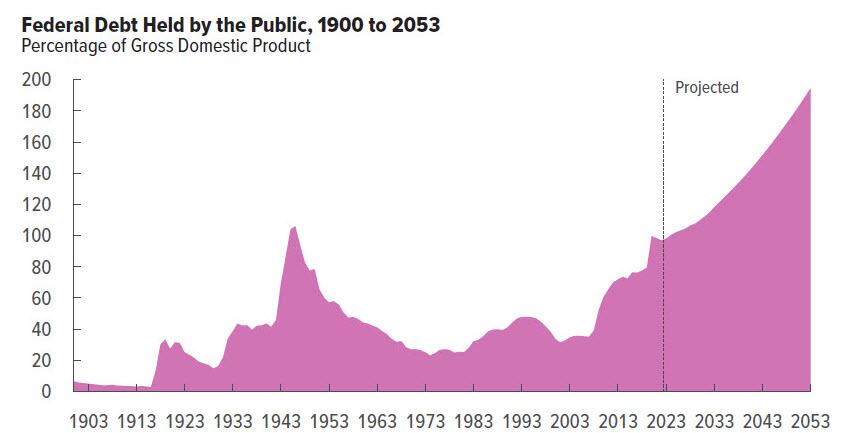
Needless to say, this is completely unsustainable and assures fiscal collapse for the US, not if, but when. Then again, we already knew this thanks to the CBO which was kind enough to chart the endgame:
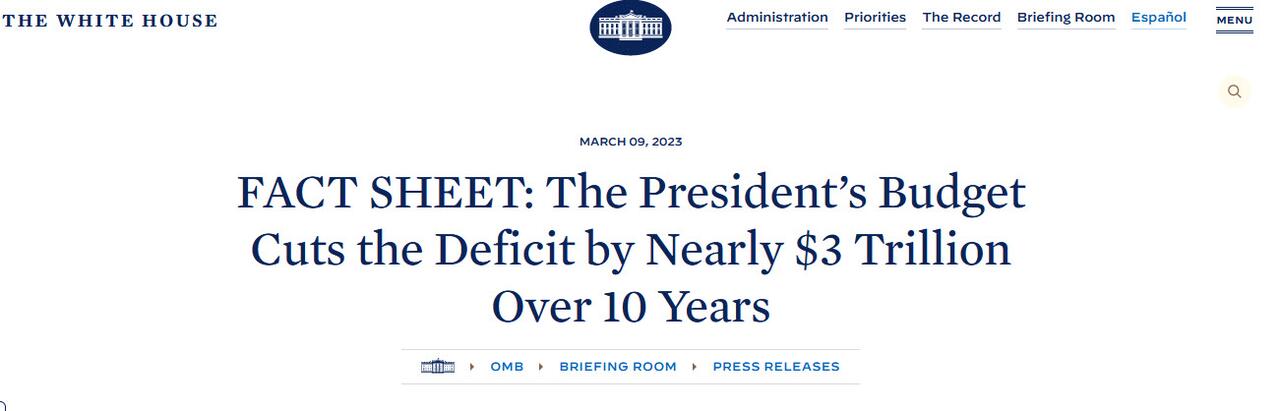
What is funniest about all this is that the US is on an accelerating path to ruin less than one year after the imposter in the White House published this laughable propaganda.
We can’t wait to see what really happens to the budget deficit over the next 10 years. Spoiler alert: there won’t be a happy ending.
Unfortunately, that period of relative stability appears to be ending.
The pace of layoffs really seemed to pick up steam at the end of 2023, and the outlook for the coming year is not promising at all. In fact, a survey that was just conducted by Resume Builder discovered that a whopping 38 percent of U.S. companies anticipate that they will conduct layoffs in 2024…
38% of companies say they are likely to have layoffs in 2024
52% are likely to implement a hiring freeze in 2024
Half say anticipation of a recession is a reason for potential layoffs
4 in 10 say layoffs are due to replacing workers with artificial intelligence (AI)
3 in 10 companies reducing or eliminating holiday bonuses this year
If you currently have a job that you highly value, try to hold on to it as tightly as you can.
Because the employment market is starting to shift in a major way.
Nike has announced a $2 billion cutback over the next three years, with an uncertain number of job cuts included. Toy giant Hasbro will cut nearly 20% of its workforce in 2024, according to reports from the Wall Street Journal. Music service Spotify announced a third round of layoffs. A recent email from CEO Daniel Ek says the company plans to cut its workforce by nearly 20%. Roku is going to be limiting new hires, and laying off about 10% of its workforce, while Amazon layoffs are effecting its new gaming division (all 180 jobs there are being eliminated). Citi CEO Jane Fraser announced layoffs in September, and sources have told CNBC that the bank could let go of at least 10% of its workforce, across several business lines. Flexport Logistics plans to cut up to 30% of its employees, and financial services company Charles Schwab is cutting back by 5-6% of its workforce, according to reports from Business Insider.
Unfortunately, this is just the tip of the iceberg.
With the continued rise of online shopping, along with record inflation, it’s no wonder that retailers are suffering steep financial losses. Unfortunately, this means that companies all across the U.S. are downsizing brick-and-mortar storefronts to make ends meet. In 2023, we’ve seen closures from big-name retailers and local shops alike—and the shutdowns don’t appear to be easing up anytime soon.
More than 3,000 retail locations were shut down in 2023, but that is nothing compared to what is coming…
According to UBS equity analyst Michael Lasser, the U.S. remains over-retailed. Lasser estimated that the U.S. will shed almost 50,000 retail stores by 2028. He cites rising operating costs and a higher proportion of e-commerce sales, causing retailers to look closely at store locations and performance.
Can you imagine what our communities will look like if that projection is even close to accurate?
As economic conditions deteriorate, people are going to get more desperate and the conditions in our streets will become even more chaotic.
A mob of over 100 looters purposefully crashed a Kia into a small bakery in Compton, Calif., before they flooded in and ransacked the store during a night of rampage on the streets earlier this week.
The thieves had gathered in the area for an illegal street takeover around 3 a.m. Tuesday before making the mile-long trek to Ruben’s Bakery & Mexican Food.
When they got to the locked store, a white Kia backed into the front doors, clearing an entryway for the crowd of pillagers to get to their loot.
And so it goes. Lawlessness is bad for retail businesses. Not to mention the morale of US citizens.
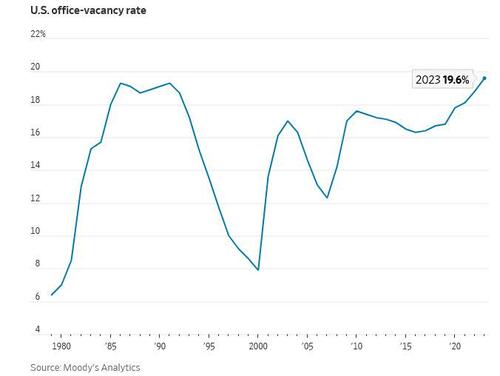
And then we have the office market. The office space vacancy rate in the US has reached its highest level since 1979. In the fourth quarter of 2023 19.6% of office space in major US cities was not leased according to data collected by Moody’s Analytics.
The increase in remote work since the COVID-19 pandemic has caused a large decline in demand for office space, despite increasing attempts to get Americans back in the office. What’s more, on the demand side the stock of office space in the US is the result of earlier booms in commercial real estate construction. The last boom took place between 2012 and 2017, when demand for commercial real estate loans strengthened. On the supply side, lending standards loosened between 2012 and 2015. This era coincides with a strong rise in the commercial real estate price index, which may have motivated banks to expand lending. Loan standards tightened during the pandemic, then loosened again when the economy rebounded, but have tightened since 2021.
Since the Great Recession, commercial real estate prices have more than doubled in nominal terms, but have moved sideways since 2021. This suggests that prices have reached a plateau. However, in recent years inflation has obscured the movement of commercial real estate prices in real terms, which shows a peak in 2021, but since then there has been a decline, almost to the level during the COVID-19 pandemic. In other words, commercial real estate prices are already failing to keep up with inflation. Is this an indication that the commercial real estate bubble is already deflating? With nominal commercial real estate prices remaining elevated, most of the nominal price correction is likely still to come. Since small banks are heavily exposed to commercial real estate, the enduring problems at small banks and the fragility of commercial real estate could provide a dangerous mix that could explode during a recession. For more details, we refer to The commercial real estate-small bank nexus.
I noticed that The Administration has handed propaganda duties off to John Kirby and relegated KJP to relief pitching away from Peter Doocey!
Joe Biden can be called “Sloppy Joe” because of the economic havoc he has sprung on an unsuspecting middle class. The following seven charts are what keeps me up at night (unlike what keeps multimillionaire Michelle Obama up at nights).
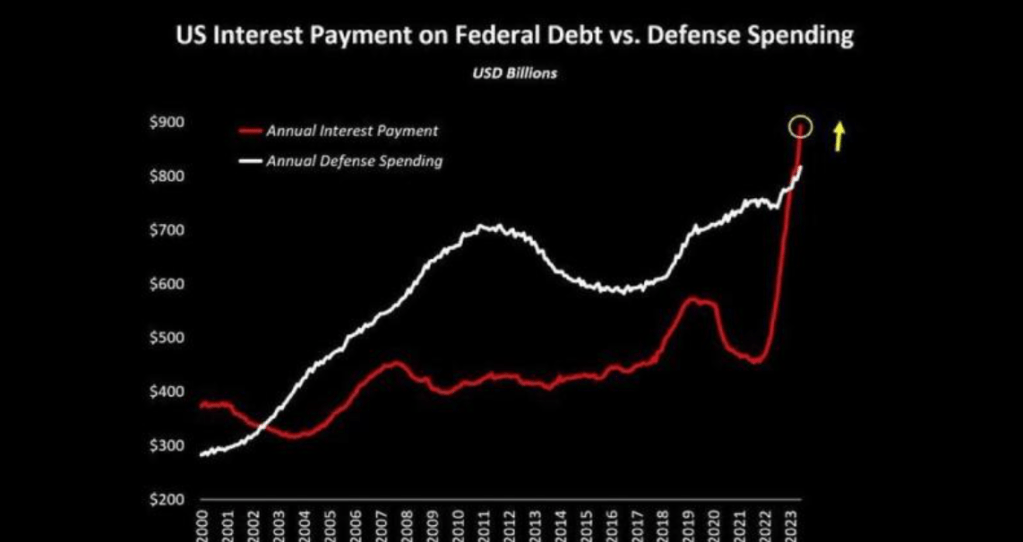
First, US interest payment on Federal debt is rising faster than our bloated military budget. Thanks mostly to The Fed raising rates to fight inflation under Biden.
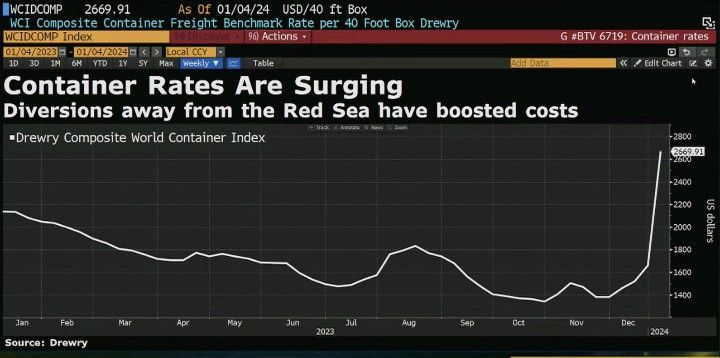
Second, contrainer shipping rates are soaring thanks to Iran’s interference in the Middle East and Biden’s failed diplomacy with Iran.
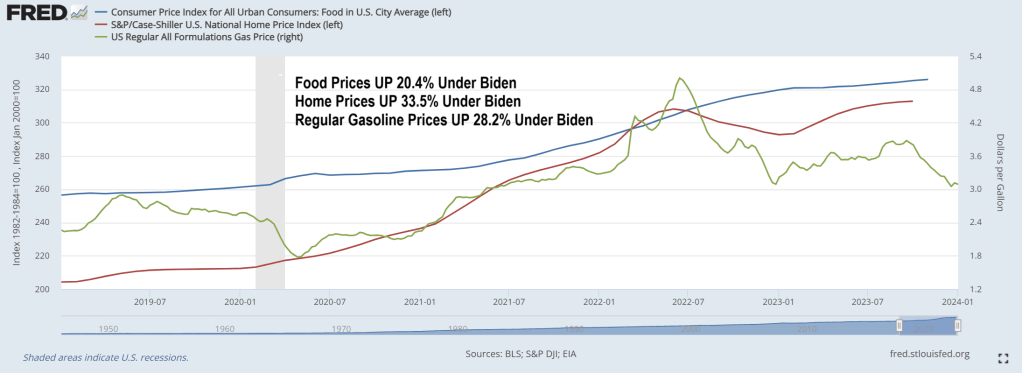
Third, food prices are over 20% more expensive under Biden while gasoline prices are over 28% more expensive under Biden. Housing is also more expensive under “Sloppy Joe” as in 33.5% more expensive.
Fourth, Bidenomics is about adding more non-productive government jobs.
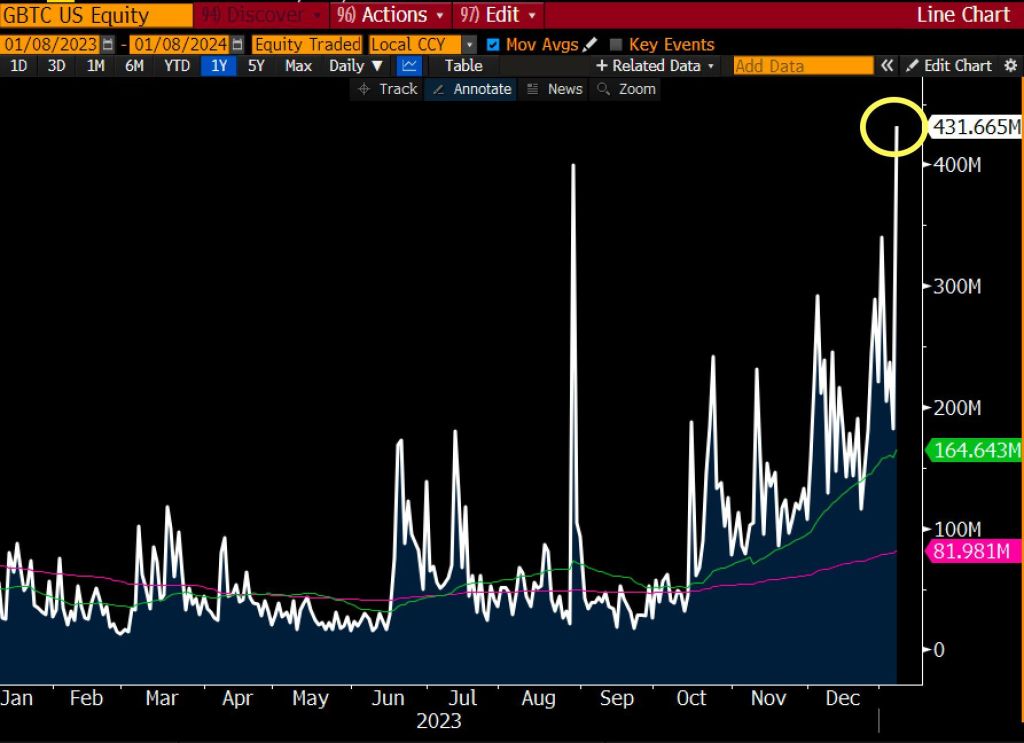
Sixth, Grayscale Bitcoin Trust $GBTC traded close to half a billion on Monday. Which shows the lack of confidence in Biden’s handling of the economy.
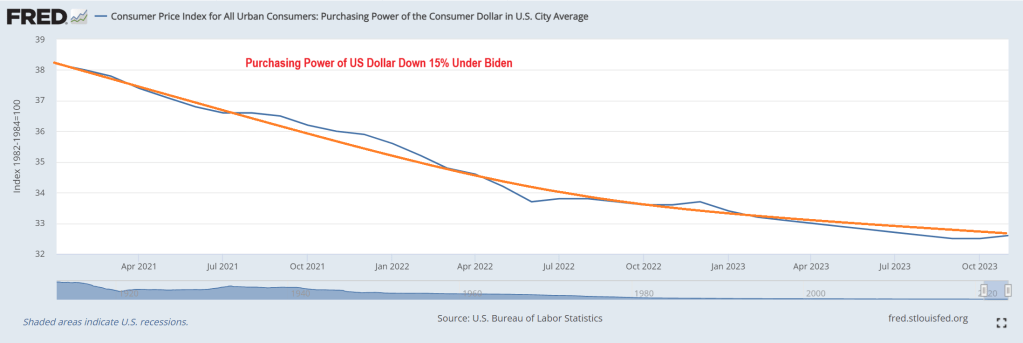
Seventh, purchasing power of the US Dollar is down 15% under Sloppy Joe.
While some may view Biden’s policies are planned destruction of the US economy, it could simply be that Biden (who is one of the stupidest people in Washington DC) simply is grossly incompetent and … sloppy.
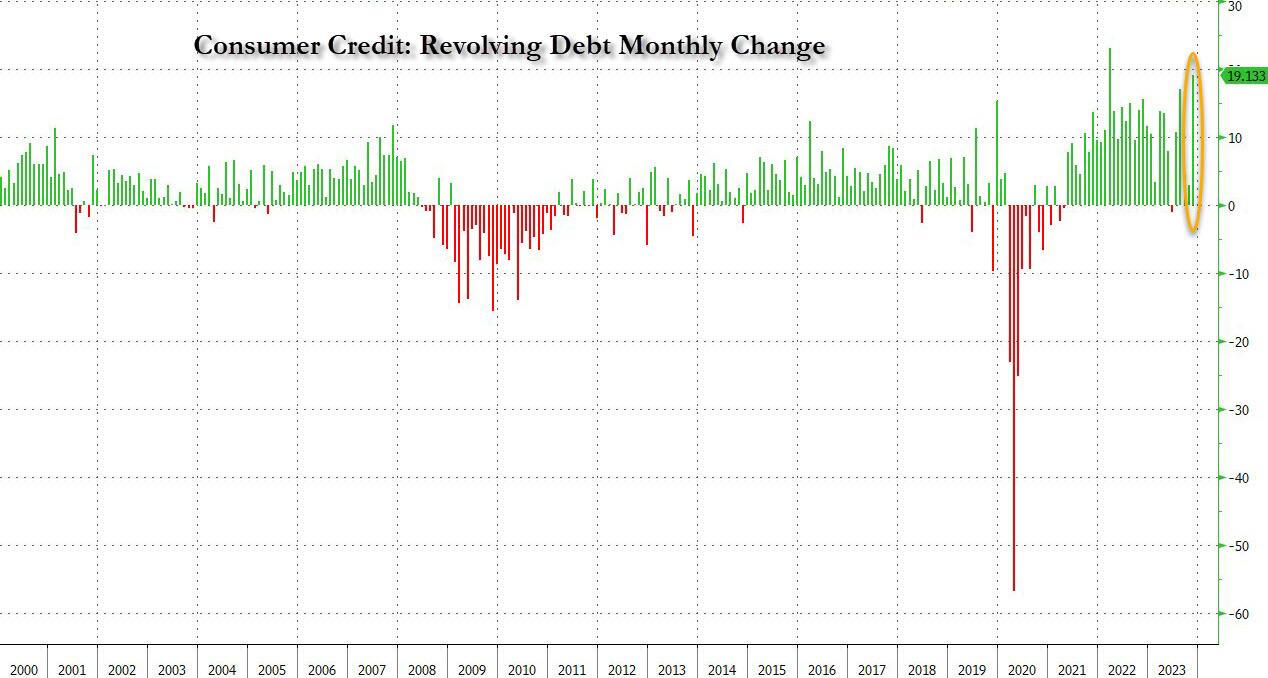
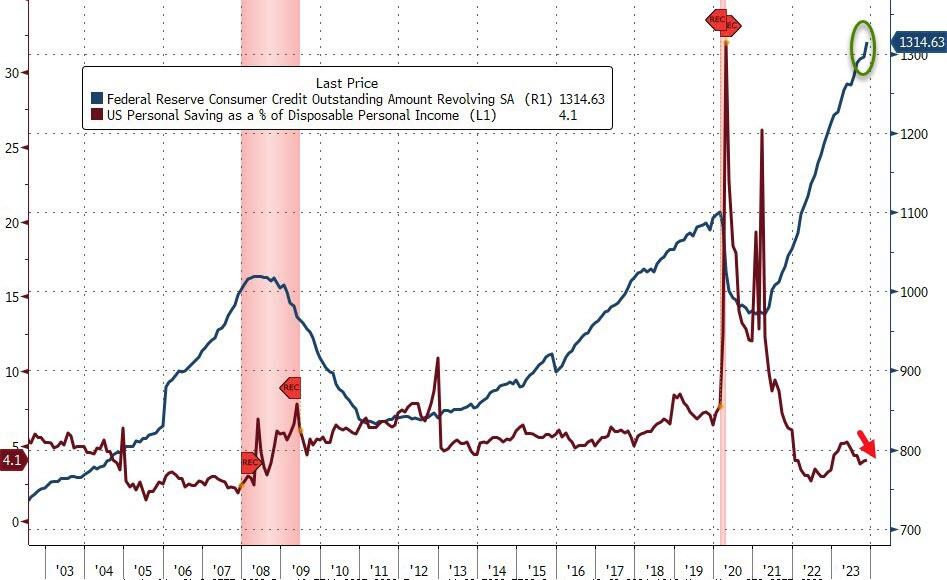
Bidenomics has taken the US economy to the underworld. Where households have to run up credit cards to ridiculous levels to cope with inflation under Bidenomics. Under Bidenomics, food prices are up 20.4%, home prices are up 33.5% and regular gasoline prices are up 28.2%. Whip out those credit cards!!!!!
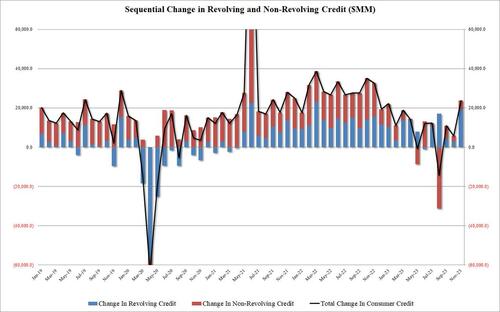
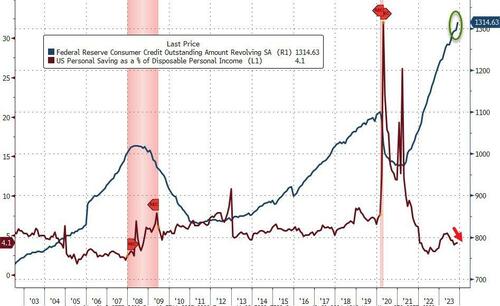
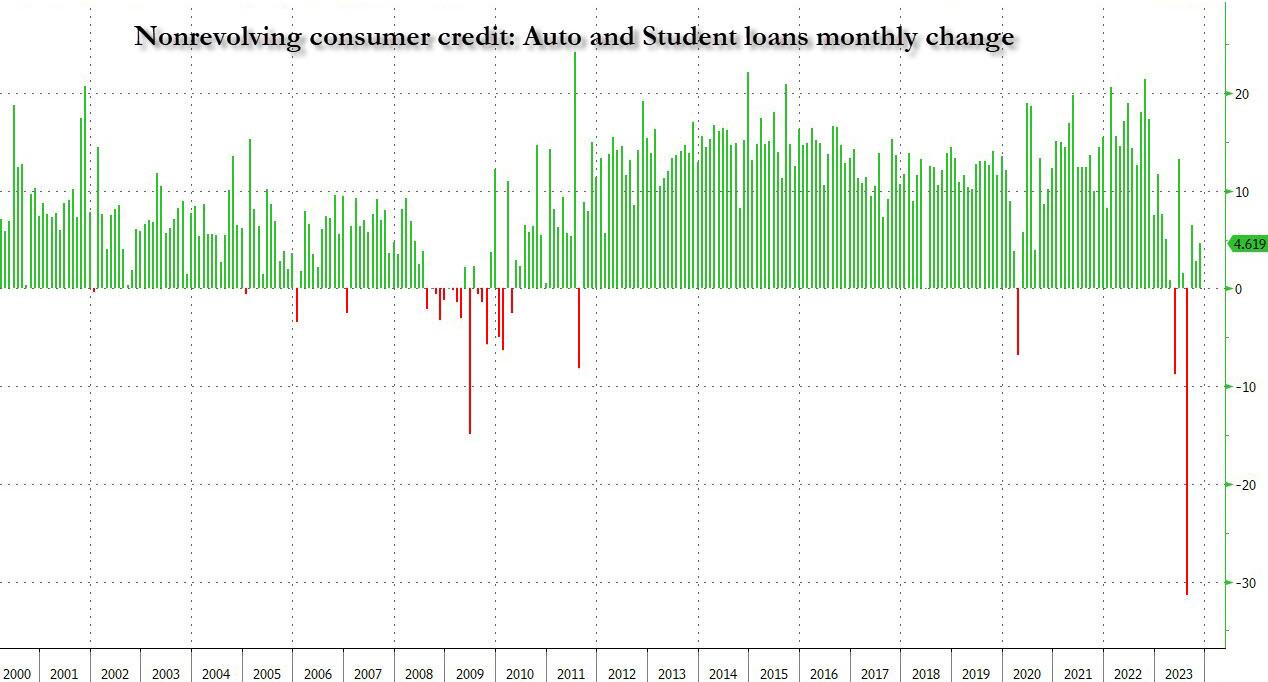
According to the latest monthly consumer credit report from the Fed, in November, consumer credit exploded higher by $24.75BN, blowing away expectations of a “modest” $9BN increase after the surprisingly subdued $5.8BN (upward revised from $.5.1BN) in October and the $4.3BN average of the past 6 months. This was the biggest monthly increase since last November, and was the first $20BN+ print since Jan 2023.
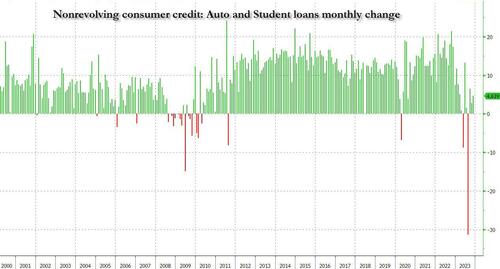
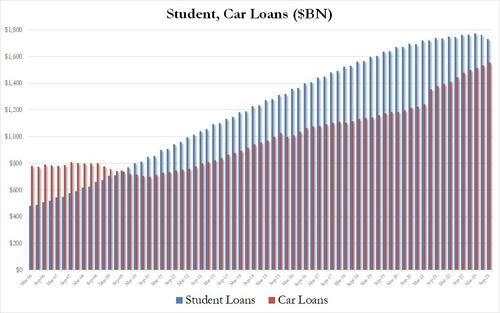
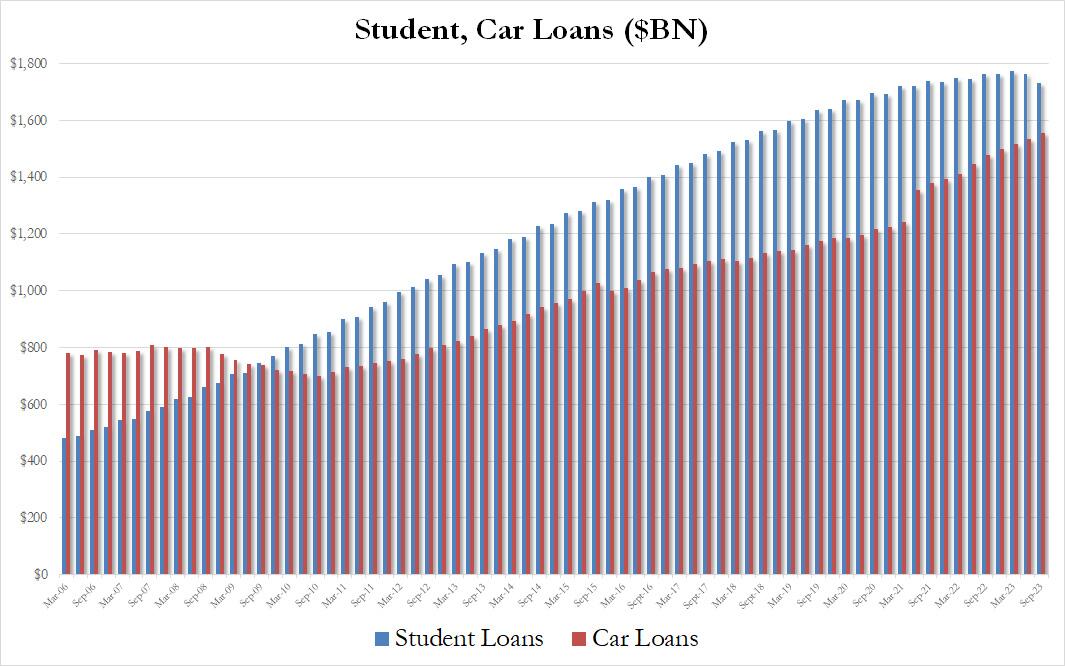
When looking into the details we find something remarkable: while non-revolving credit rose a modest $4.6BN…
… in keeping with the subdued increase in recent months as rates on auto loans make them prohibitive for most consumers while student loans are actually shrinking for the 2nd quarter in a row…
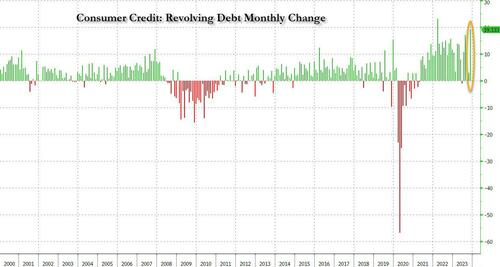
… what was the big shock in today’s data was the blowout surge in revolving credit, which in November exploded by a whopping $19.133BN, a record surge from the $2.9BN in October, and the second biggest monthly increase in credit card debt on record!
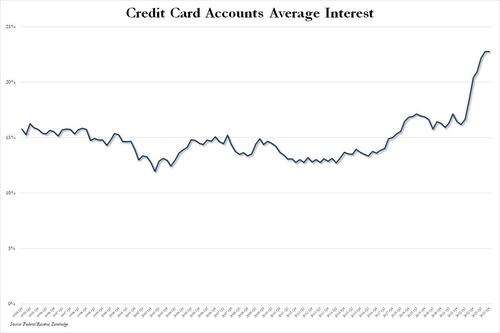
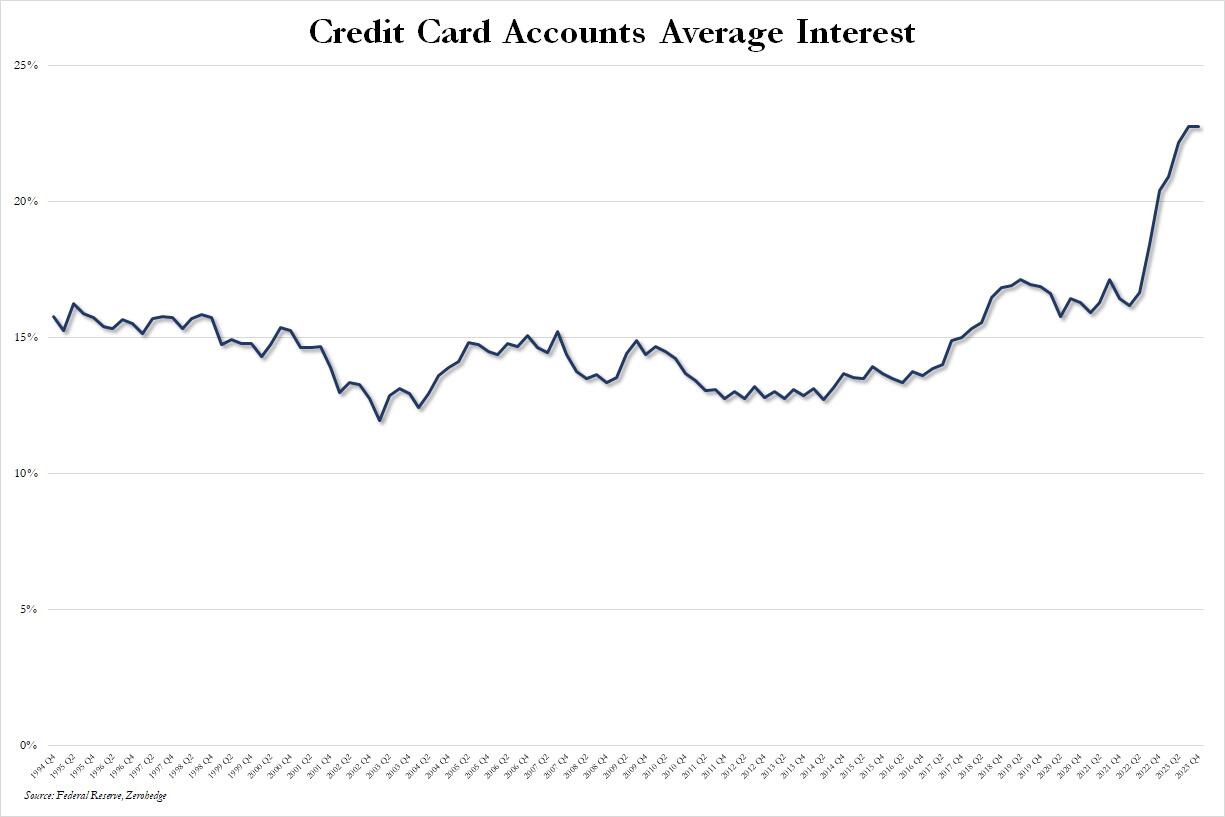
This, despite the average interest rate on credit card accounts in Q4 flat at a record high 22.75% for the second quarter in a row.
What is especially surprising about this conirmation that the bulk of holiday spending was on credit is that it takes place after several months of relative return to normaly, when consumers appeared increasingly reluctant to max out their credit cards due to record high rates, and at a time when the personal savings rate in the US has collapsed back near multi-decade lows in recent months.
Well, it now appears that Americans have once again done what they do so well: follow in the footsteps of their government and throw all caution to the wind, charging everything they can (and whatever they can’t put on installment plans which also hit a record late last year) including groceries, on their credit card, and praying for the best… or not even bothering to worry about what comes next.
That means its initial jobs results were inflated by 439,000 positions, and the job market is not as healthy as the government suggests.
Since the government wiped out 439,000 jobs after the fact, the total percentage of jobs created by the government last year is even higher.
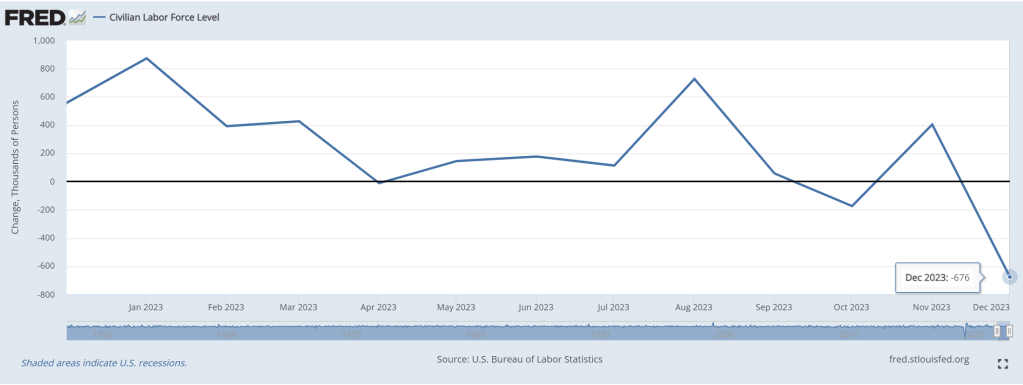
But just in December, the civilian labor force shrunk by 636,000 jobs.
Increased government hiring has been driving the jobs numbers higher. This is NOT good since government doesn’t produce anything other than regulations and red tape.
Again, the government sector in December ranked high in job creation.
The health care and social assistance sector, which relies heavily on money from government spending, created about 59,000 jobs.
The economy lost 1.5 million full-time workers since June of last year, while adding 796,000 part-time workers.
That means more workers are holding down multiple jobs to pay for a higher cost of living due to a cumulative 17.4% inflation rate under this White House.
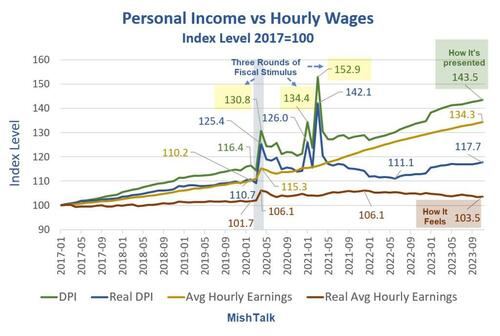
Income is rising and so are wages. Even real income is up. But real wages are another matter.
Personal income data from the BEA, hourly wages from the BLS, real hourly earnings and chart by Mish.
Personal Income vs Hourly Wages Notes
DPI means Disposable Personal Income. Disposable means after taxes.
Real DPI means inflation adjusted using the Personal Consumption Expenditures (PCE) deflator. Real DPI is a BEA calculation.
Average hourly earning are for production and nonsupervisory workers.
Real wages are deflated by the Consumer Price Index (CPI) not the PCE.
The BLS does not report a real hourly wage. I used the CPI-W index for production and nonsupervisory workers, produced by the BLS, as the deflator.
Personal Income Definition
The BEA defines personal income as “Income that people get from wages and salaries, Social Security and other government benefits, dividends and interest, business ownership, and other sources.”
Rental income is a part of other sources.
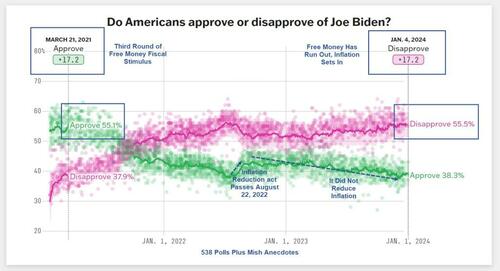
Three Rounds of Fiscal Stimulus
Round 1, March 2020: $1,200 per income tax filer, $500 per child(CARES Act) – Trump
Round 2, December 2020: $600 per income tax filer, $600 per child (Consolidated Appropriations Act, 2021) – Trump
Round 3, March 2021: $1,400 per income tax filer, $1,400 per child (American Rescue Plan Act) – Biden
The three rounds of free money fiscal stimulus (literally a helicopter drop), plus eviction moratoriums put an unprecedented amount of money in people’s hands. In addition, unemployment insurance paid people more to not work than they received working.
The third round of stimulus under Biden was totally unwarranted. However, it is also worth noting that Trump wanted a much bigger second stimulus package than the Republican Congress gave him. Trump is no fiscal hero.
The three stimulus packages, on top of supply chain disruptions, energy disruptions due to the war in Ukraine, and Bidenomics in general, set in motion the biggest wave of inflation in over 30 years.
Biden went from an approval rating of 17.2 percent to a disapproval rating of 17.2 percent.
Peak Free Money
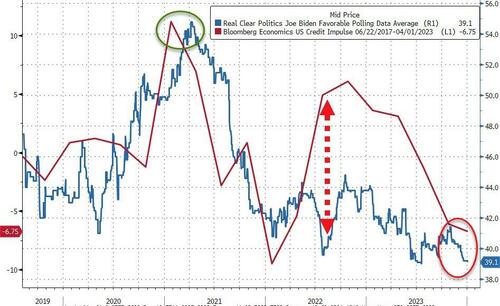
In addition to declining real wages, perhaps Biden’s big problem is the free money has run out.
Biden’s popularity peaked in March of 2021 along with stimulus. Was that a honeymoon impact or peak free money?
[ZH: While not a perfect indicator, the lagged US credit impulse perhaps provides a proxy for US fiscal excess and when overlaid with Biden’s approval rating, it is clear that 2022’s re-acceleration did nothing for people’s faith in him… and it’s only got worse…]
I suspect a bit of each coupled with hope of more free money, especially student loan forgiveness.
Sending free money to Israel and Ukraine does not help perceptions of how Biden is doing. And neither does the border or ridiculous energy regulations that cost people money.
Biden keeps telling people what a great job he has done.
I don’t believe it and most don’t either. And that shows up in the polls no matter what reason you assign.
Can Biden scrounge up some more stimulus? Because the private sector is not doing well under “Open Borders Biden.”
But to quote Cousin Eddie from Christmas Vacation, “Now hold on to your wad.” While the headline screamed remarkable, please note that the civilian labor force actually declined. As did the Employment-population ratio (to 60.1).
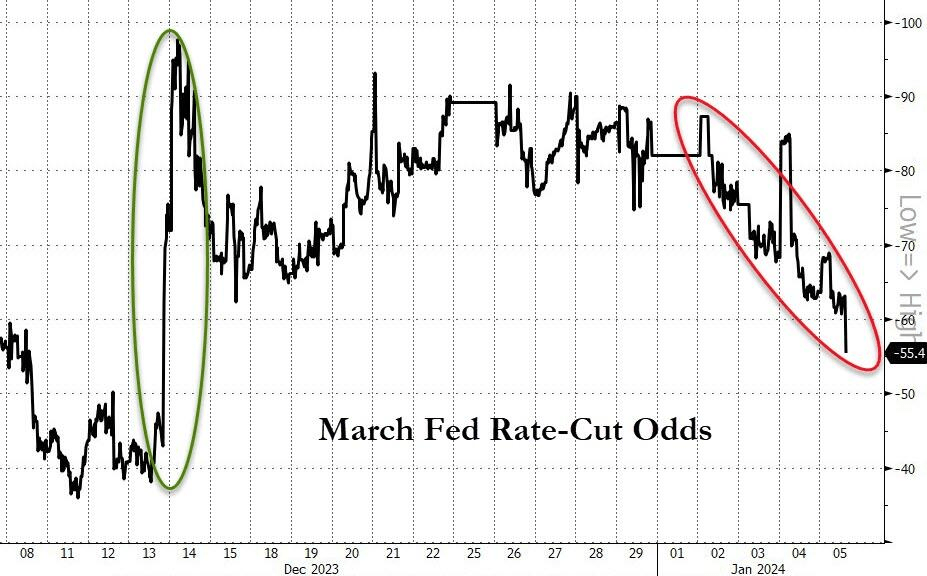
On the jobs report, the 2 year Treasury yield spiked to 4.4726%.
The odds of a March rate hike are decreasing.
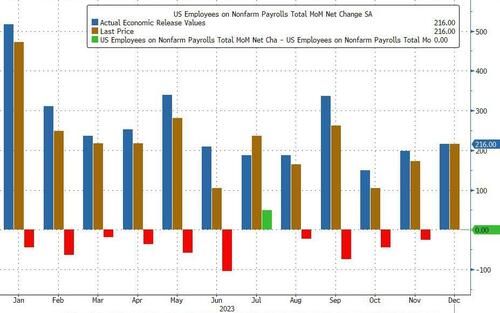
But next month today’s print will likely be revised sharply lower (perhaps even below 175K, meaning today was a miss). Why do we say that? Because once again the BLS revised not just one but both previous months sharply lower:
October revised down 45K from 150K to 105K
November revised down 26K from 199K to 173K
This means that ten of the past 11 jobs reports have been revised substantially lower.
There was some unexpectedly weakness in the labor force participation rate which dropped to 62.5% from 62.8%, missing expectations of an unchanged print. That’s because the number of people not in the labor force soared from 99.695MM to 100.540MM, an 845K increase largely due to a change in historical “data.”
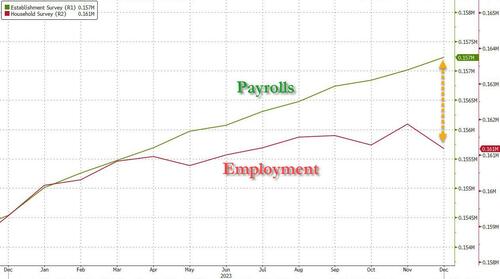
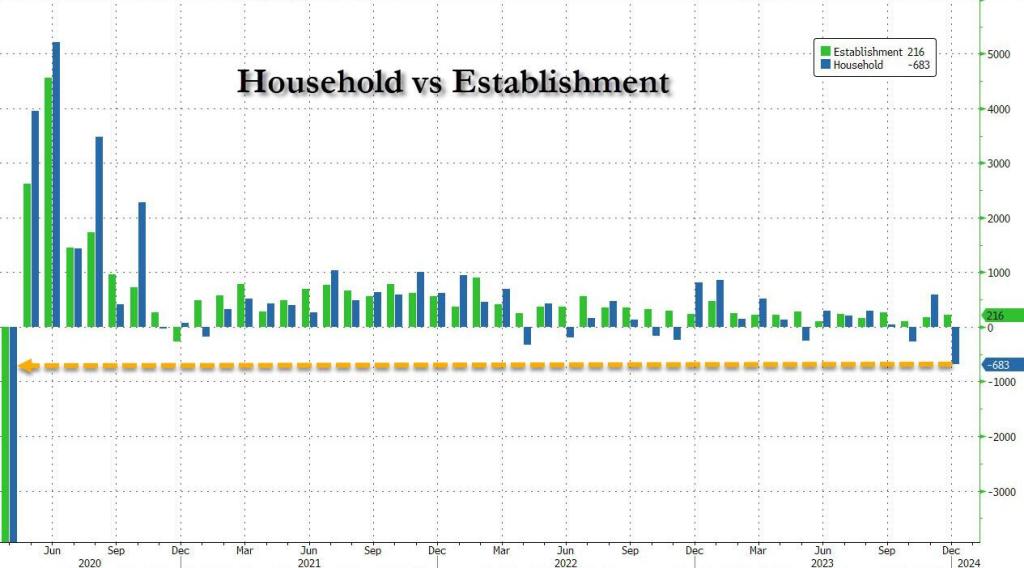
Consider the usual split between the Household and Establishment surveys: here, while payrolls reportedly increase by 216K (at least until they are revised lower next month), the Household Survey showed a plunge in employment of 683K!
Sadly, government employment increased by 52,000 in December. Employment continued to trend up in local government (+37,000) and federal government (+7,000). Government added an average of 56,000 jobs per month in 2023, more than double the average monthly gain of 23,000 in 2022.
But the biggest shocker is that the number of full-time jobs actually plunged by 1.5 million in December to the lowest since Feb 2023, while part-time jobs exploded higher by 762K to the highest on record. And there was another record: in the number of multiple jobholders. We will shortly have a post breaking all of this down.
The Household Survey showed a decline of an unprecedented 683K jobs.
So government is the largest growth in jobs (it is Biden after all and all he knows is government). Sad, since government produces nothing but taxes, regulations and debt. THAT is what Biden knows how to do!
It‘s Biden’s Fiscal Inferno! Insane open borders, insane green spending, wars in Ukraine, Gaza and growing restlessness around Taiwan. Inflation. And a demented 81-year old President in charge.
The deficit is $44 billion higher than it was at the end of November 2022, according to the latest data released by the U.S. Department of the Treasury.
Congress passed a “laddered” continuing resolution in November with a final expiration date of February 2. Conservative House Republicans have been calling for a reduction in federal spending to reduce the budget deficit. Congress must pass another spending bill to keep the government funded past Feb. 2.
The specific cuts the House GOP is considering remains unclear at this time, but any reduction in spending is likely to hit roadblocks in the Democratic-led Senate. Senate Majority Leader Chuck Schumer, D-N.Y., has criticized previous GOP attempts to cut domestic spending levels.
In September, House Republicans were trying to cut annual spending by about $120 billion, which still would not balance the budget. Congressional Democratic leaders were critical of their approach at the time.
Senate congressional leaders are currently debating a foreign assistance package that would provide additional aid to Ukraine and Israel as well as humanitarian assistance for Palestinian refugees along with money for U.S. border security. Senate leaders said on Tuesday that both sides were closer to a deal, but a formal agreement hasn’t been reached yet.
“With regard to the border discussion, I think it’s pretty safe to say that we’ve made some significant progress, but we obviously aren’t there,” McConnell said at the Capitol during his weekly news conference on Tuesday.
On the House side, Republicans have argued that additional aid for Israel and Ukraine should be paid for or “offset” by equivalent spending reductions. Schumer has said that such foreign assistance does not need to be paid for since it is considered emergency spending.
Senators are still in Washington negotiating on the package but the House has left town for the holidays.
Scott Hodge, president emeritus and senior policy adviser at the Tax Foundation, a nonpartisan tax policy 501(c)(3) nonprofit, said the U.S. Treasury reporting a 13% increase in the deficit compared to November 2022 shows the U.S. government continues to go down the wrong path when it comes to fiscal policy.
“It is being driven by federal spending, which is up by $152 billion, a 17% increase compared to the same month in 2022. The monthly deficit would have been worse if decent economic growth hadn’t boosted federal tax collections by $108 billion, or 19%,” Hodge told Just the News.
“The problem with the federal budget is basic math—the growth in spending continues to outpace the growth in tax collections. This is why our national debit is heading toward $34 trillion. It cannot go on forever without serious economic consequences,” he added.
Maya MacGuineas, president of the Committee for a Responsible Federal Budget, shared a similar perspective on the matter. “The longer we allow our debt to worsen, the less room we ultimately have to respond to the kinds of global emergencies we’re seeing in the world today,” she said.
“This leaves policymakers with a choice: make the hard choices today by paying for our priorities and putting the national debt on a sustainable trajectory, or saddle the next generation with an even worse situation,” she added.
The national debt in January of 2020 was $17.2 trillion, according to historical data from the Peterson Foundation. By contrast, the national debt is currently $33.9 trillion, according to the U.S. Treasury.
And don’t forget that $212.5 TRILLION in unfunded liabilities.


You must be logged in to post a comment.