US Treasury yields are a runaway train. The 30-year Treasury yield is soaring and rose above 5% … again. First time since 2007, just before the financial crisis and The Great Recession.
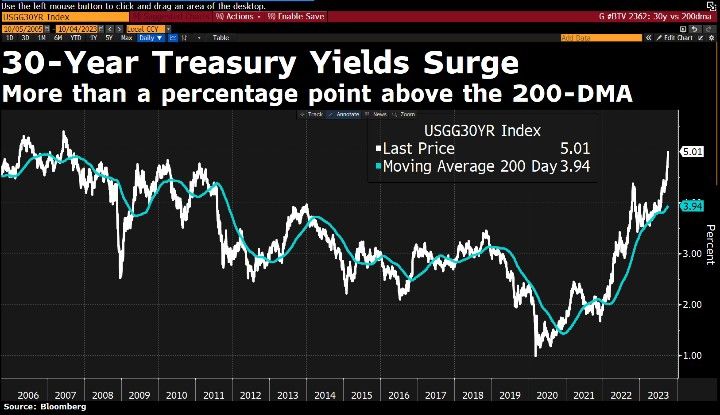
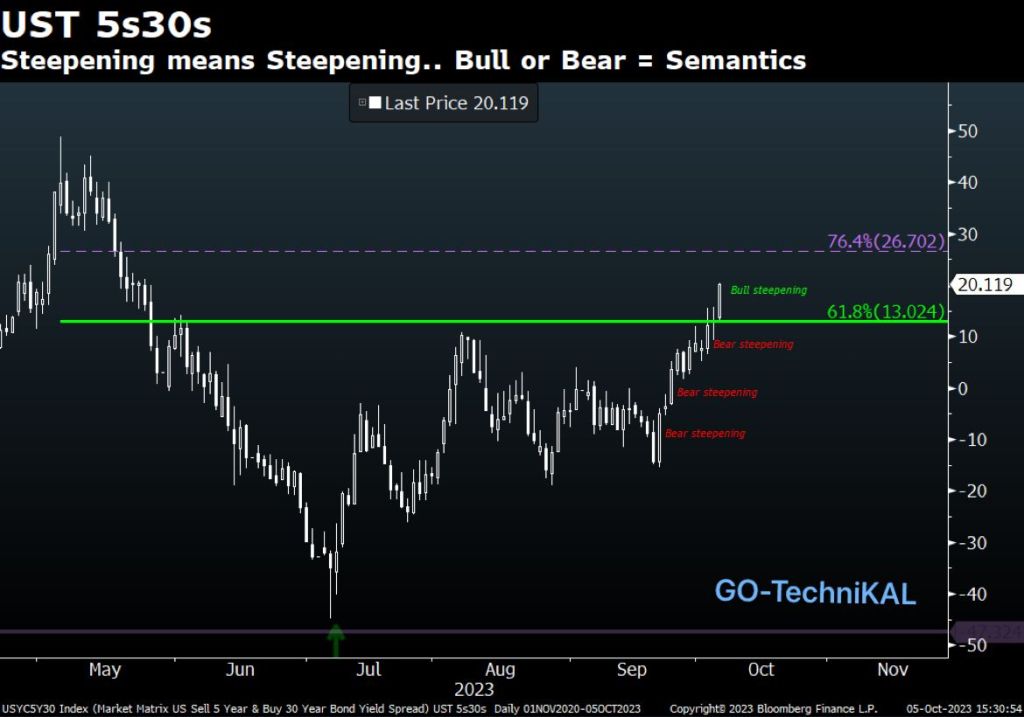
The 30Y-5Y yield curve is steepening.

Confounded Interest – Anthony B. Sanders
Financial Markets And Real Estate
US Treasury yields are a runaway train. The 30-year Treasury yield is soaring and rose above 5% … again. First time since 2007, just before the financial crisis and The Great Recession.
The 30Y-5Y yield curve is steepening.
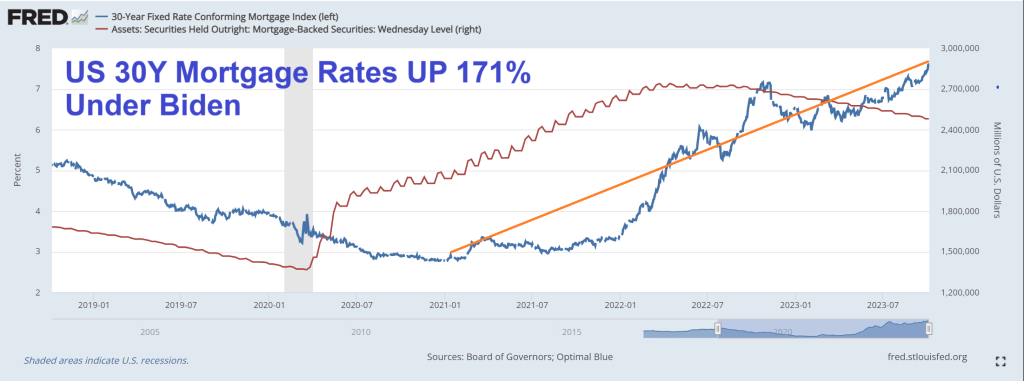
Bidenomics is an economy eater! But at least we know that the southern border is not on Biden’s mind or lips. But as Ronald Reagan once asked “Are you better off now than 4 years ago?” The answer? Most Americans are far worse off due to inflation and the surge in “Would you like fries with your burger?” jobs. And mortgage rates are up 171%.
After last month’s (September) stunning payrolls report, when in our post-mortem we revealed not only a year full of monthly downward data revisions, but also collapse in tull-time jobs and surge in part-time jobs, as well as the worst unadjusted August payrolls since the great recession, we thought that nothing could shock us any more. And then we got the September jobs report.
We won’t spend too much time dissecting the report since regular readers are all too aware of the same old “upward goalseeking” tactics used by the BLS, so here are the highlights.
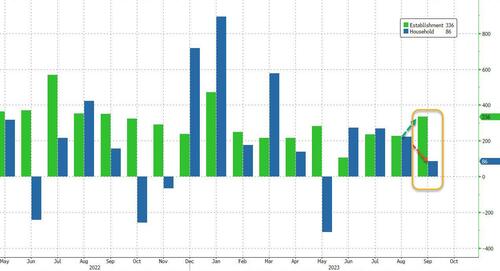
First, the 336K jump in headline payrolls – the biggest since January – was stunning when considering that it was not only above the highest Wall Street estimate but was a 6-sigma beat to expectations.
How is it possible to get such an outlier print to not only trends but expectations? Let’s try to answer that question.
If, as the BLS claims, in September the jobs market suddenly reversed a year of declines, surely there will be some qualitative validations to this quantitative outlier, right? Unfortunately, looking through the supporting evidence we don’t find any justification to the BLS exuberance.
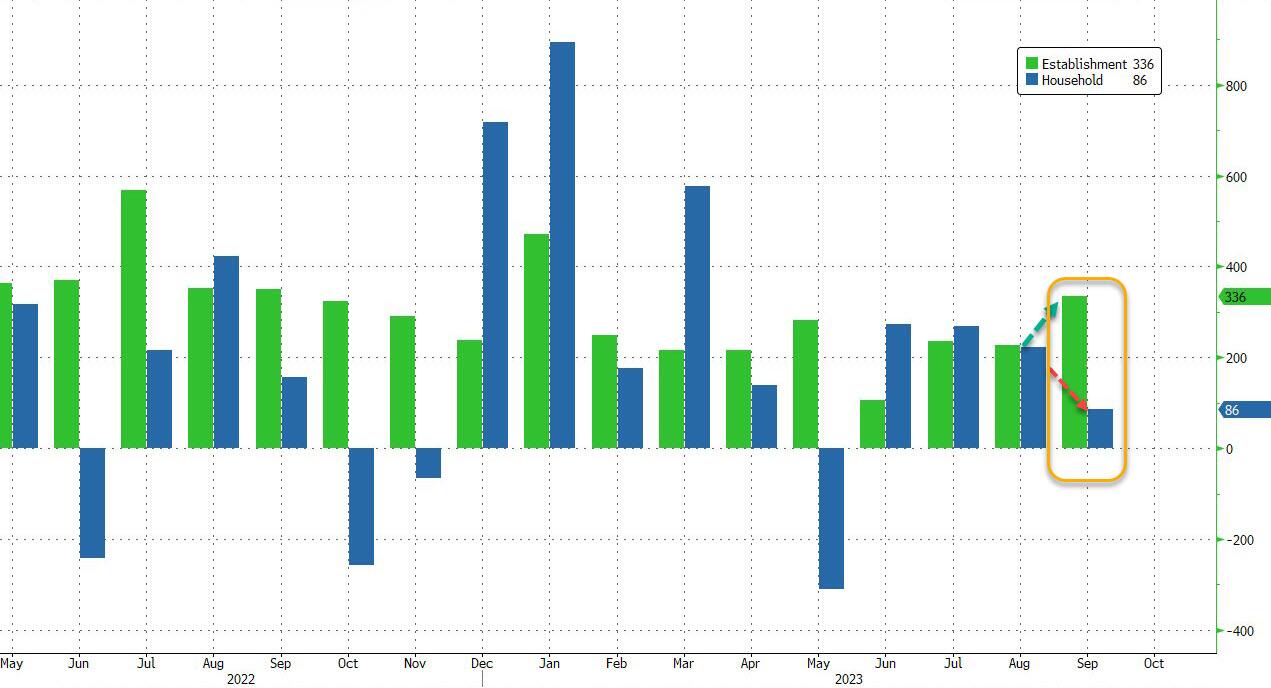
Let’s start with the Household survey: here instead of a number anywhere close to the 336K jobs gained (as the far less accurate Establishment survey reports), the number of newly employed workers was just 86K, the lowest since May, and the second lowest of 2023!
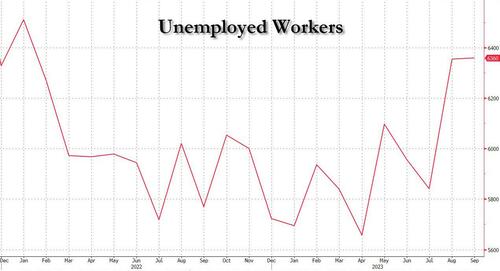
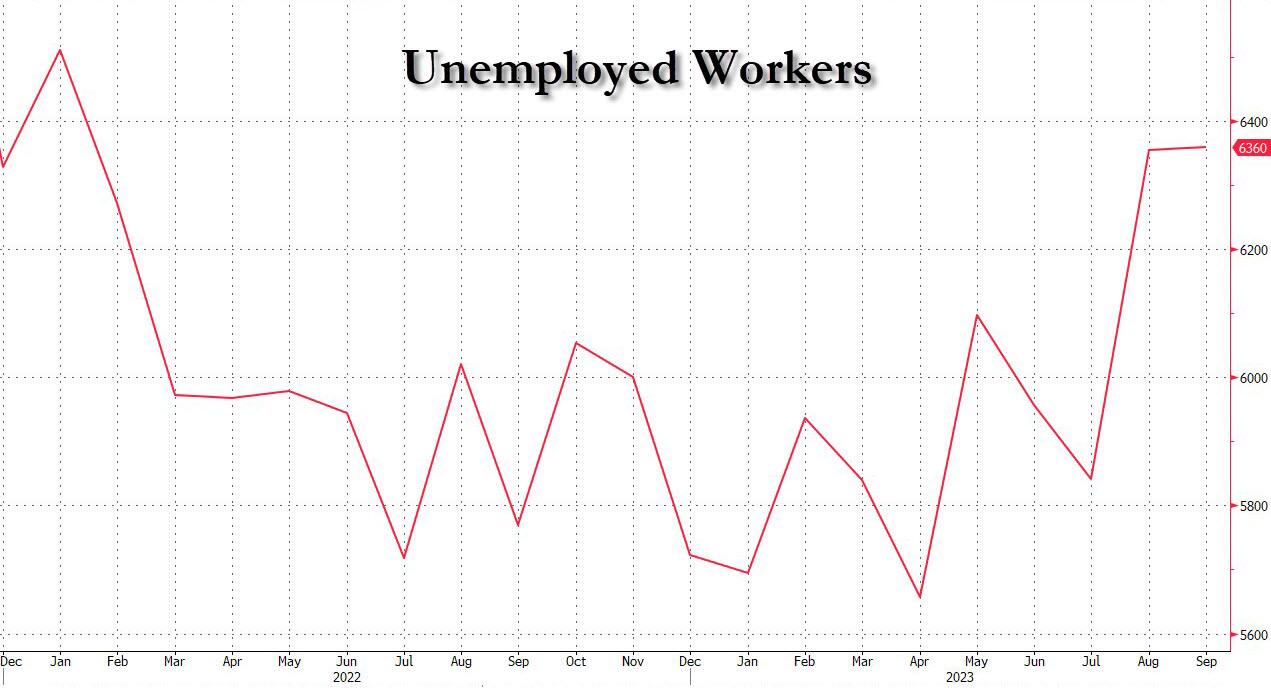
And since the number of unemployed workers also rose to 6.360 million, the highest number since January 2022, the unemployment rate was sticky at 3.8%, and refused to drop to 3.7% as consensus had expected.
How about the Establishment survey? Well, here too, things stink. Yes, the headline surge was great, but the question here is how much of that was purely seasonals.
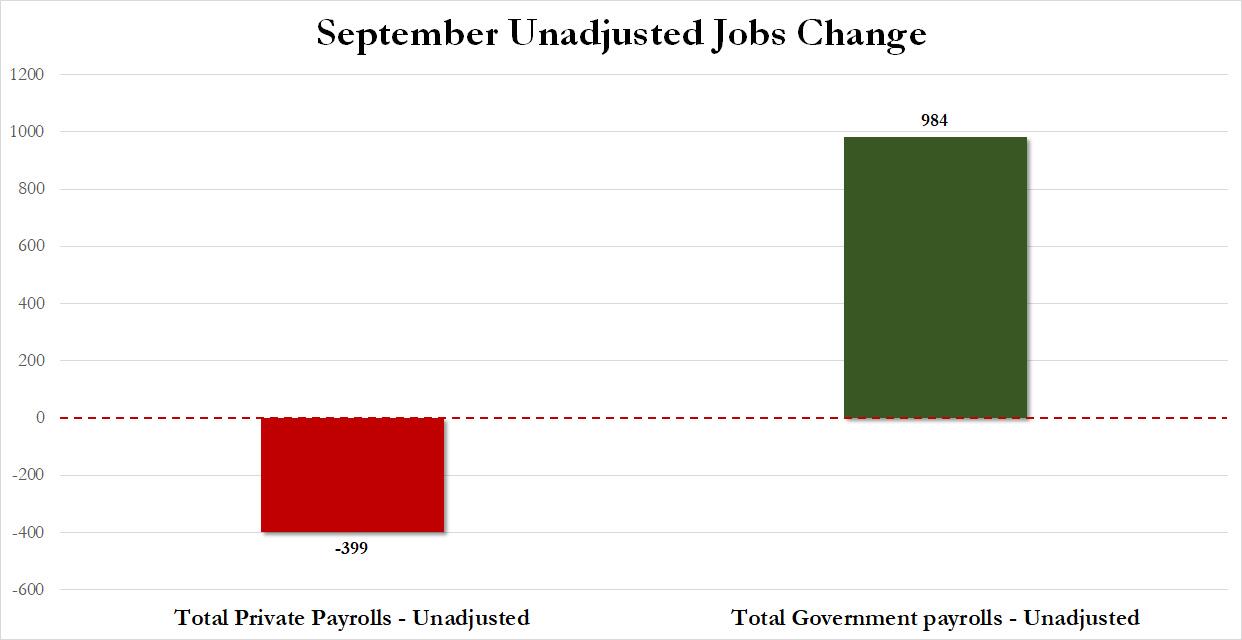
The official adjusted data showed this Leisure and Hospitality added a whopping +96k jobs. But unadjusted data showed that the sector lost 466k jobs in Sep. This means that the unadjusted private sector payrolls was -399!
Wait, if unadjusted total payrolls rose by 585K and yet private payrolls dropped by 399K, that means that… you got it: in September, all of the unadjusted jobs came from – drumroll – the government, which added a whopping 984K jobs (mostly teachers).

Translation: for yet another month all the strength in the Establishment was thanks to seasonals and various plugs that made the total number much stronger.
And now, let’s turn again to the much more detailed and accurate Household Survey, where we find the BLS back to its old tricks again.
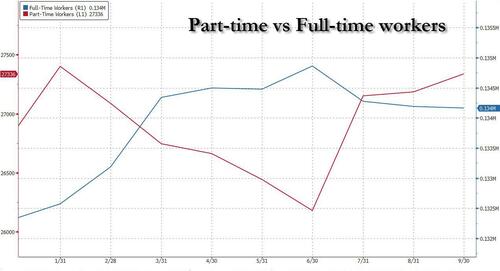
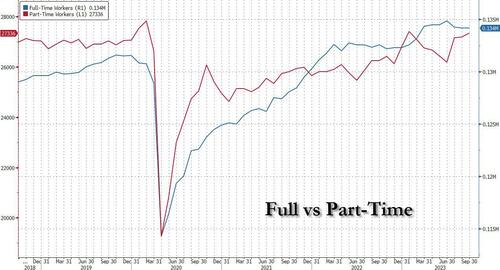
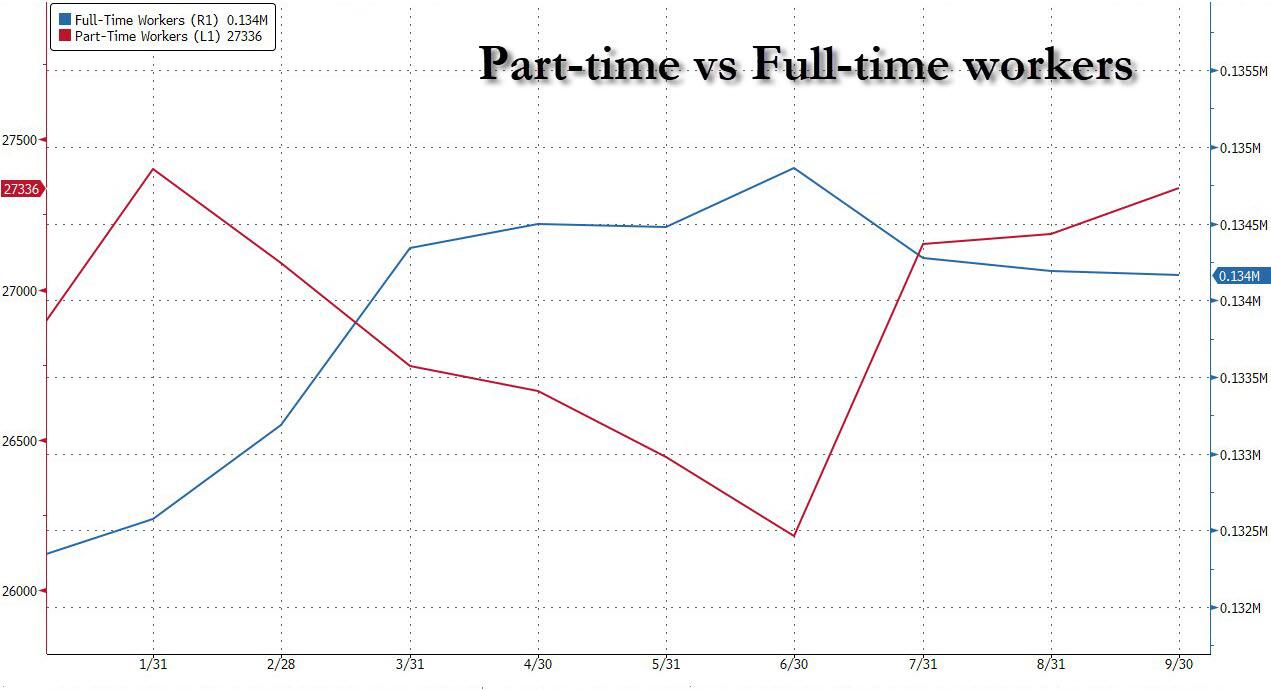
First, as we pointed out earlier, despite the alleged quantitative surge, the quality of the jobs was anything but good. In fact, looking at the infamous table A-9 of the employment report, reveals that in September, a seasonally adjusted breakdown of jobs shows that part-time workers accounted for the entire increase, rising by 151K; as for full-time workers? Well, for yet another month, this number dropped, sliding by 22K in September.
Indeed, as shown in the chart below, while part-time workers rose for the third consecutive month to 27.336 million,and the highest since January, full-time workers have decline for three straight months, and at 134.167 million, this was the lowest number going back to February!
But hold on, you say, why use Seasonally Adjusted number when we already noted above that there continue to be chronic issues with the BLS’ seasonal adjustments in the post-covid era. True, so let’s use unadjusted numbers instead. What do we get?
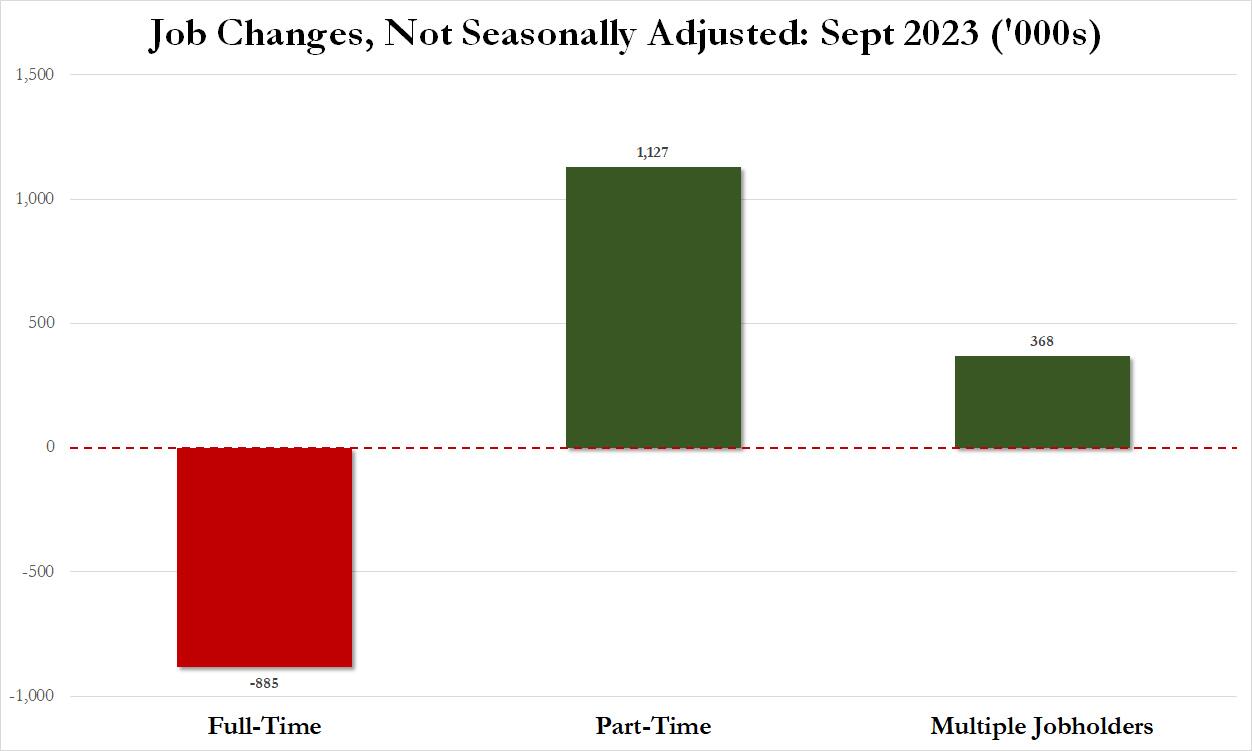
Well, we get the following whopper: in September, the number of unadjusted full-time workers collapsed by 885K. This was the biggest monthly drop since – drumroll- April 2020 when the economy was shut down!
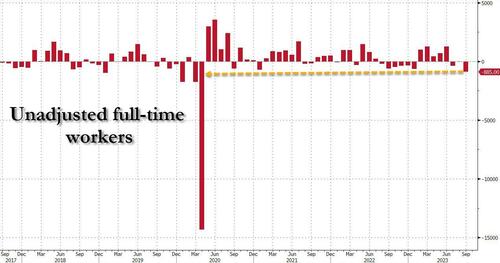
And if full-time workers plunged, that must mean that part-timers exploded, right? Why yes, they did: by 1.127 million in one month to be precise, and at 27.109 million the number of part-time workers was the highest since April.
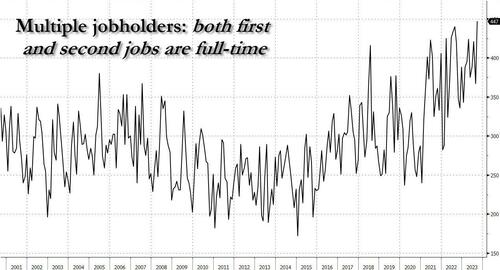
Finally, let’s not forget the number of multiple jobholders: those unlucky souls which have to work not one but two (or more) jobs to make ends meet under Bidenomics. Also, multiple jobholders (which are measured by the Household Survey) are double, and triple- counted when it comes to the Establishment Survey. So how did thy do in September? Well, on a seasonally adjusted basis, the number increased by 123K to 8.151 million, the highest since January 2020. As for the much more accurate, unadjusted number, well that soared from 7.778 million to 8.146 million, an increase of 368K, or more than all the 336K payrolls reported by the establishment survey.
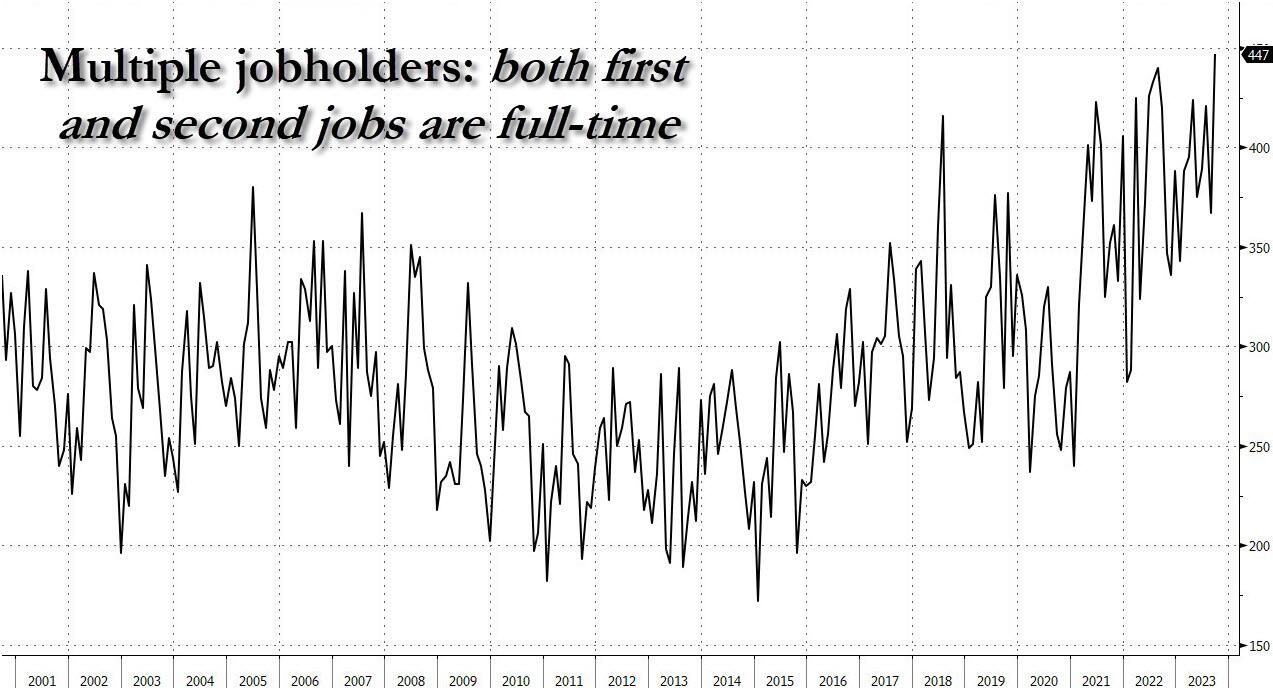
In other words, all of the job gains in September were either from part-time workers or multiple jobholders forced to get another job in addition to their current one, and thus be counted by the BLS as two distinct jobs (or more). One final observation on the multiple jobholders: in September, the subset of multiple jobholders who held both a primary and secondary full-time job just hit an all time high.
Visually, this is what September’s “stunning” jobs report really looked like.

Source for everything: BLS, but one needs to do some actual work to get a sense of what is really going on.
And on top of the blood curdling jobs report, mortgage rates rates and are up 171% under Bidenomics.
And then we have Hillary Clinton pulling a Pol Pot and suggesting de-programming of Trump supporters like in the movie “The Killing Fields.” Pol Clinton??

Hey Bartender! The leading employment gain under Bidenomics was … low paying leisure and hospitality jobs at 96k jobs added.
The US added a whopping 336K jobs, the highest monthly increase since January. This is surprising given that the ADP report was so weak.
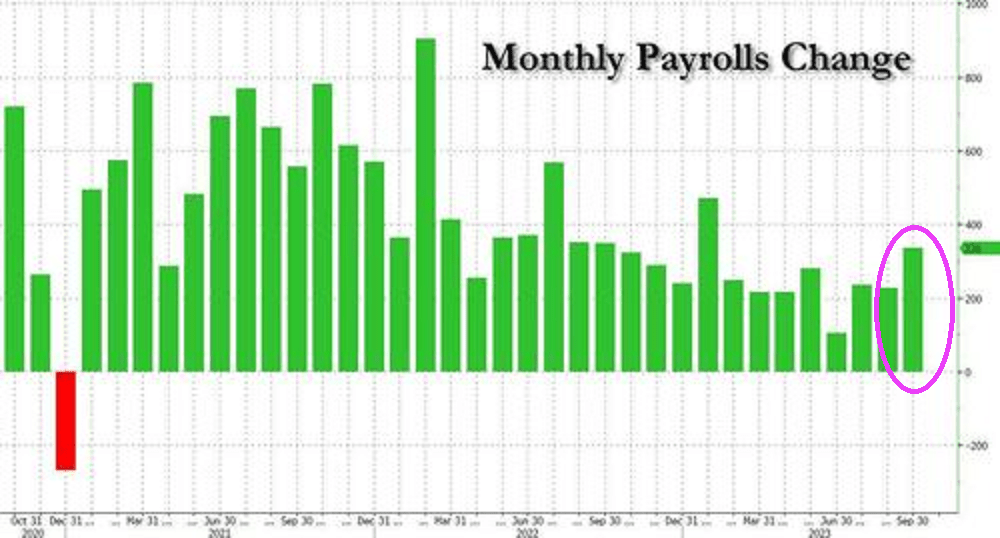
And the BLS decided to UPWARD revised past numbers. The BLS revised not only August but also July higher: the change in total nonfarm payroll employment for July was revised up by 79,000, from +157,000 to +236,000, and the change for August was revised up by 40,000, from +187,000 to +227,000. With these revisions, employment in July and August combined is 119,000 higher than previously reported.
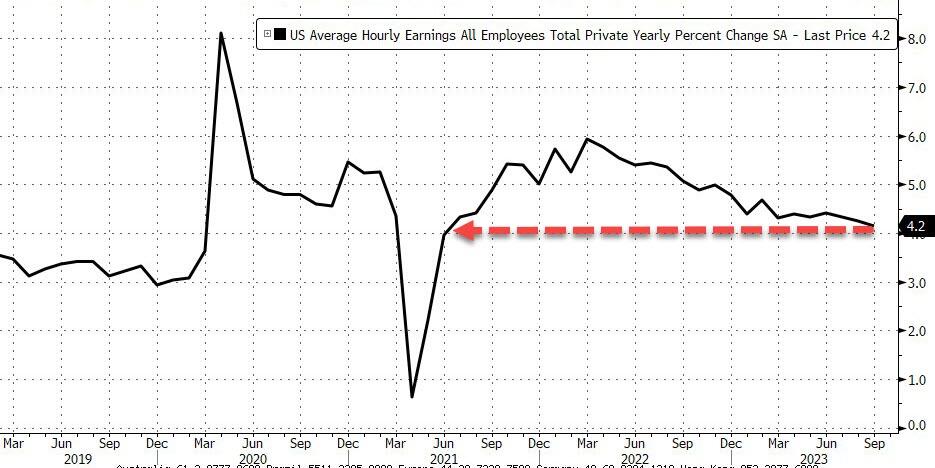
Meanwhile wage growth continued to cool, and in September average hourly earnings increased 0.2%, below the 0.3% expected, and resulted in a 4.2% increase YoY, down from 4.3% in August…

… as a result of a big bump in lower paying jobs.
But perhaps the most remarkable divergence in the report is that with headline payrolls surging 336K (establishment survey), the Household Survey indicated that the pain continues, as the number of people employed not only rose by less than 100K (86K to be precise), but it was all part-time workers, which increased by 151K. Full-time workers? Why, they dropped by 22K, and the lowest since February.
Leisure and hospitality added 96,000 jobs in September, above the average monthly gain of 61,000 over the prior 12 months.

But the jobs report highlights Bidenomics. Lots of government jobs and the private sector getting crushed. +1 million government jobs, -400K non-government.

Hmm. How will The Federal Reserve view this report? Focus on the red-hot headline gain of 336k job added or the fact that it is mostly part-time jobs added? Odds of a rate HIKE rise to 44% after September jobs report and Fed PAUSE expectations have been extended.

After the jobs report, the US Treasury 10Y yield soared.
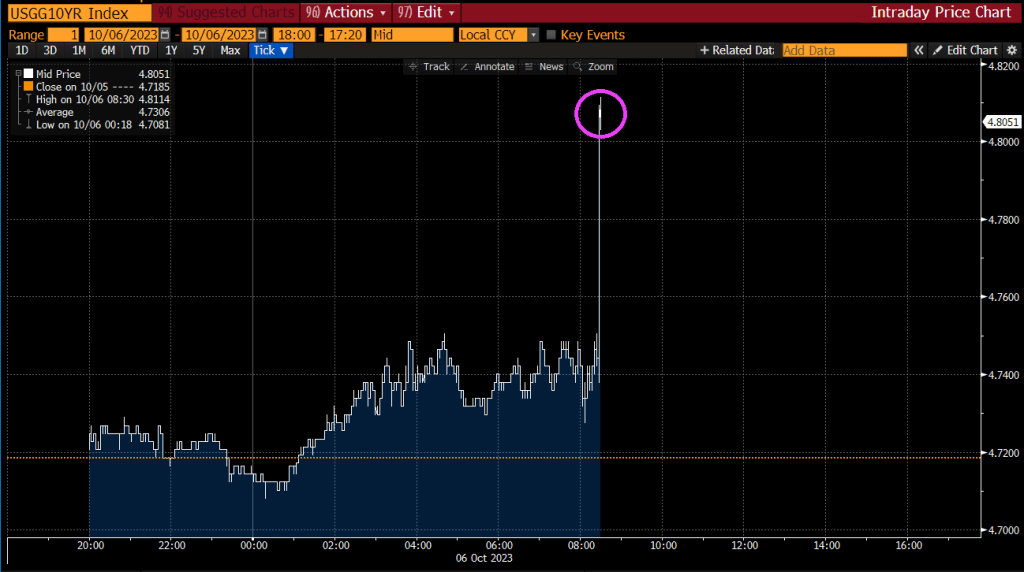
The 10-year Treasury yield has risen dramatically under Biden’s Reign of (Economic) Error.

Alarm! US 10-year Treasury yields are soaring along with mortgage rates.
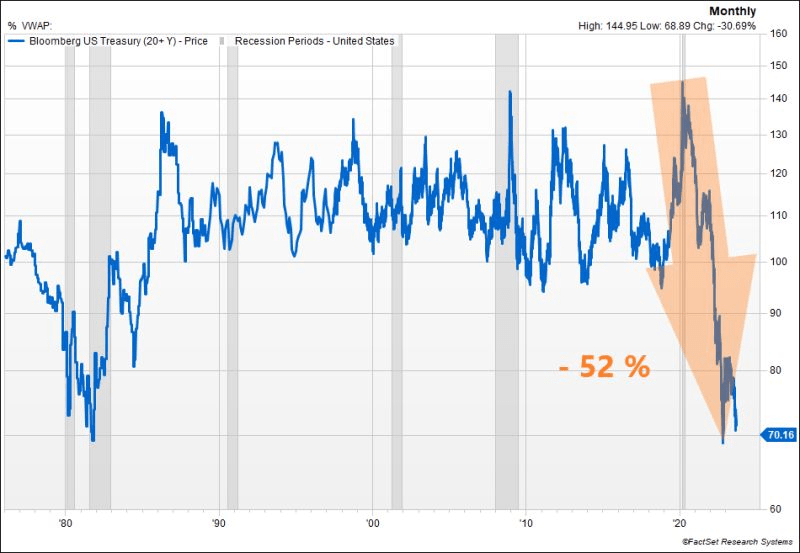
The US Treasury market is witnessing another significant selloff, pushing the 10y UST yield close to the 4.50% mark. The surge in real rates is remarkable, reaching 2.12% for the 10y, a level not seen since 08’. While this might appear attractive in real terms compared to historical benchmarks, could we be on the brink of a third consecutive year of negative performance for US Treasuries? To put this into perspective, such a scenario has never occurred in history.
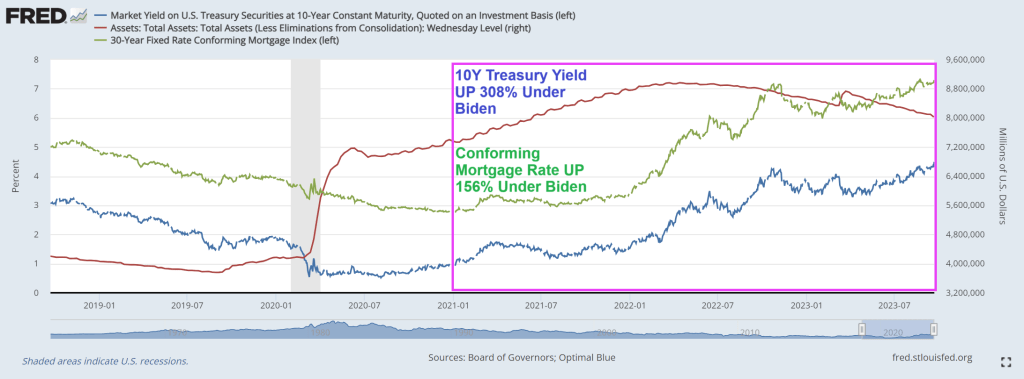
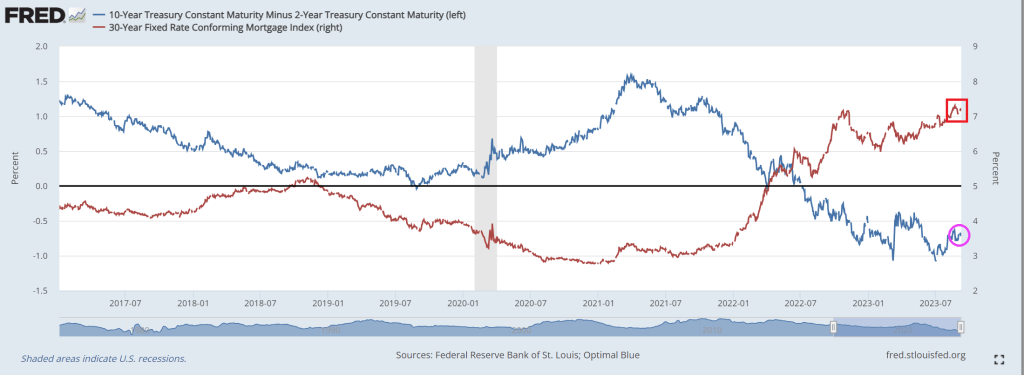
The conforming mortgage rate is at 7.3%, up 156% under since Biden’s coronation as El Presidente of the United Banana Republics of America. Where political opponents are indicted prior to elections.
In Biden’s Banana Republic economy, the US Treasury 10y-2y yield curve remains inverted.

And then we have Mish’s chart on debt as a percentage of GDP from CBO. Remember, we used to worry about the US breaking the 80% debt to GDP level. It is now projected to be 181%. Wow.

This isn’t good!

El Presidente Billions Biden.

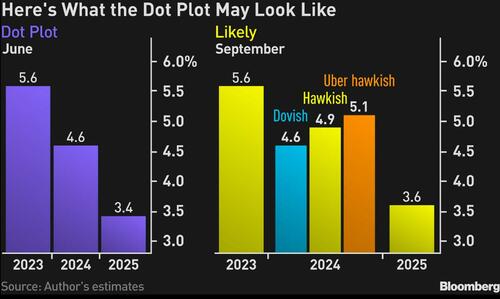
The Fed’s Dot Plot, the Open Market Committee’s guesses as to Fed rate policy in the future, despite Treasury Secretary Janet Yellen saying everything is beautiful in the US economy. Then Janet, why is The FOMC siganling a rate cut from 5.6% to 3.6% by 2025?
The median of indications will show that policymakers expect a decline in the benchmark rate of as little as 50 basis points or 75 basis points for 2024, compared with the 100 basis points their plot showed in June. I expect the Fed to leave its dot plot for 2023 intact, with the funds rate indicated at 5.6%.
Investors have, of late, swung between pricing rate cuts between the spring and the summer of 2024, which the Fed isn’t in a position to acknowledge based on the current strength of the US economy. The most definitive way of pushing back against that notion is to pencil in less by way of policy loosening than the central bank did in June.
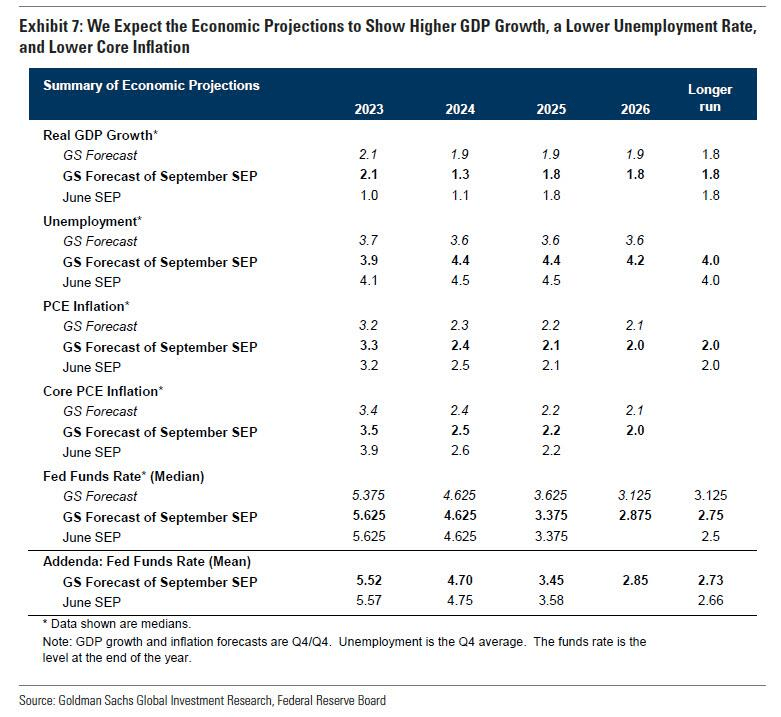
Since that meeting, headline inflation has accelerated, while inflation stripped of housing and energy is still hovering above 4%. Meanwhile, the jobless rate has averaged 3.6% so far this year, around as low as we have ever seen historically — and way below what the Fed estimates will be required to bring the labor market into balance.
The resilience of the job market may, in fact, spur policymakers to pencil in a lower unemployment rate for 2024 than the 4.5% they indicated in June.
Consistent with that outlook, the Fed may be disinclined to revise its 1% growth projection for next year by more than a whisker.
Those revisions are likely to mean that the Fed has reduced scope to loosen policy at the first sign of material weakness in the economy.
Given that James Bullard quit the Fed in August, the new set of projections will be lacking a prescient hawk, whose dot plot has been a rewarding schemata to follow for investors in this cycle. That suggests the skew between the median of the Fed rate projections for next year and top range will be considerably narrower.
An interesting corner of the summary of economic projections to watch will be the Fed’s assumption on the neutral real policy rate, which neither stokes inflation nor crimps output. For several years now the Fed has penciled in a longer-run funds rate of 2.50% predicated on inflation of 2%, thereby projecting a neutral rate of 50 basis points.
However, researchers at the New York Fed reckon that the real neutral rate will reach a staggering 250 basis points by the end of the year, one reason why Treasury long-dated yields have been sticky this late in the policy cycle.
All told, the dot plot and summary of economic projections is what will guide the Treasury market reaction, and from the looks of it, the markets may not like what they see.
Not like what they see? Like Bidenomics??

I ain’t never been to Spain, but the US under Biden is like Spain in terms of default risk.
Actually, I have to Spain numerous times and love visiting Barcelona. But the US debt fiasco under Biden and Congressional spending sprees has led to … US credit default swap being priced worse than Spain’s CDS.

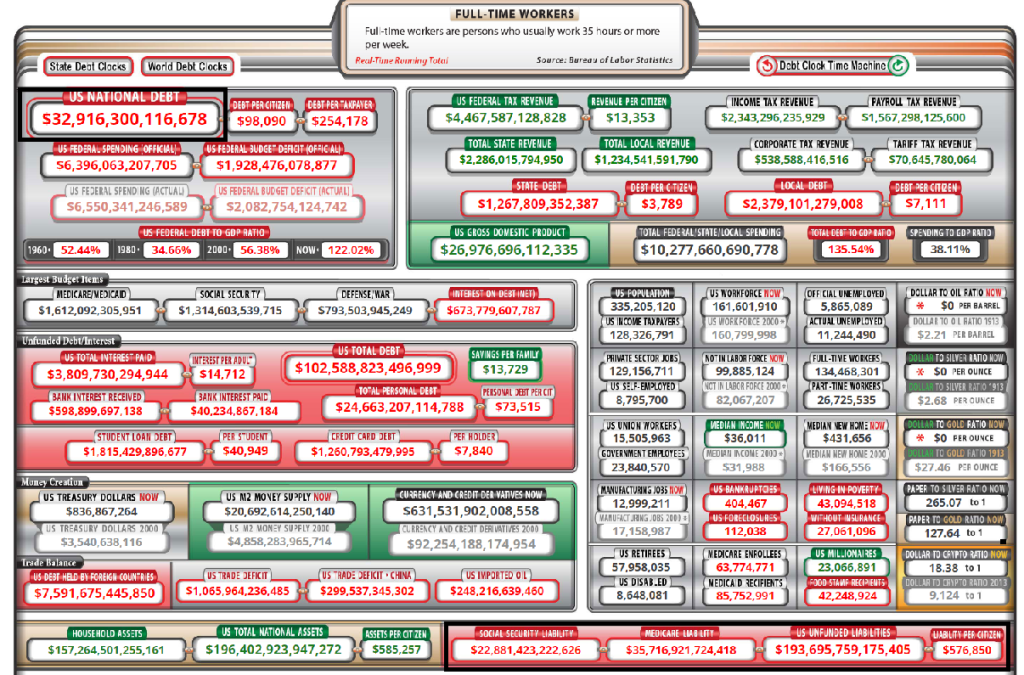
With Biden/Congress orgy of spending (and a declining economy in many important respects), the US is seeing Federal debt near $33 TRILLION and even worse, unfunded Federal liabilities (promises, promises) are at $193 TRILLION, almost 6 times the current Federal debt load.

If you are into archaelogy and fossils, Nancy Pelosi (83) has announced that she is running for re-election to The House. Hasn’t San Francisco suffered enough under Feinstein, Newsom and Mayor Breed?

Or as 3 Dog Night sang, “Joy to the globalist elites!”
It is a day of rememberance for the tragedy of the 9/11 terrorist attacks in New York City, while Biden embarrasses himself in Vietnam in a rambling speech which his aides cut off mid-sentence. Oh and he used his “lying dog-faced pony soldier” line again about global warning, ignoring the massive growth in coal useage in nearby China. Is this Bozo Joe?
But back in the USA (while Biden does his humiliate the US tour of Vietnam, India, etc, and ignores the tragedy of the 9/11 attacks), we see mortgage rates still up above 7% as the US Treasrury 10Y-2Y yield curve
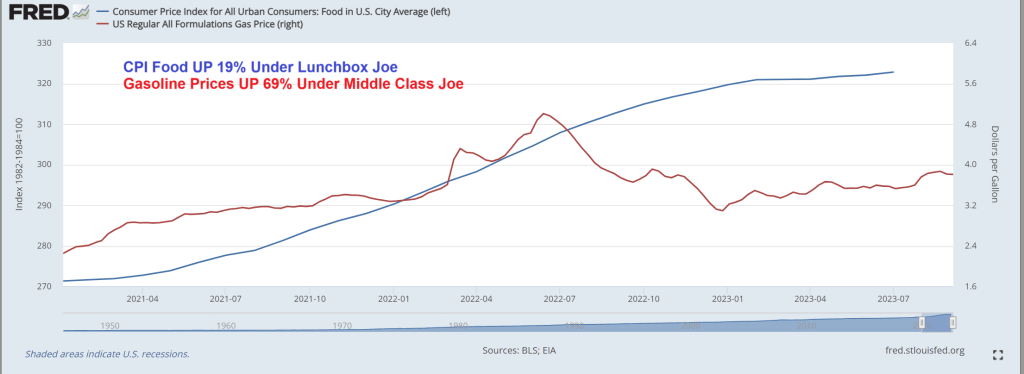
CPI food prices are up 19% under “Lunchbox Joe” and up 69% under “Green Joe”. True, the American middle class is far worse off under Bidenomics, but it is all about marketing Bidenomics at this point.

Of course, being a true RINO (Republican in name only), he won’t follow Biden around criticising him. Just critcising Trump. He is part of the Globalist Romney RINO Party (GRR).
Bidenomics is a train wreck. But unlike E. Palestine Ohio, the site of a train derailment and massive toxic spill (for which Biden has yet to visit), Bidenomics is a continuing train wreck.
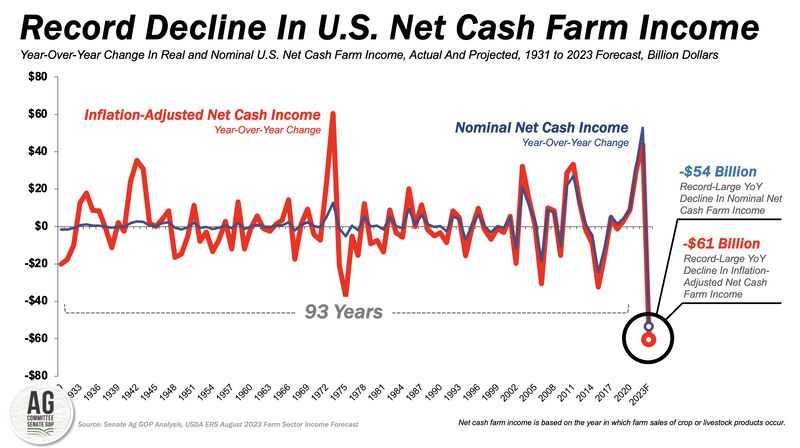
The first chart is the record decline in US net cash farm income. Now in negative growth!
Second, US office vacancy rate is now higher than the peak during the financial crisis. Of course, Covid shutdowns and work from home is the primary driver, but Democrat crime policies are making it more hazardous to work in offices in major American cities, so Bidenomics isn’t helping.

Under Bidenomics, US debt is now near $33 trillion. Up 19% under Biden. And while not Biden’s fault, the US has promised $194 TRILLION in unfunded liabilities. Biden won’t do anything to halt the entitlement growth.
Is Biden acting on behalf of World Economic Forum’s Klaus Schwab? Well, Biden appointed John Kerry, another dimwitted former US Senator like Biden, to be his climate Czar. Kerry wants to shut down farms and starve the population, just like his Overlord Klaus Schwab.

Are Biden and America’s Progressives part of Schwab’s “Great Reset?” Where we eat insects while Biden, Kerry, Schwab and the elites feast on Wagyu beef, foie gras, and expensive champagne. Elitist Treasury Secretary Yellen looks like she could use some Ozempic!

And then we have elitist California governor Gavin “Count Yorga” Newsom opining on Biden’s great “success.” 70% of Americans say things are going badly under Biden, but California Democrat Gov. Gavin Newsom says he’s “very inspired by the master class of the last two-and-a-half years”
Ah, the elite class! Reminds me of the French aristocracy under Louis the 16th and Marie Antoinette. “Let them eat crickets!”
Bidenomics is terrible! Just a huge payoff to be big donors (the donor class) for green energy, Big Pharma and Big Defense. Now Biden is considering using ankle monitors to prevent illegal immigrants from leaving Texas and traveling to welfare-friendly blue states like California and New York rather than just enforcing the border. The middle class is truly wasting away with Bidenomics.
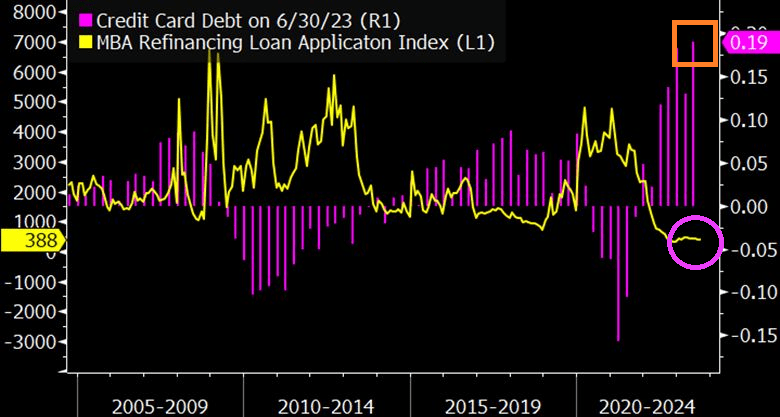
Let’s start with crashing mortgage refi demand as consumers load up on credit cards to afford rising prices thanks to Bidenomics.
Then we have consumer credit plunging with massive downward revisions.
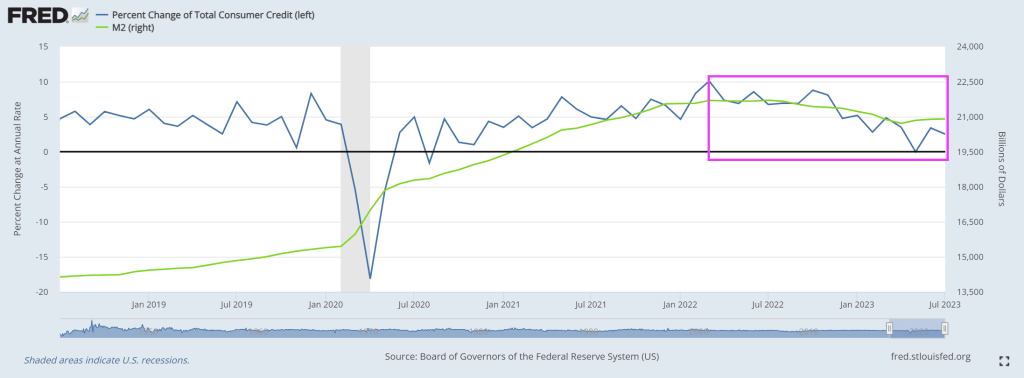
The Fed reports dramatically weakening consumer credit with negative revisions too.
Consumer Credit Report Revisions

Revision Key Points
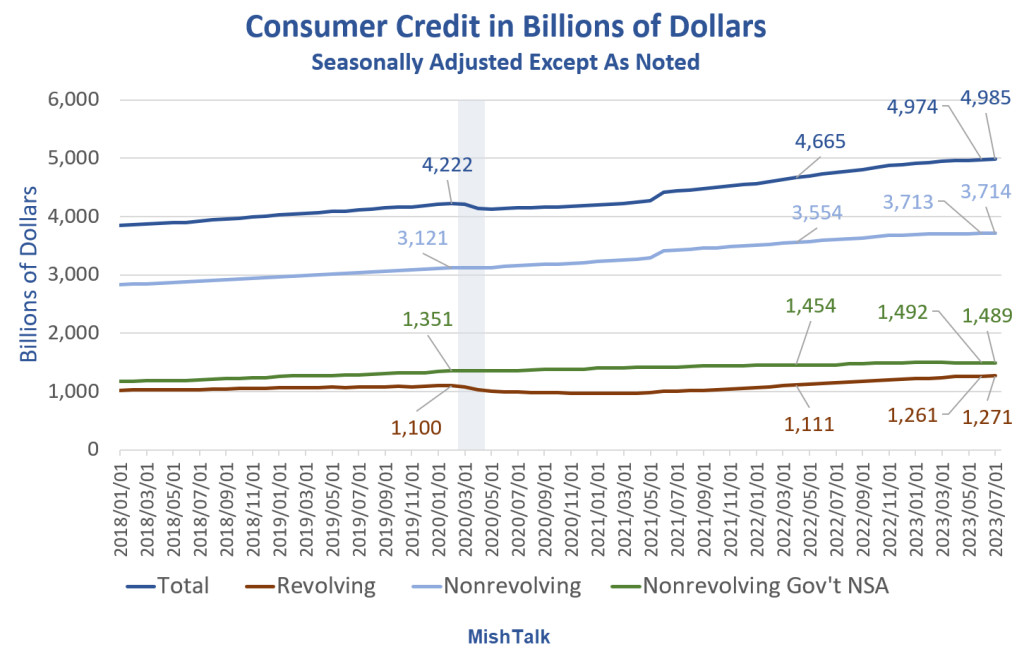
Nonrevolving Consumer Credit in Billions of Dollars

Nonrevolving Credit Implications
Assuming the data is accurate (unlikely) or at least the revision direction is accurate (likely), mortgage and existing home sales data is suspect.
Real (inflation adjusted) nonrevolving credit peaked in June of 2021.
Consumer Credit in Billions of Dollars Since 1969
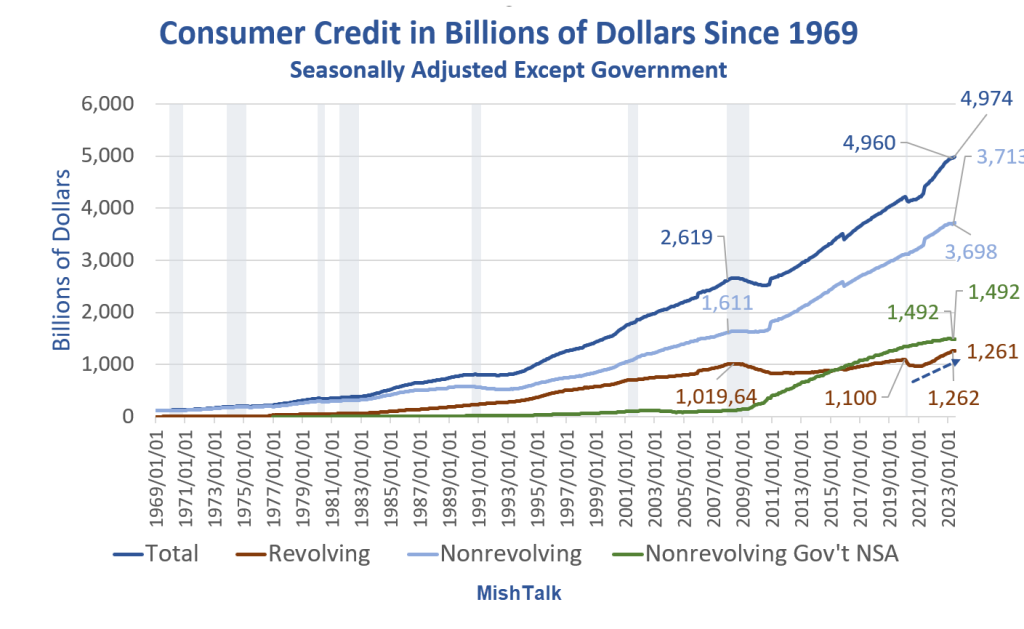
Consumers have generally done a pretty good job of avoiding credit card debt thanks to three rounds of fiscal stimulus.
However, inflation kicked in and the stimulus money has been spent. The result is the steep rise in credit card debt as noted by the blue arrow. Let’s hone in on that.
Revolving Consumer Credit in Billions of Dollars
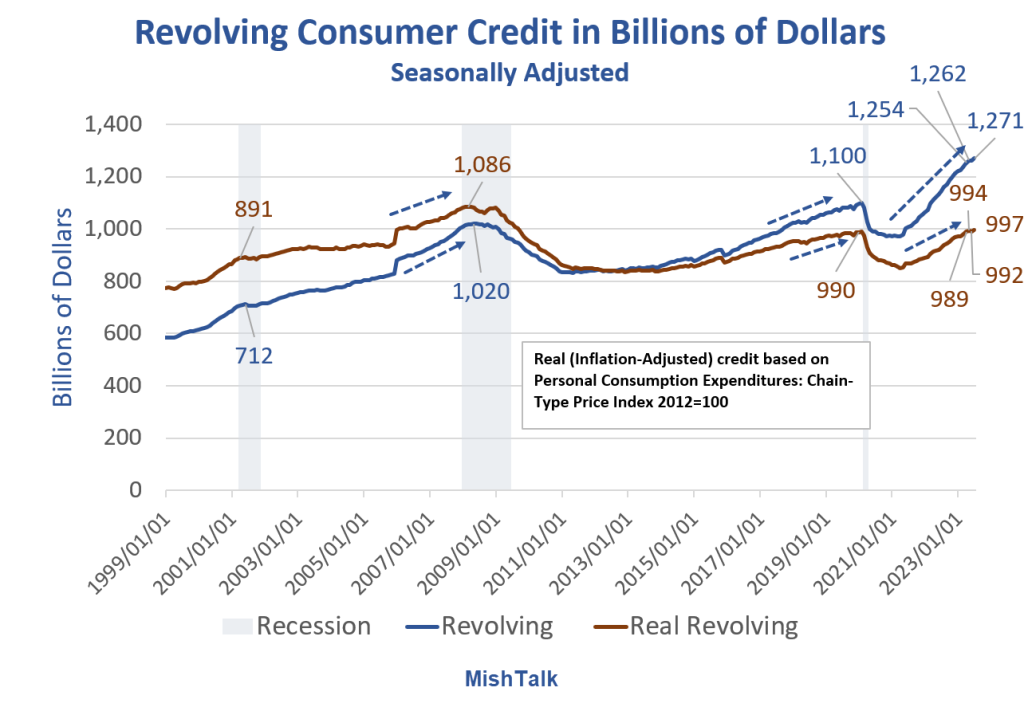
Stunning Steepness in Credit Card Debt Accruals
The speed at which consumers are going into credit card debt is stunning.
It’s hard to maintain lifestyles with rising inflation unless wages keep up.
The BLS and Fed believe the rate of increase in inflation is falling. Assuming the data is correct, consumers are struggling anyway.
What Happens if Jobs Take a Dive?
That’s actually the wrong question. Job revisions (there’s that word again) have been steeply negative.
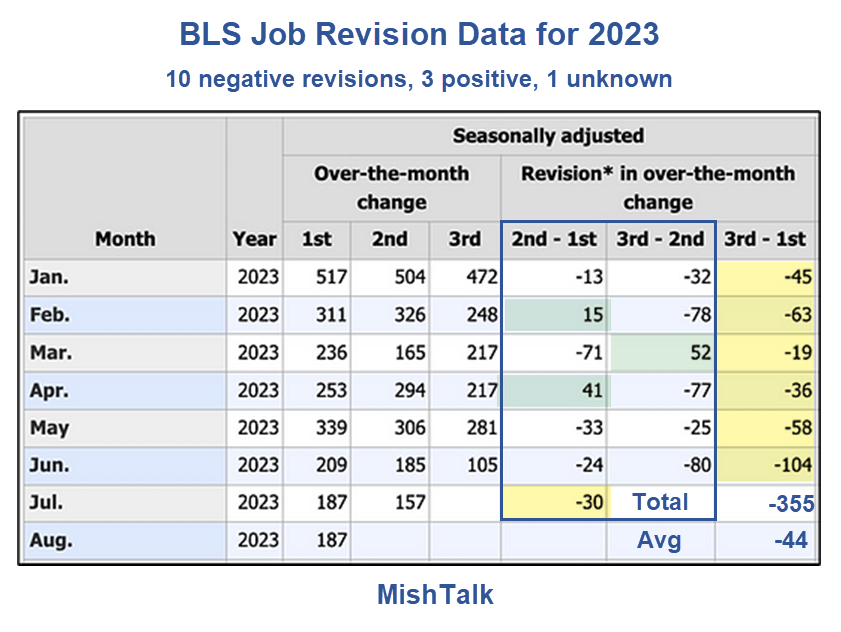
Jobs are still positive, assuming (there’s that word again) you believe the numbers and more negative revisions (there’s that word again) are not in the works.
As long as you are making assumptions, if you are rah-rah on the strength of the Biden economy, you may as well assume GDP numbers are correct as well.
My assumption is GDP is flat out wrong and Gross Domestic Income (GDI) numbers are far more likely to be correct than GDP numbers. GDP and GDI are supposed to be the same but aren’t.
GDP vs GDI
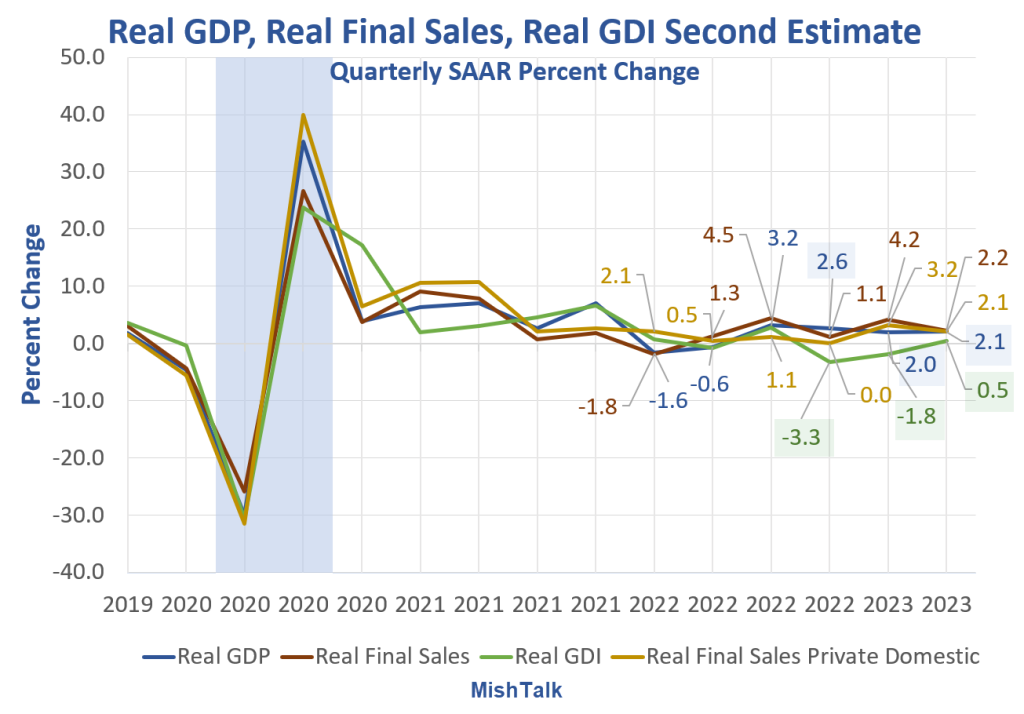
On August 30, I commented Negative Revision to 2nd Quarter GDP, Huge Discrepancy with GDI Continues
If you are a GDP and Jobs believer you likely assume (there’s that word again) GDP is accurate. The last three quarters are +2.6%, 2.0%, and 2.1%.
In contrast, the last three measures of GDI are -3.3%, -1.8%, and +0.5% with the more recent quarter the most likely to be the most revised.
The Fed Is Making Decisions on Poor, Untimely Data, Frequently Revised
I tied many of the ideas in this post together, in far more detail (absent the credit card revisions), in my previous post The Fed Is Making Decisions on Poor, Untimely Data, Frequently Revised
Please give it a look. Meanwhile, damn the revisions, full belief ahead.
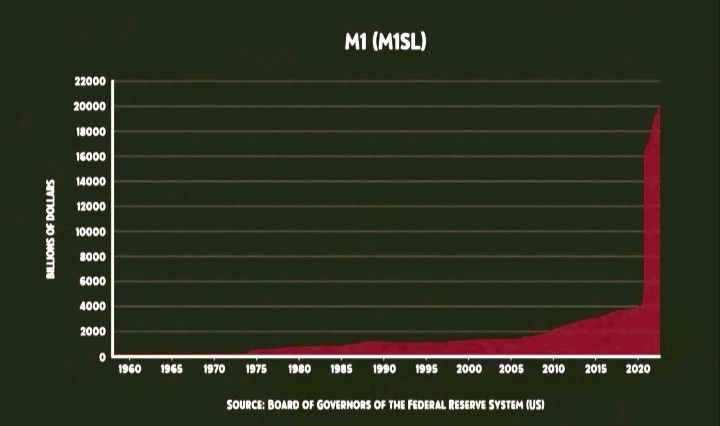
All this despite M1 Money exploding.
For those of you in Columbus Ohio, I cannot recommend Fyzical Therapy and Balance Center in Upper Arlington more highly. Ask for Carmen Soranno!
What a mess Biden and his Progressive backers have made. And we are forced to suffer the consequeinces of his policies. Or follies!
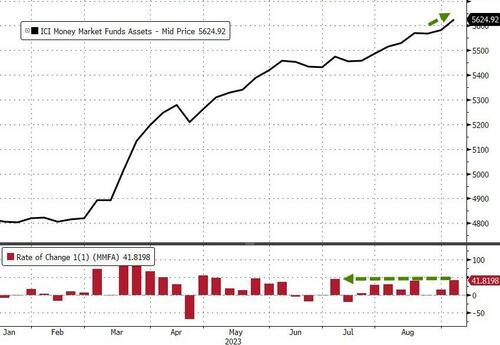
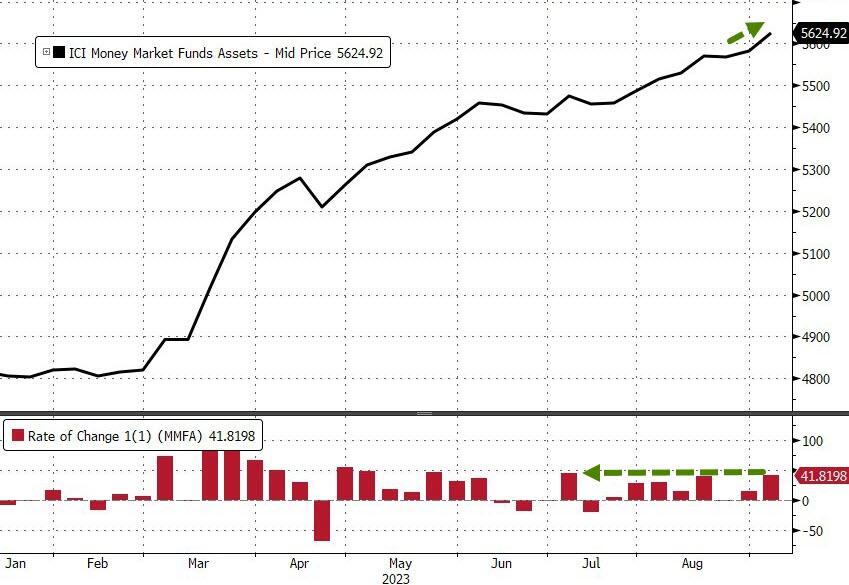
Money-market funds saw inflows for the 7th week of the last 8 with a $42BN jump (the most in 2 months) to a new record high of $5.625TN…
Source: Bloomberg
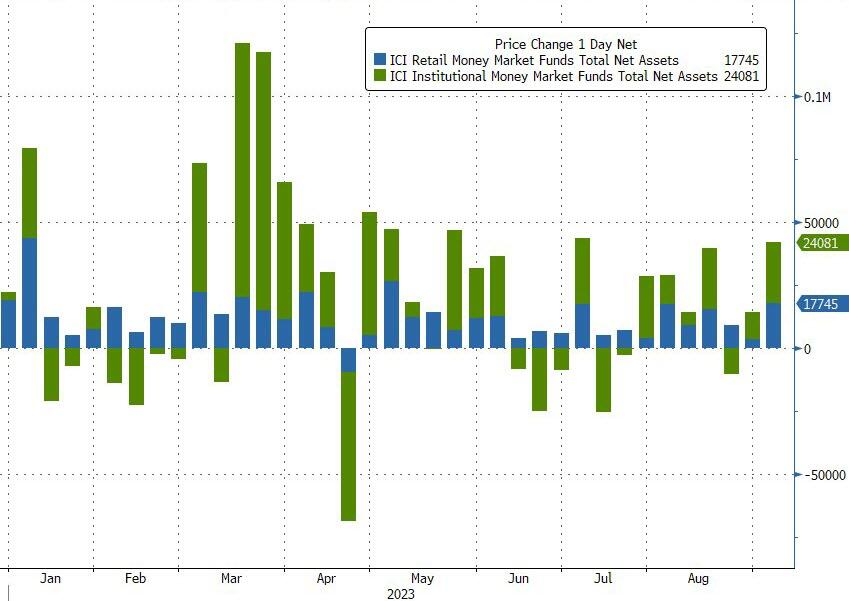
The inflow was dominated by a $24BN increase in Institutional fund assets while Retail also saw a sizable $17.7BN increase…

Source: Bloomberg
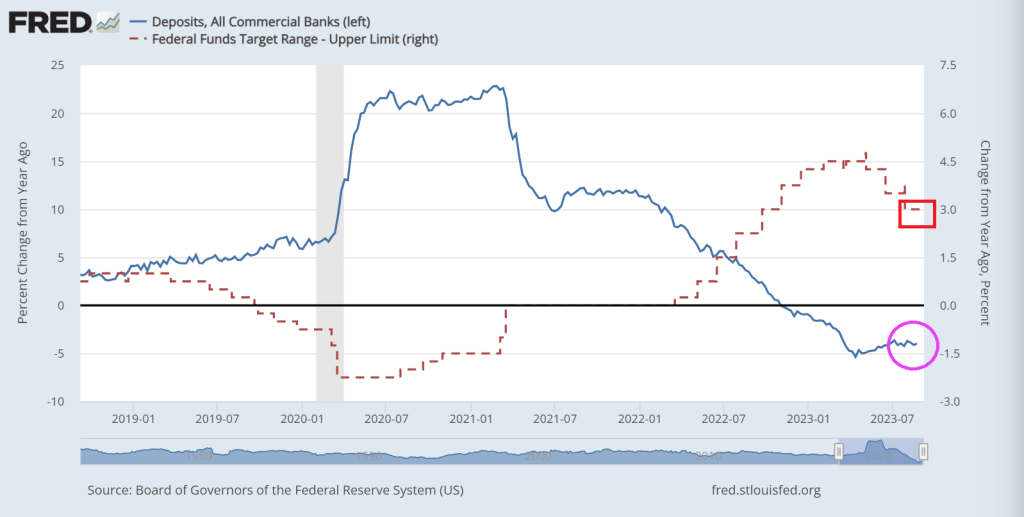
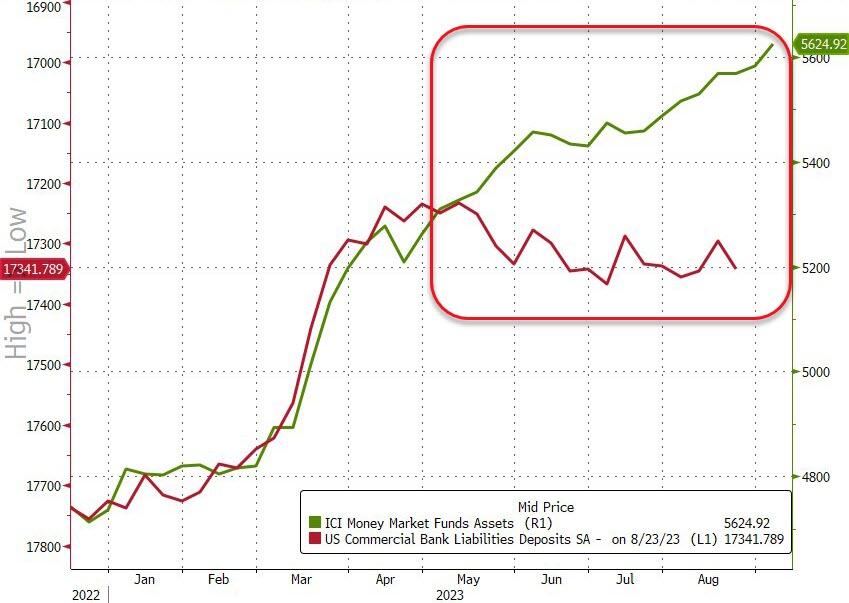
And the divergence between money-market fund assets and bank deposits continues to grow…

Source: Bloomberg
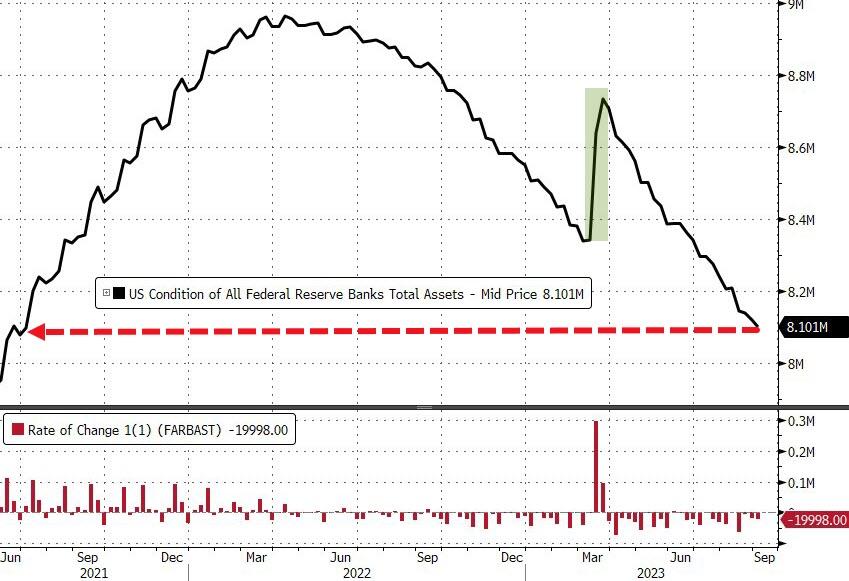
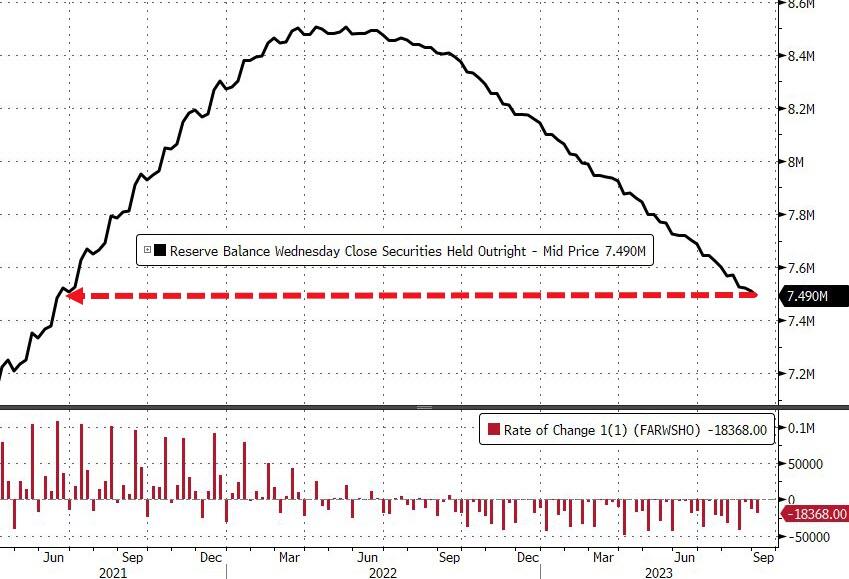
And while we actually saw huge deposit outflows (on a non-seasonally-adjusted basis) – despite The Fed’s seasonally-adjusted deposits increase – The Fed balance sheet shrank by another $20BN last week to its smallest since June 2021…
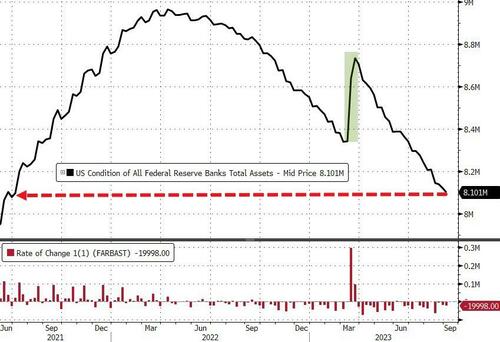
Source: Bloomberg
The Fed’s QT program continues apace with$18.4BN sold last week to its smallest since June 2021…
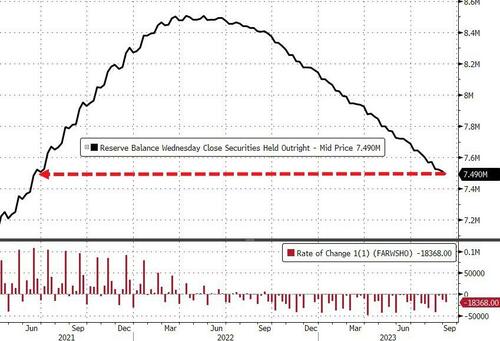
Source: Bloomberg
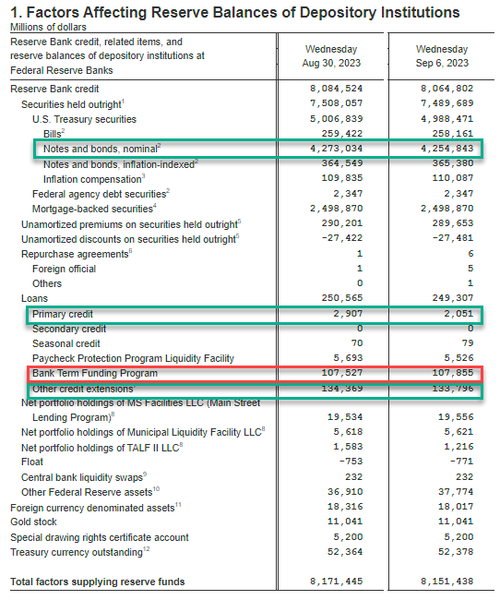
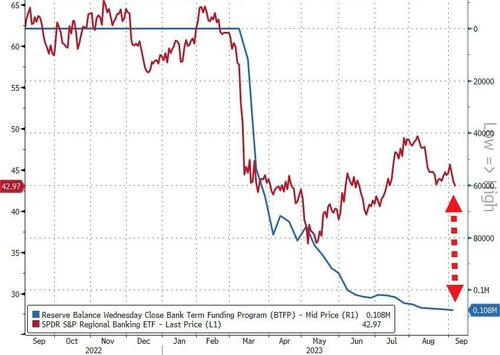
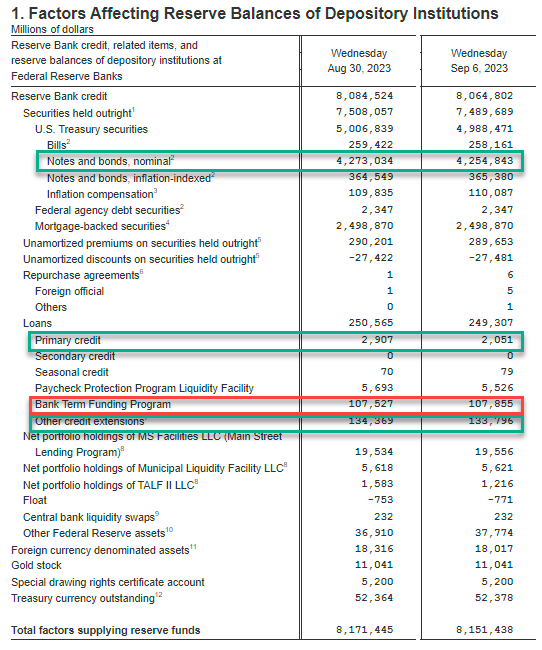
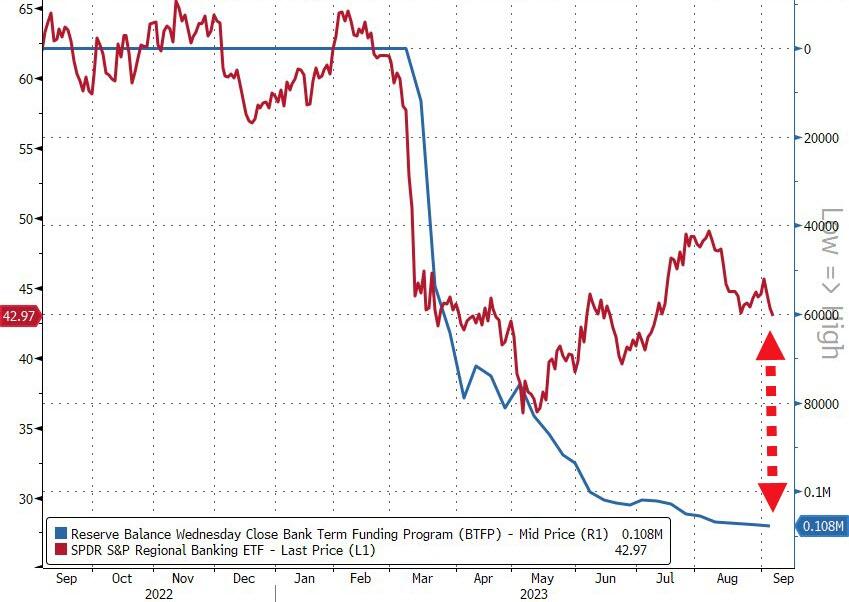
Usage of The Fed’s emergency bank funding facility jumped by $328 Million last week to a new high of $108BN…
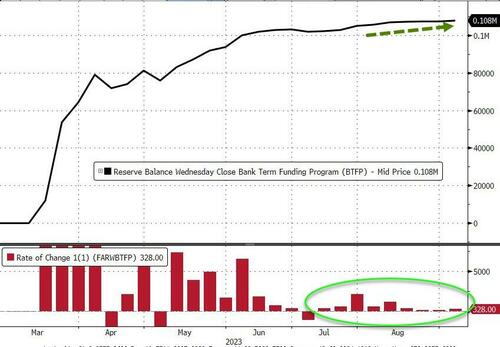
Source: Bloomberg
Fed BS weekly change:
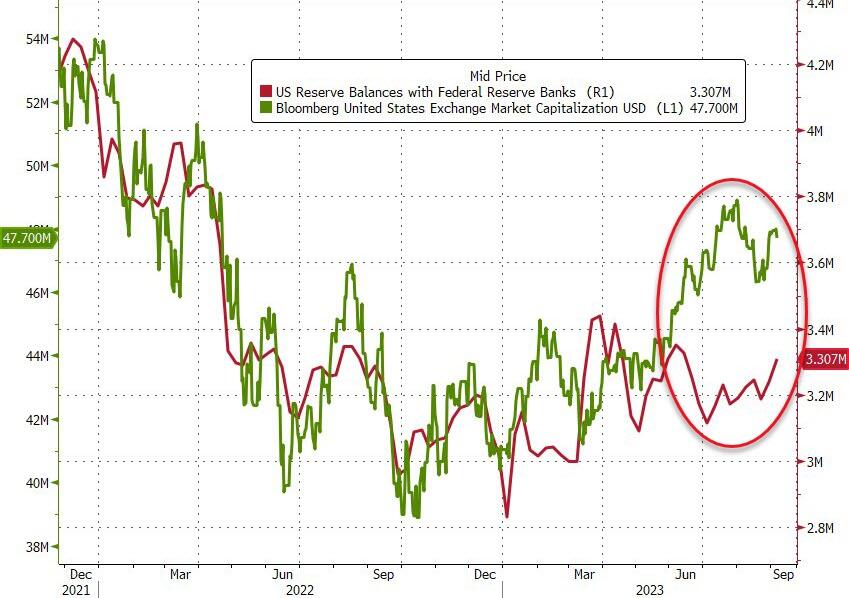
Finally, US equity markets and bank reserves at The Fed have converged a little recently, but the gap remains wide (thanks to the plunge in reverse repo balances)…
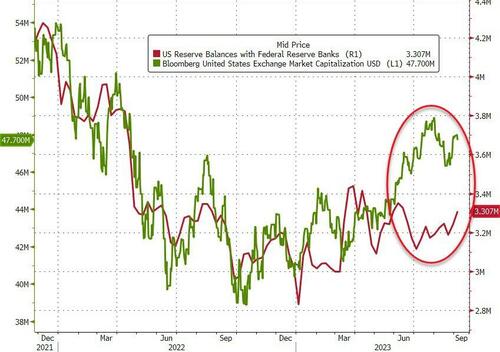
Source: Bloomberg
Tick, tock, banks!
Source: Bloomberg
You have six months to figure out how to clean up the $108 Billion hole in your balance sheet that you’re currently paying The Fed’s exorbitant rates to fill.
Bank deposit growth remains negative as The Fed tightens its overly accomodative monetary policy.
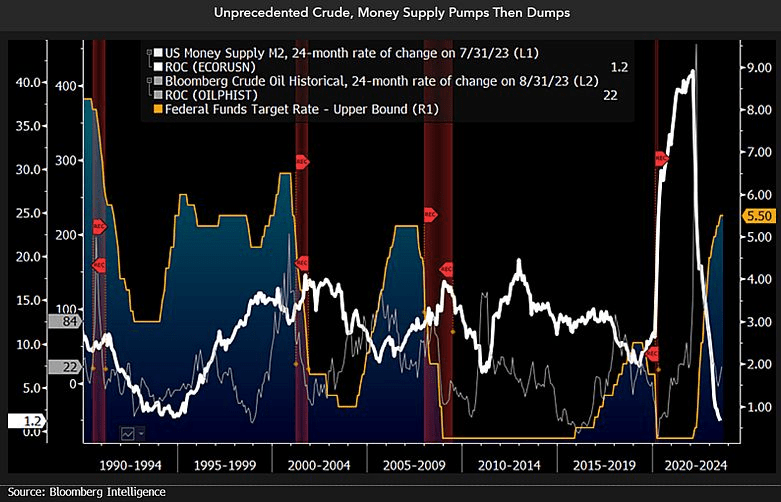
And then we have this chart showing plinging M2 Money (white line fever).
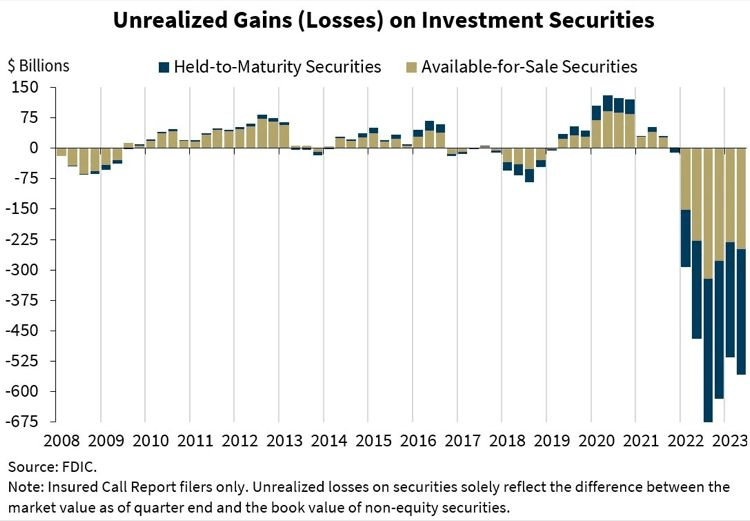
And the horrific unrealized losses on bank’s books.
Bidenomics is failing America. Primarily because Biden was one of the stupidest members of the US Senate. Not to mention nasty. Great President, America! /sarc


You must be logged in to post a comment.