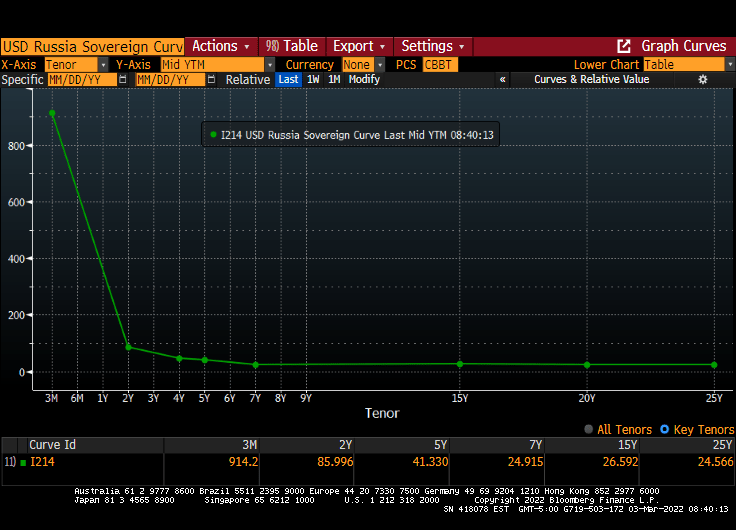
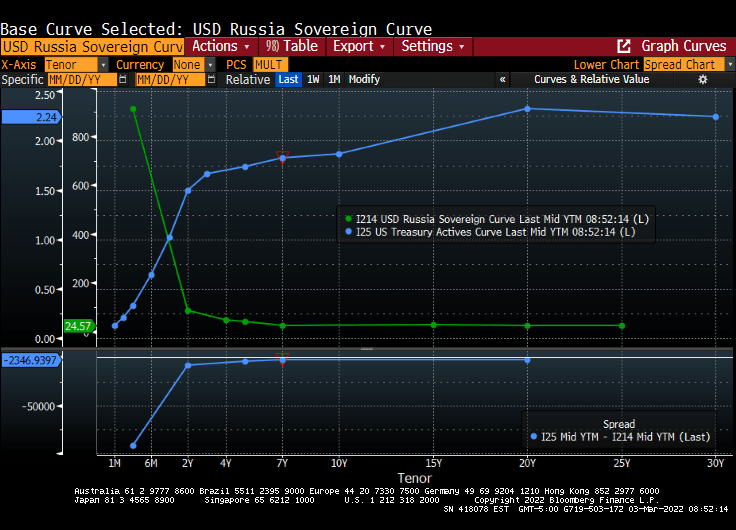
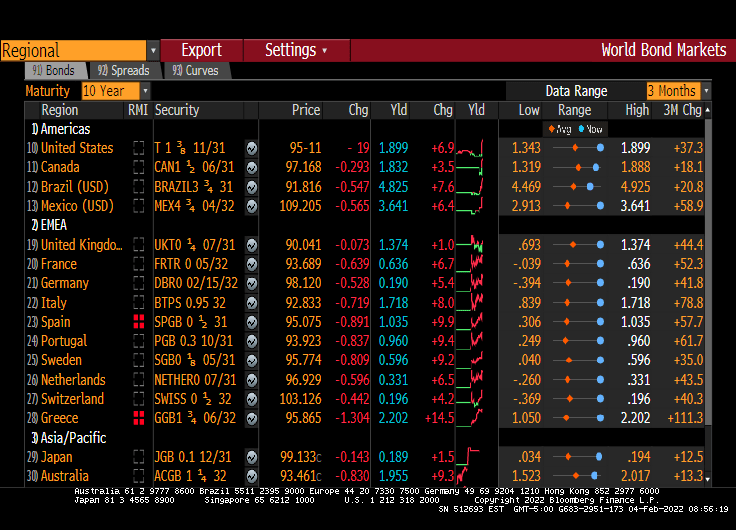
The US still has a steeply upward-sloping yield curve, but Russia has the exact opposite: a steeply downward-sloping or inverted yield curve.
Here is a comparison of the US Treasury Actives curve (steeply-upward sloping) compared to Russia’s sovereign curve (steeply-downward sloping).
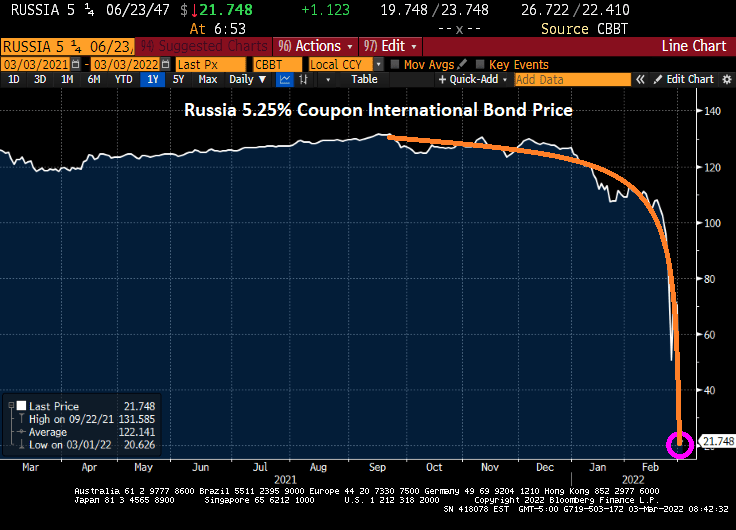
Russia’s technical default on international bonds has led to its 5.25% coupon international bond (denominated in Euros) to plunge from 131.6 in September 2022 to only 21.75 this morning.
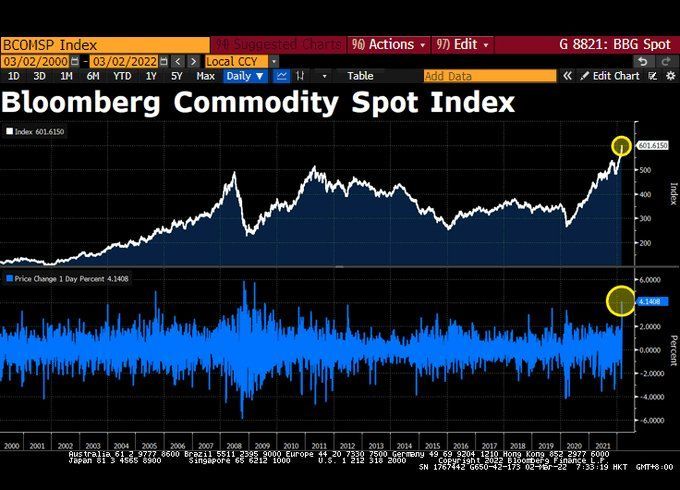
Commodity prices? Commodity prices saw the biggest one-day gain in 13 years on Tuesday.
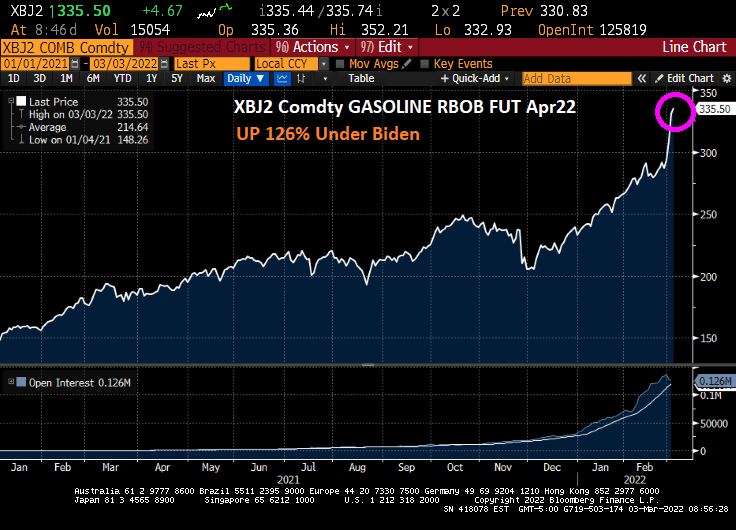
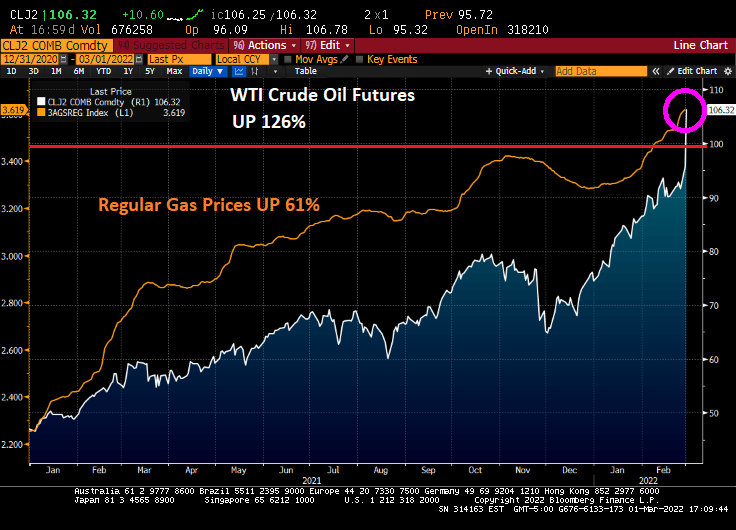
Between Biden’s anti-fossil fuel executive orders and the Russian invasion of Ukraine, gasoline futures are up 126% since the start of January 2021.
President Biden is giving his first State of the Union address tonight with rebuttals from Iowa Governor Kim Reynolds and The Squad’s Rashida Talib (yes, a Republican is giving the rebuttal to Biden’s SOTU speech, and a Democrat is rebutting a Democrat President??)
Let’s look at a short list of Biden’s economic triumphs. I will ignore Biden’s catastrophic Afghanistan withdrawal and his weak response to the Russian invasion of Ukraine.
If you want higher oil and gasoline prices, Biden is a tremendous success.
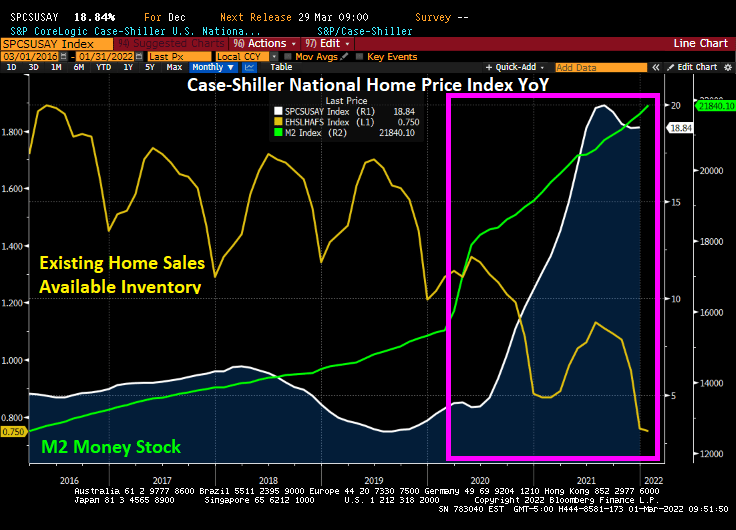
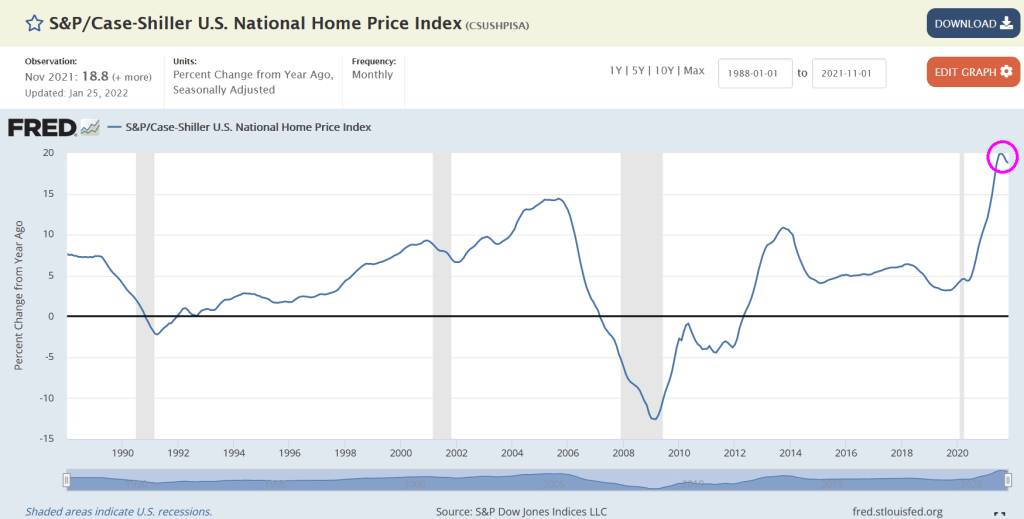
If you like rampant government spending, then Biden is your man. Home price growth is up to 18.84%, making housing unaffordable for millions of American families.
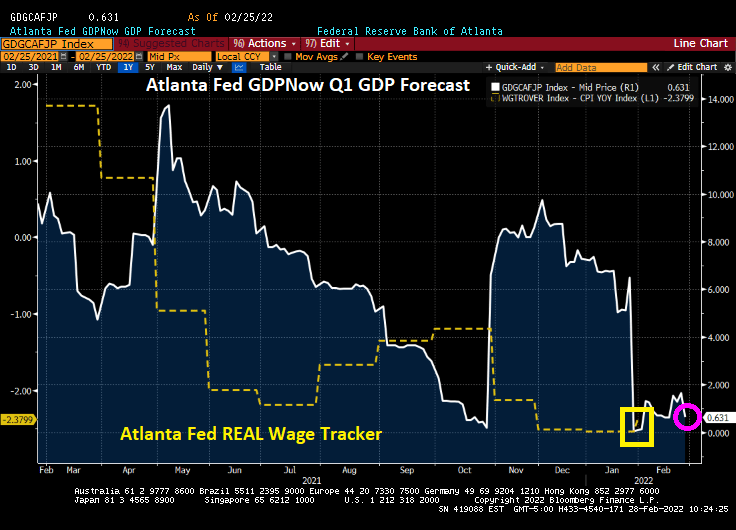
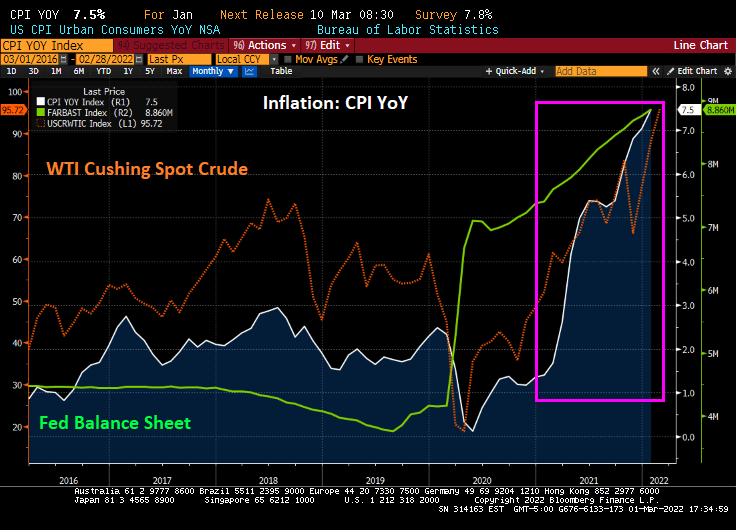
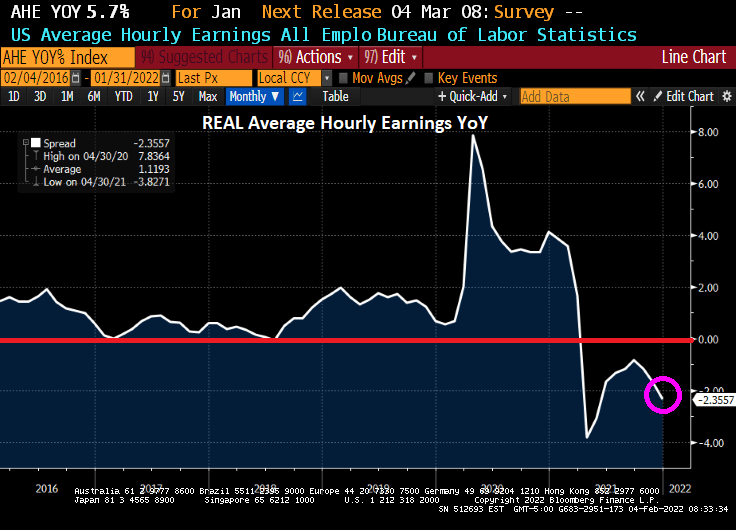
Wages? They are up, but declining after 7.5% YoY inflation. And GDP is almost zero.
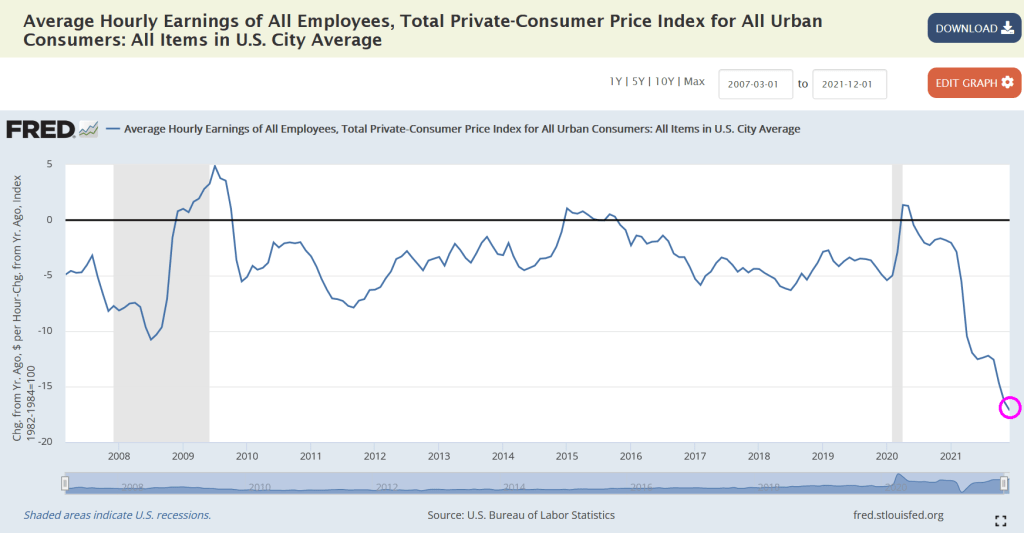
Biden can only point to rising average hourly wages, but not REAL average hourly wages.
Inflation? Highest in 40 years, due to excessive Federal spending, The Fed’s crazy printing and Biden’s energy mandates.
I am scratching my head to think of accomplishments for Biden to mention in the SOTU. But I am sure that he will say something positive. Otherwise, Biden’s SOTU speech should be the Billy Preston song “Nothing from Nothing.“
In January 2020, just prior to the COVID outbreak in the US, the Case-Shiller national home price index was growing at 4% YoY, the Zilliow rent index (all homes) was growing at 2.92% YoY and REAL average hourly earnings were growing at 0.52% YoY.
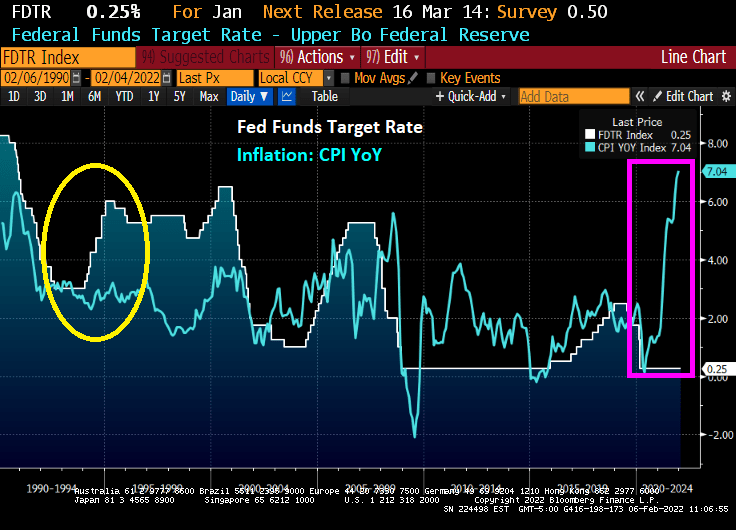
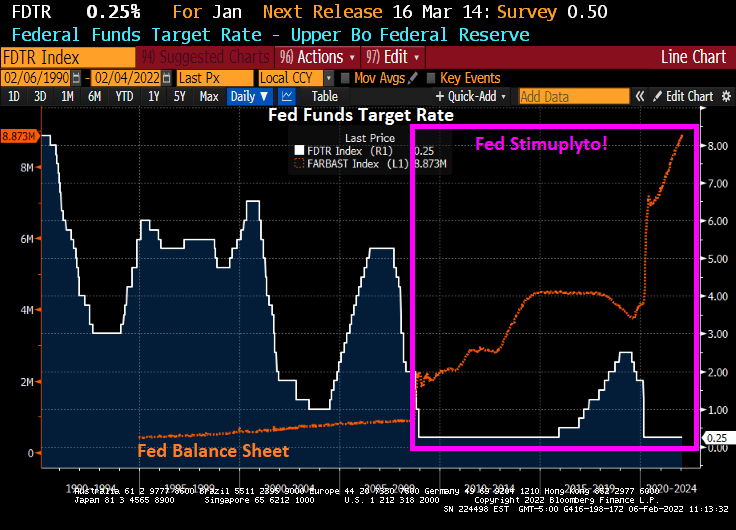
Then COVID struck and the Federal government dumped trillions of dollars of stimulus into the economy and The Federal Reserve massively expanded its balance sheet. Now the US has home prices growing at a 18.8% rate, rents (for those who can’t afford to purchase a home) growing at 14.91% and REAL hourly earnings growing at -1.80%.
The site Apartment List has an even bleaker view of rent growth, with rents in January 2022 having grown by 18% YoY.
Now that COVID is fading, we see New York City rents growing at 33.5% YoY followed by Florida and Arizona cities at 29.3% and higher rates. Irvine CA is seventh at 28%. The slowest growing city is Oakland, CA is growing at only 0.5%.
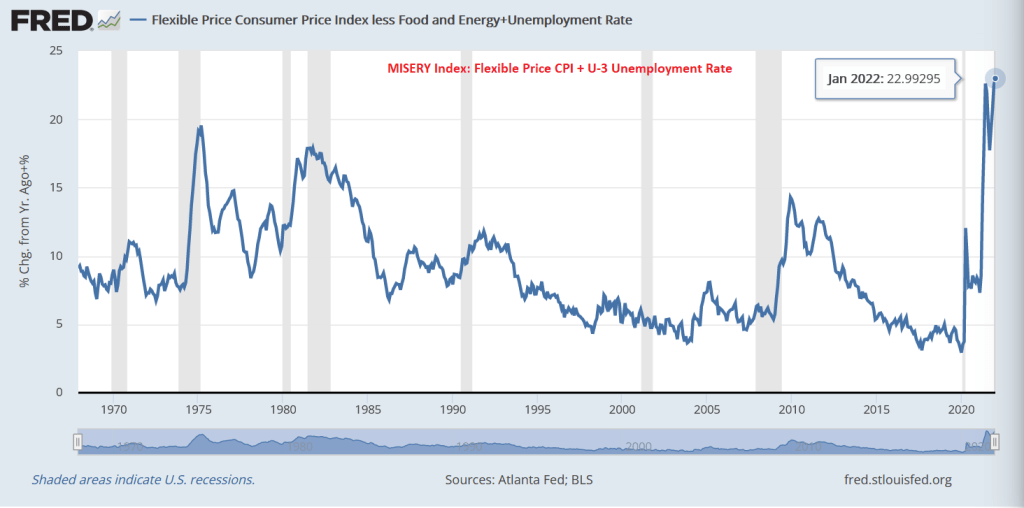
It is truly a miserable time for many Americans as demonstrated by the Misery Index (inflation rate + unemployment rate). But rather than using the CPI YoY measure at 7.5%, I am using the FLEXIBLE CPI YoY to compute the misery index. And is it ever miserable!
In January, the CORE flexible CPI YoY + U-3 unemployment rate hit a modern high at 22.99%. Or at least since 1967.
Like the movie “50 Shades of Gray,” we have 50 shades of inflation. Examples?
How about hardwood? Producer Price Index for hardwood is up 30.8% YoY.
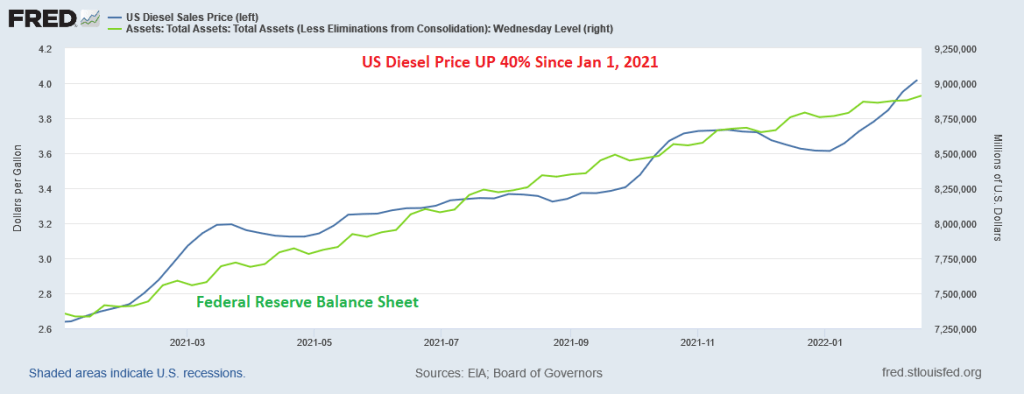
How about diesel fuel prices? They are UP 40% since January 1, 2021.
How about housing? UP 20% YoY according to Zillow’s home value index.
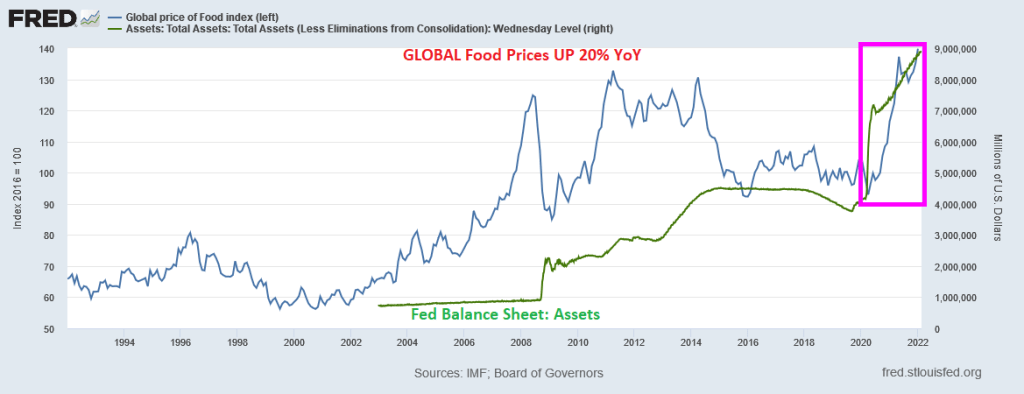
Global food prices? UP 20% YoY.
I could go on and on, but you get the picture. Rising energy, food and construction materials are soaring making many Americans miserable.
But Powell and The Fed have promised to whip inflation. Whip it good … with interest rate increases.
(Bloomberg) What a difference 25 years makes. Worried that inflation was about to turn higher, the Federal Reserve in February 1994 began raising interest rates, taking the federal funds rate from 3% to 6% a year later. As it turned out, those worries were unfounded: The U.S. consumer price index barely budged, finishing the year at 2.7%, right where it had started.
Although inflation in many developed-world countries is now well above those levels — 7% in the U.S. alone — of the major central banks only the Bank of England has started to raise short-term rates. They are now, um, 0.25%. Across the developed world, short rates are still either barely above zero or negative. What’s more astonishing is that even though they have cut their purchases, the Federal Reserve and European Central Bank continue to buy about $140 billion of longer-maturity bonds every month, suppressing long-term yields even as inflation rages.
Some central banks say that rate hikes are coming, but their extraordinary reluctance to deal with actual inflation means it will become entrenched. Not only will policy makers have to raise rates more than they envision, but they will have to cut the size of their massive balance-sheet assets, too. Don’t expect that the process will be anything other than awful for risky assets of all stripes.
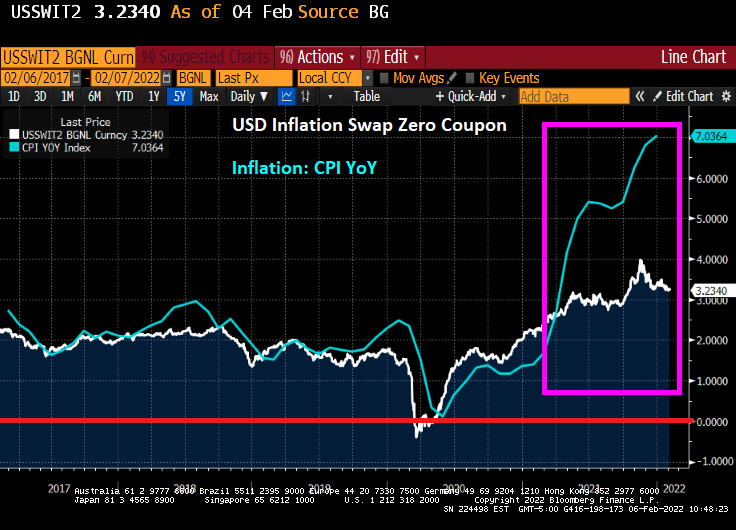
Over the last year and a half, inflation has not only accelerated but also broadened. It started with goods prices and has now expanded to services, even in the moribund euro zone. Central bankers and markets still believe inflation rates will come down a lot. The part of the swaps market that in essence predicts inflation in the future is pricing in a drop in the U.S. CPI to 3.6% by the spring of 2023 and to 3.25% the year after. Alas, like central bankers, the inflation swap market’s record is dreadful. In late spring of 2020, markets predicted a CPI of minus 1.35% a year later and staying below zero by the spring of 2022.
The US DollarInflation Swap is a poor predictor of inflation, at least under President Biden.
I’m not suggesting inflation will remain at current nosebleed levels. More likely is that having had a couple of decades of headline inflation that was on the low side — for central bankers, but not for anyone else — we are in for a few years when it remains above their targets.
Short rates will of course need to rise. That is problem enough for markets, but the bigger problem comes from the trillions of dollars of assets that central banks have accumulated on their balance sheets. Taken together, the Fed, ECB, Bank of Japan, Bank of England and Swiss National Bank have some $27 trillion of assets. In 2007, before the global financial crisis, the combined total was a little more than $4 trillion. Central bank assets will stop growing this year, undermining a major source of support for all types of bonds. But if inflation remains persistently high, central banks won’t simply be able to let their assets roll off as they mature, as most assume. They will have to start selling them. That is the big problem.
Central banks resorted to buying bonds and other financial assets (so-called quantitative easing) for a few reasons. The main one was to drive up inflation and inflation expectations from uncomfortably low levels by injecting more liquidity into the financial system and driving down longer-dated yields. Now that central banks have got much more inflation than they wanted, they will, by the equal and opposite token, need to sell the assets they bought. The longer inflation remains at current levels, the greater the pressure to sell. And they will probably need to do so sooner and faster than most expect and at prices a lot lower than they fetch today. The Fed alone owns about 30% of all the notes and bonds issued by the U.S. Treasury Department.
To say that central bank purchases have had a large effect on yields would be an understatement. One way of seeing this is to split the yield of a longer-dated bond into the part that reflects the expected path of interest rates over the life of the security from everything else. That “everything else” is the term premium. This should compensate investors for, say, sudden surges in inflation. Clearly, this is no longer true. Depending on what model you use, the term premium on 10-year Treasury reached a high of 450 basis points to 500 basis points in the early 1980s. At the nadir of the pandemic, it was minus 100 points and is now about minus 10 points. To be clear, this means that you get less buying a 10-year Treasury than would be suggested by the expected path of rates over the life of the bond — expectations that are almost certainly too low.
Term premiums below zero suggest bond investors are no longer compensated for things like inflation.
The driving down of government bond yields also compressed yields and spreads on investment-grade and junk bonds. That was the intent. Junk spreads reached their narrowest level ever in June of last year. With so little yield available in fixed income and central banks seemingly always on hand to bail them out, investors flooded into equities. As a result, many developed-world equity indexes are either very expensive or, in the case of the U.S., not far off their most expensive levels ever based on valuation measures that are a decent guide to future returns. That is what a decade and a half of market manipulation by central banks has done.
The policies of zero or negative rates and seemingly infinite QE looked idiotic (and were) when they were adopted, and time has not been kind. Paradoxically, they could only be sustained if central banks were wrong, and their policies failed to spark inflation. Now that inflation has taken hold, rates will go up substantially and balances sheets will need to shrink.
What would you pay for fixed-income assets now if you knew that central banks will become, in effect, forced sellers later? I can’t see how any financial asset will escape the damage from the likely lurch higher yields. The way out of these policies will be as nasty as the way in was nice.
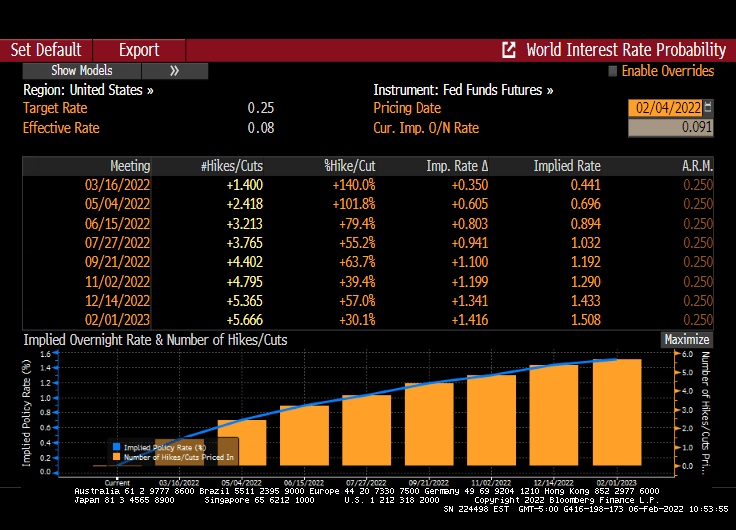
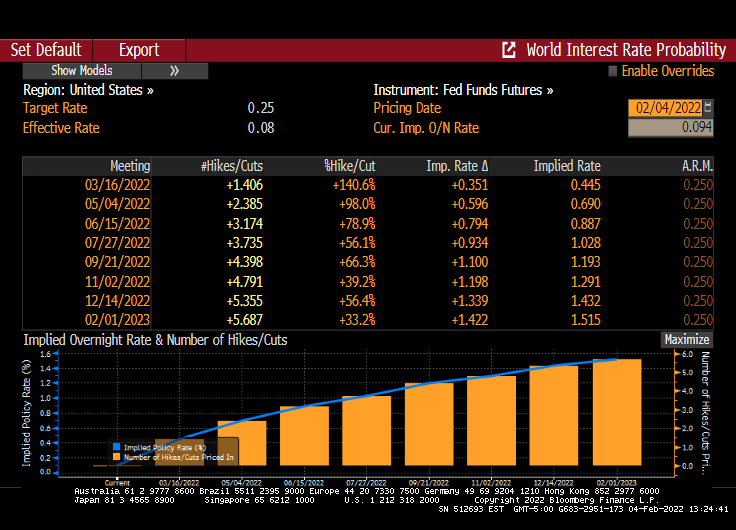
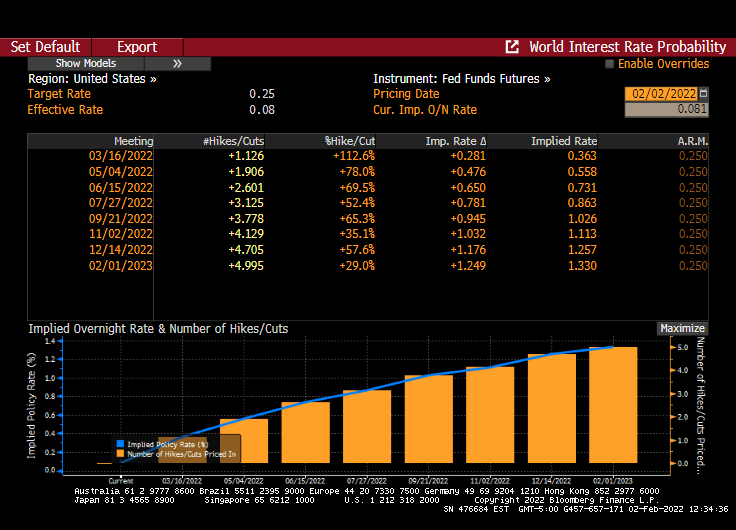
Particularly since Fed Funds Futures are pointing toward 6 rate increases over the next year.
At least Treasury Secretary Janet Yellen is wearing her Mao jacket.
US 30-year mortgage rates are up 100 basis points and climbing since January 4, 2021. Most of the increase has occurred since the turn of the year into 2022. According to the Bankrate 30-year mortgage rate index, the 30-year rate is up 57 basis points just since December 31, 2021 as the benchmark 10-year Treasury yield rises.
Bear in mind that the REAL 30-year mortgage rate is now -3.2%. Get it while you can!!
Given today’s surprise jobs report, The Fed now has a green light to raise rates.
How bad is inflation in the USA? Try 18%, based on the Flexible Consumer Price Index.
The Flexible Price Consumer Price Index (CPI) is calculated from a subset of goods and services included in the CPI that change price relatively frequently. Because flexible prices are quick to change, it assumes that when these prices are set, they incorporate less of an expectation about future inflation.
Again, remember that Federal inflation numbers woefully undercount housing and rent inflation. For example, the Case-Shiller National Home Price index (as of November 2021) was growing at 18.8%.
The sad part is that inflation-adjusted average hourly earnings growth of all employees is crashing thanks to inflation.
Well, the COVID hysteria from the Biden Administration and the media preparing us for a horrible jobs report was … incorrect. In fact, the January jobs report was “exceptional”. 467,000 jobs were added and average hourly earnings growth ROSE to 5.7% YoY.
The bad news? Thanks to surging inflation, REAL average hourly earnings growth YoY FELL to -2.36%.
Unemployment ROSE to 4.0% from 3.9% as more people dropped out of the labor force in January. On the bright side, labor force participation rate rose to 62.2% from 61.9%.
Leisure and hospitality employment (one of the most vulnerable to inflation) expanded by 151,000 in January, reflecting job gains in food services and drinking places (+108,000) and in the accommodation industry (+23,000).
The reaction in the bond market? US 10-year yields are up 6.9 basis points as Eurozone is up across the board.
Energy prices are up (except natural gas futures).
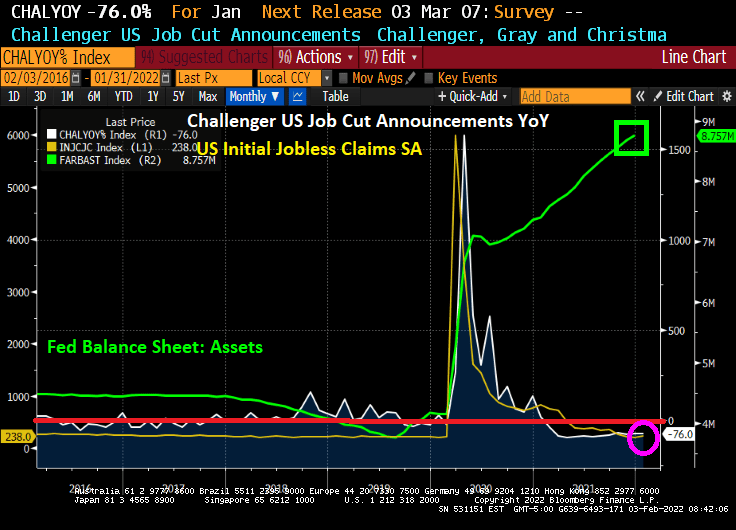
Between the Biden Administration, Anthony Fauci and the media constantly screaming about the devastating effects of Omicron, I would have expected massive job cuts and a large spike in jobless claims. But alas, the numbers and charts tell a different story.
Today, we saw that the Challenger job cuts for January fell further to 76%. Initial jobless claims fell to 236k. And The Federal Reserve is still hyper-stimulating the economy.
After listening to Biden spokesperson Jen Psaki preparing us for an end-of-times job report, I was expecting today’s news dump to be terrible. But alas, it just looks like another day in Stimulyoptoville.
Hey Jen, where’s the beef? Now that I think of it, Jen Psaki looks like Wendy from the burger franchise. Except that the burger Wendy doesn’t terrify people.
Hey, I thought the vaccine mandates and masks were supposed to stop COVID and its mutations in its tracks!
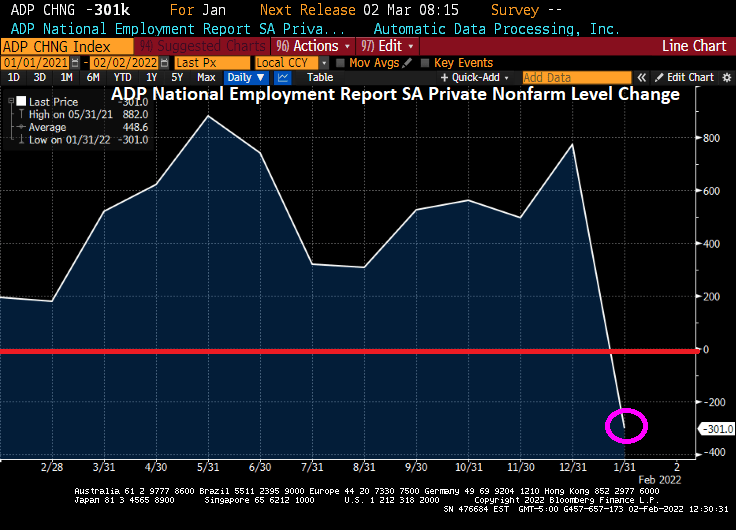
Instead, Omicron has taken a much bigger bite out of the labor market than expected, data from payroll processing firm ADP indicated Wednesday.
The number of workers on private payrolls fell by 301,000 in January, falling far short of expectations for growth of 225,000 jobs.
This was the first decline in payrolls reported by ADP since 2020.
The leisure and hospitality sector shed 154,000 jobs. Trade, transportation, and utilities dropped 62,000 workers. Other services saw payrolls decline by 23,000. Health and education jobs fell by 15,000. Information technology jobs fell by 8,000 and financial services sank by 9,000.
Manufacturers cut 21,000 positions. Construction declined by 10,000. Mining and natural resources added 4,000.
All told, the services sector’s payrolls fell by 274,000 and the goods-producing sector’s payrolls dropped by 27,000.
The Department of Labor will report the official count for January jobs on Friday. It is expected to show that jobs grew by around 170,000 but that may be an underestimate of the impact of omicron.
Since Omicron can be readily blamed for ADP report, it doesn’t look like it has affected the implied probability of 5 rate hikes over the next year.


You must be logged in to post a comment.