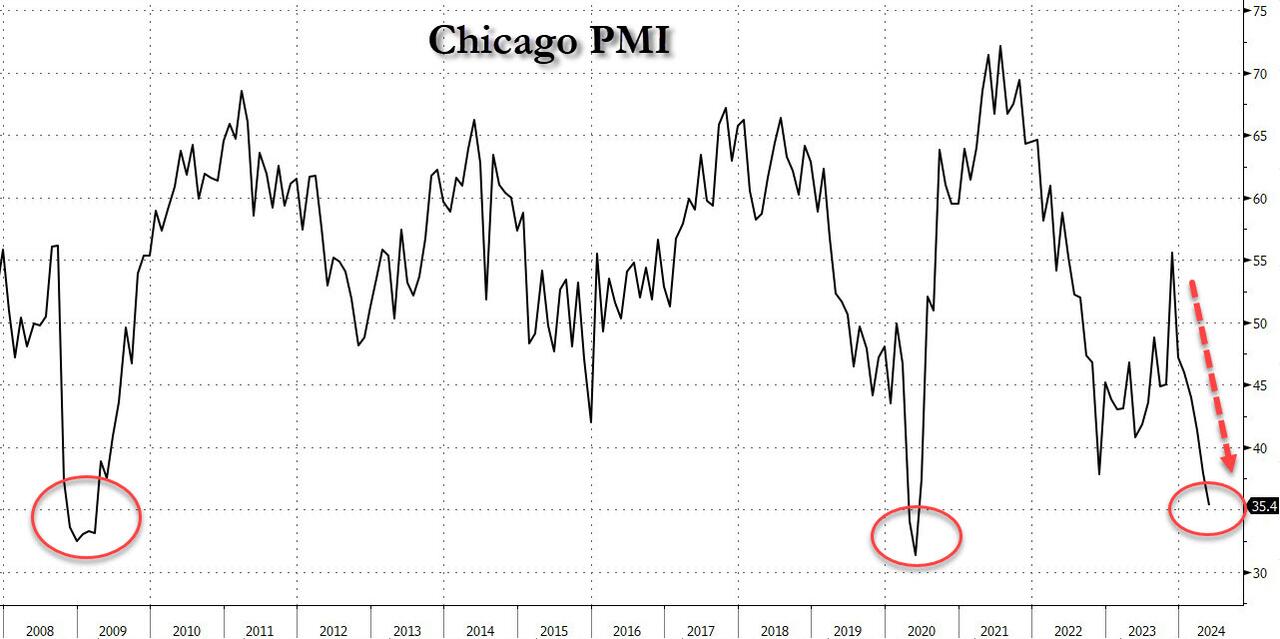
… which seems to suggest that at least according to Chicago-based purchasing managers, the economy is in a depression.
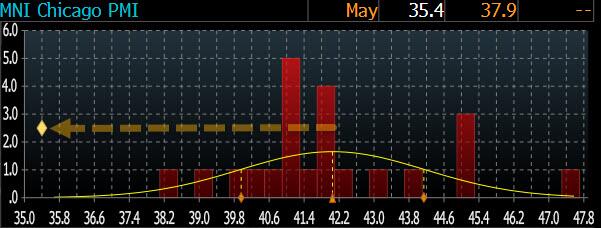
This is how the final number looked relative to expectations.
Looking at the report we find the following:
Business barometer fell at a faster pace; signaling contraction
New orders fell at a faster pace; signaling contraction
Employment fell at a faster pace; signaling contraction
Inventories fell at a faster pace; signaling contraction
Supplier deliveries fell at a slower pace; signaling contraction
Production fell at a slower pace; signaling contraction
Order backlogs fell at a faster pace; signaling contraction
Did nothing rise? One thing did:
Prices paid rose at a slower pace; signaling expansion
So we have not just a depression, but a stagflationary depression in which everything else is going to hell, except prices: they keep on rising.
And while it is unclear what has prompted this unprecedented bearishness (the surely negative contribution from Boeing is likely to blame for a substantial portion of the apocalyptic outlook), one thing is certain: Goldman will have to come up with even more goalseeked surveys that explain away reality and tell us how purchasing managers really should feel…
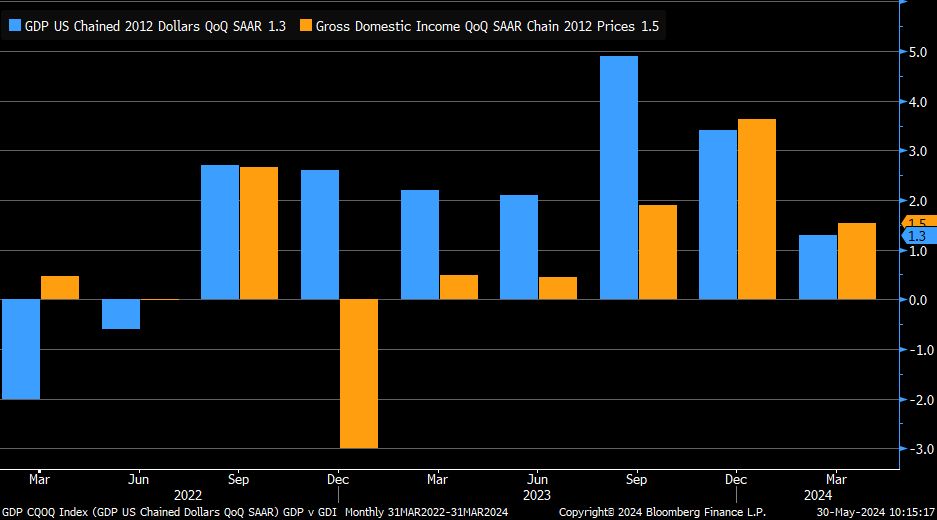
On the good news front, REAL Gross Domester Income rose to 1.5%.
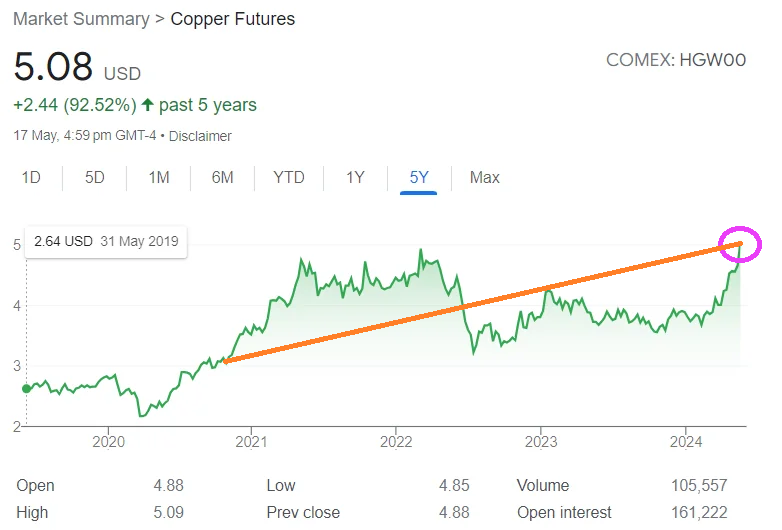
As copper prices keep on rising. Which is bad news for Biden’s shift to EVs! (Once again, Biden is driven around in gas guzzling Chevy Tahoes/Suburbans and owns a Chevy Corvette). There isn’t enough copper production to build the EVs that Biden wants.
I have testified and sat through many trials in New York city and have never seen a court case quite like the one the Trump lost with the Judge effectively telling the jury to find Trump guilty.
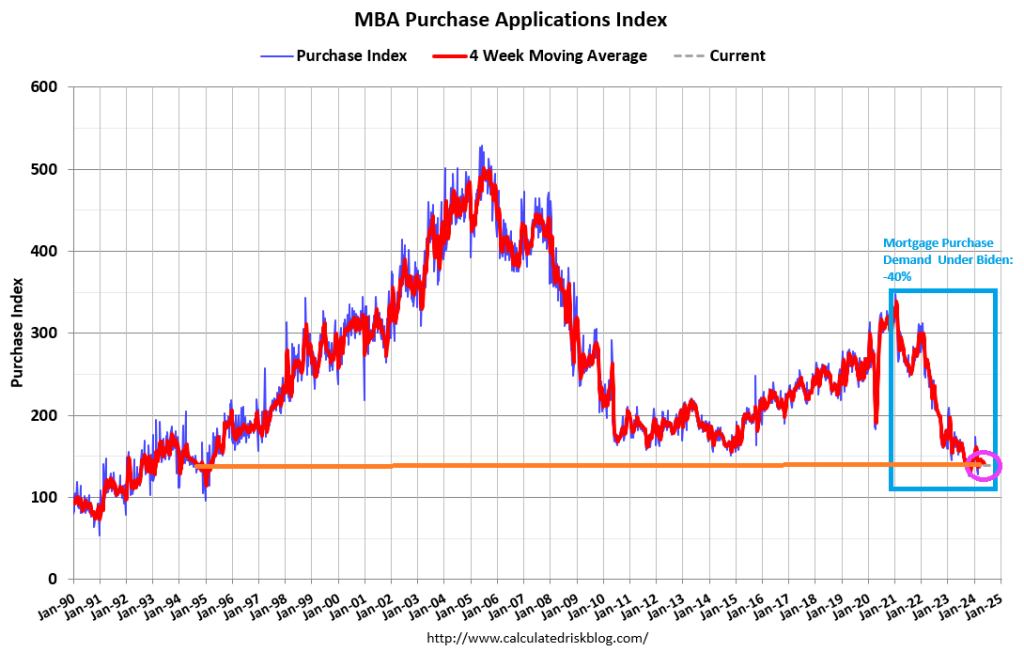
The Market Composite Index, a measure of mortgage loan application volume, decreased 5.7 percent on a seasonally adjusted basis from one week earlier. On an unadjusted basis, the Index decreased 6.3 percent compared with the previous week. The seasonally adjusted Purchase Index decreased 1 percent from one week earlier. The unadjusted Purchase Index decreased 3 percent compared with the previous week and was 10 percent lower than the same week one year ago. And -40% under Biden.
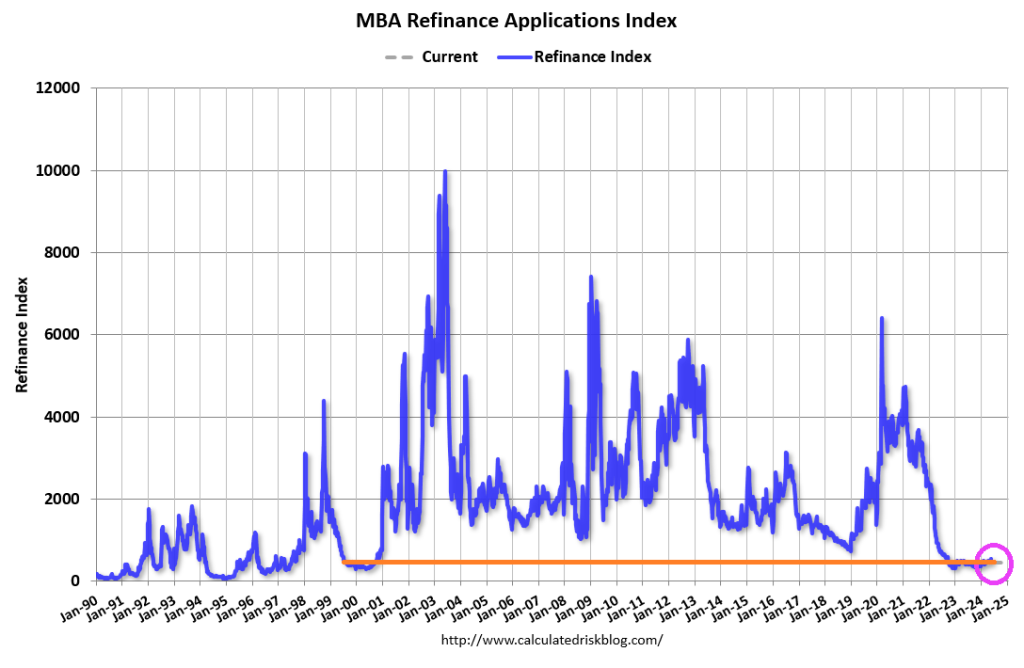
The Refinance Index decreased 14 percent from the previous week and was 12 percent higher than the same week one year ago.
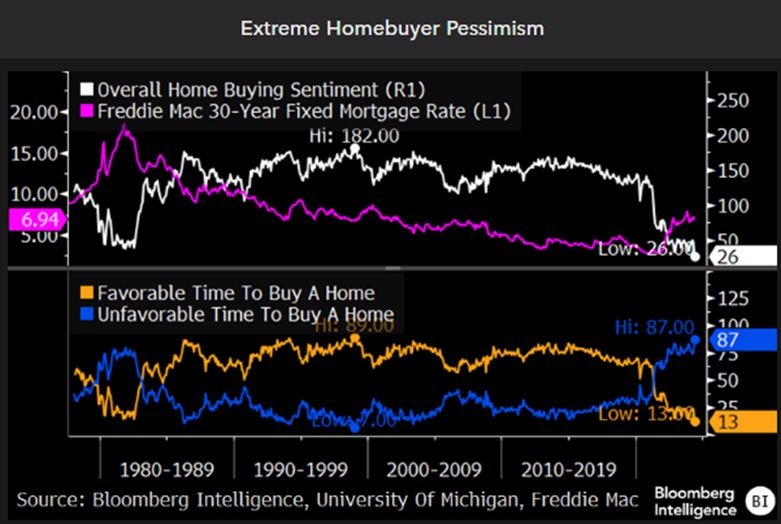
It is still an unfavorable time to buy a home!
From the film “Ronin” that sums up actor Robert DeNiro in one sentence.
Spence (Sean Bean): “You know, you think too hard.” Sam (Robert DeNiro): “Nobody ever told me that before.”
How would DeNiro consider the 40% drop in mortgage purchase demand under Biden?
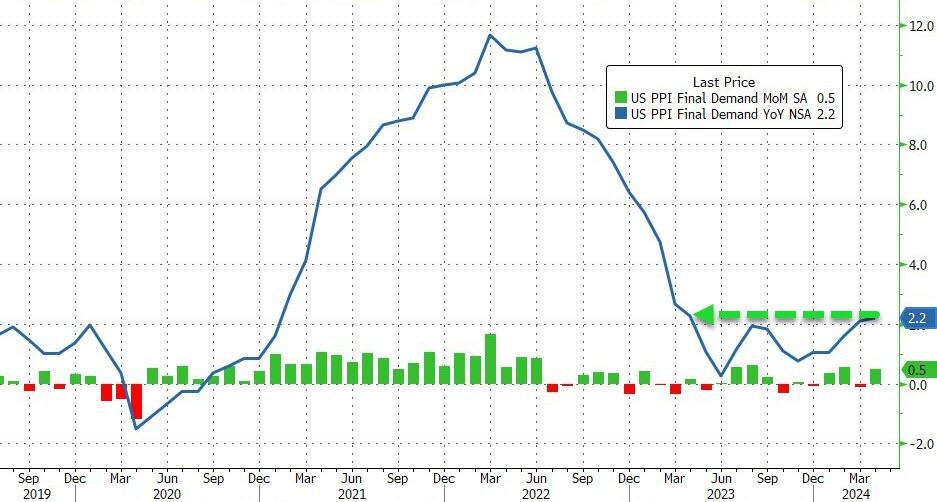
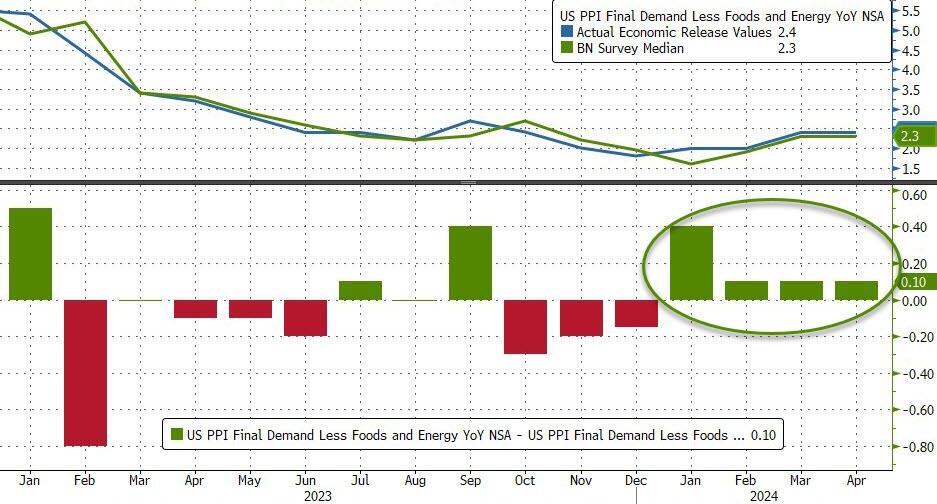
April Producer Prices rose 0.5% MoM (vs +0.3% exp), with March’s +0.2% MoM revised down to -0.1% MoM. The downward revision did not stop the YoY read rising to 2.2% (from +2.1% in March)…
Source: Bloomberg
This is the highest YoY read since April 2023 and is the fourth hotter than expected headline PPI print…
Source: Bloomberg
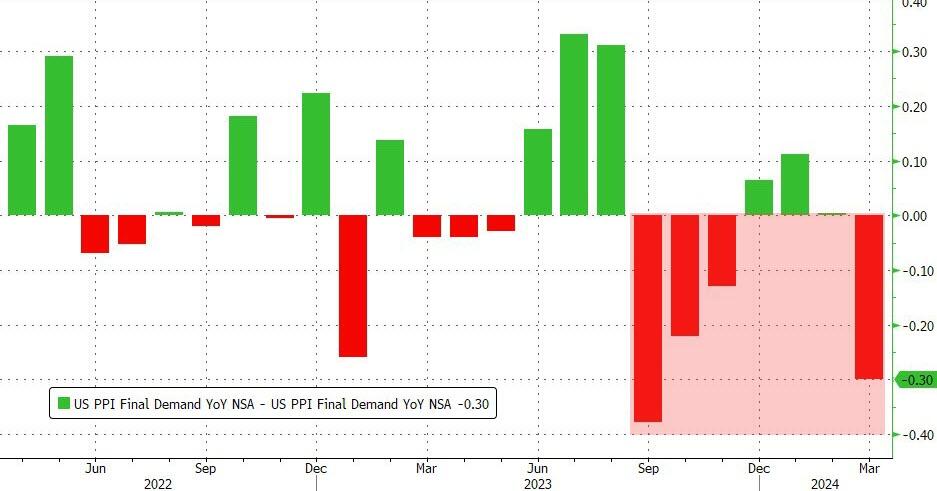
Producer Prices have been aggressively downwardly revised for 4 of the last 7 months…
Source: Bloomberg
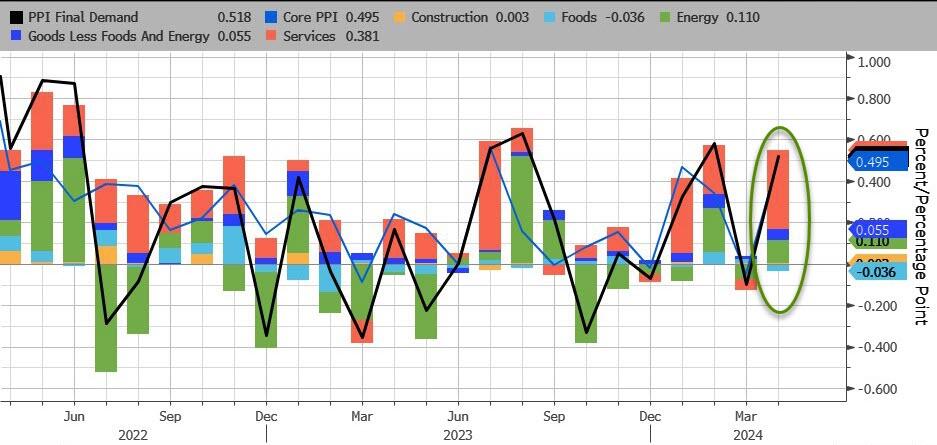
Services costs soared, dominating April’s PPI gains with Energy the second most important factor. Food prices actually declined on a MoM basis.
Source: Bloomberg
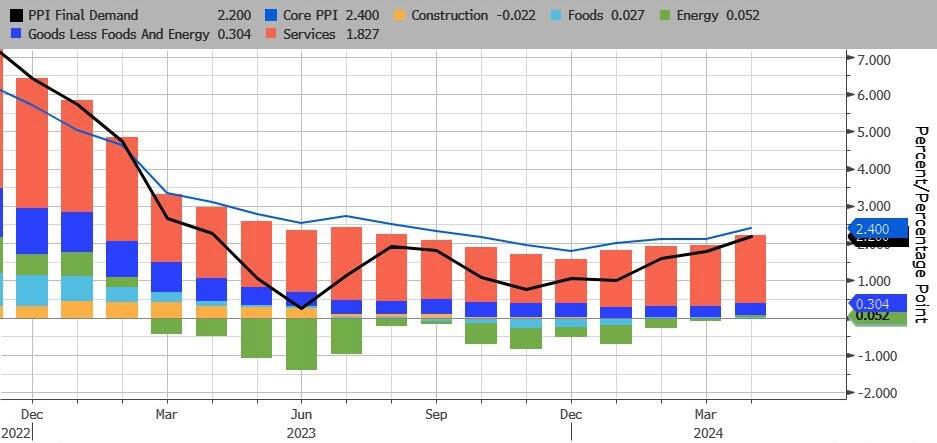
On a YoY basis, headline PPI’s rise was dominated by Services (rising at their hottest since July 2023). For the first time since Feb 2023, none of the underlying factors were negative on a YoY basis…
Source: Bloomberg
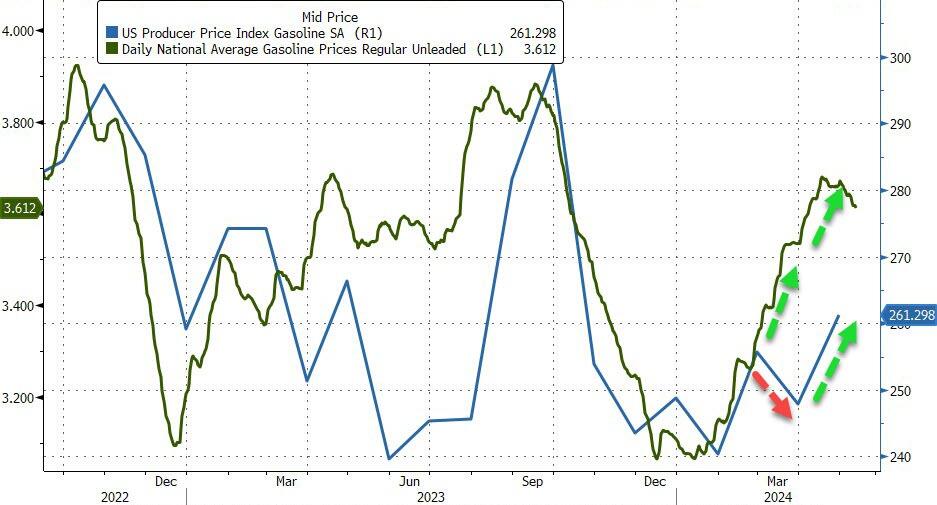
After last month’s farcical ‘seasonally adjusted’ gasoline price, April saw the PPI Gasoline index rise (with actual prices at the pump) but still has a long way to go…
Source: Bloomberg
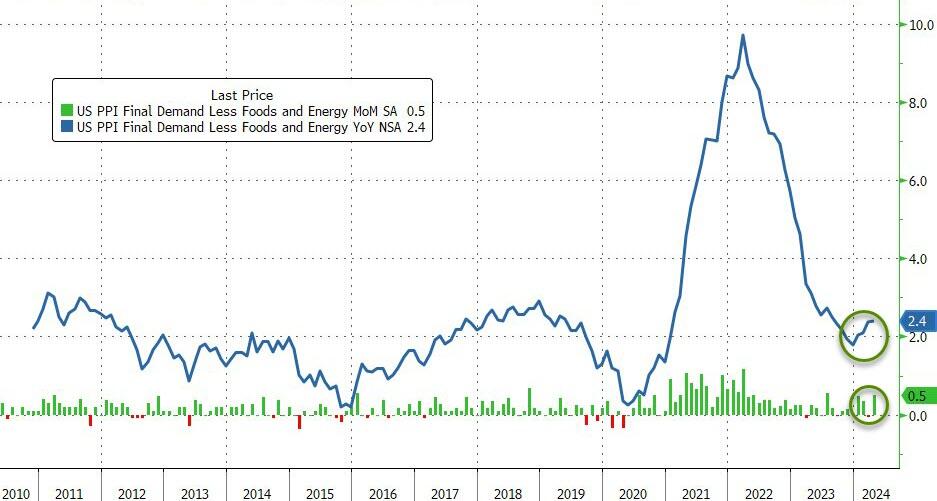
Core PPI was worse – rising 0.5% MoM (more than double the +0.2% MoM expected) – which pushed the Core PPI YoY up to +2.4%…
Source: Bloomberg
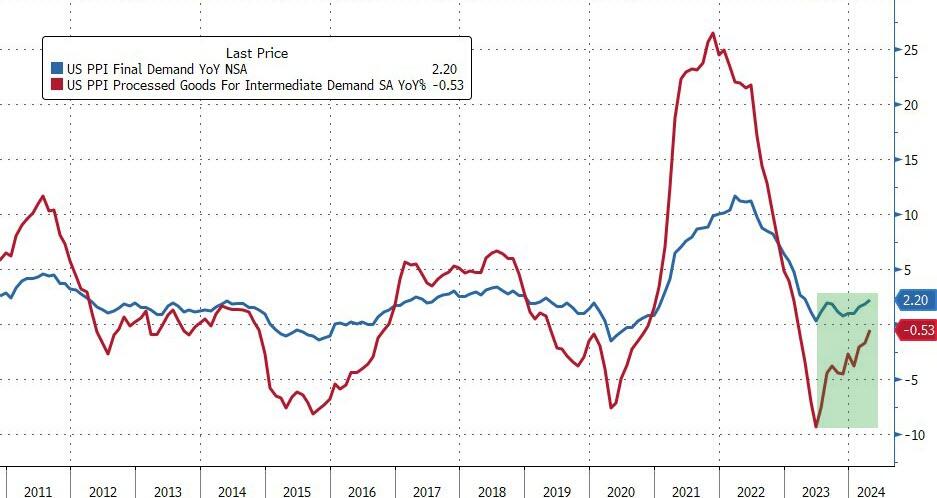
And finally US PPI Final Demand Less Foods Energy and Trade Services rose by 0.4% MoM and 3.1% YoY (the highest in 12 months).
Worse still the pipeline for primary PPI is not good as intermediate demand is starting to accelerate…
Source: Bloomberg
Over the past month, ‘higher prices’ have dominated ‘lower prices’ in recent survey data…
Higher producer prices:
New York Empire manufacturing price paid advanced to 33.7 from 28.7.
Philadelphia Fed manufacturing reported prices paid gained to 23.0 from 3.7 in March.
Philadelphia Fed non-manufacturing prices paid rose to 31.0 from 26.6 in the prior month.
Richmond Fed services prices paid rose to 6.11 from 5.43 in March.
Kansas City Fed manufacturing prices paid advanced to 18 from 17.
Kansas City Fed services input price growth continued to outpace selling prices.
S&P Global manufacturing input cost inflation quickened to hint at sustained near-term upward pressure on selling prices.
ISM Manufacturing prices paid gained to 60.9, the highest since June 2022, from 55.8 in March.
ISM Services prices paid notched up to 59.2, the highest since January, from 53.4 in March.
Lower producer prices:
New York Fed Services prices paid fell to 53.4 from 55.1 in March.
Richmond Fed manufacturing growth rates of prices paid dipped to 2.79 from 3.22 in March
Dallas Fed Manufacturing outlook reported prices paid for raw materials dropped to 11.2 from 21.1 in the prior month.
Dallas service sector input prices index nudged down to 28.8 from 30.4 in the prior month.
S&P Global Service saw input costs slowed from six-month highs in March.
Do you see the ‘flation’ now, Jay?
So, no, The Fed does not have inflation under control.
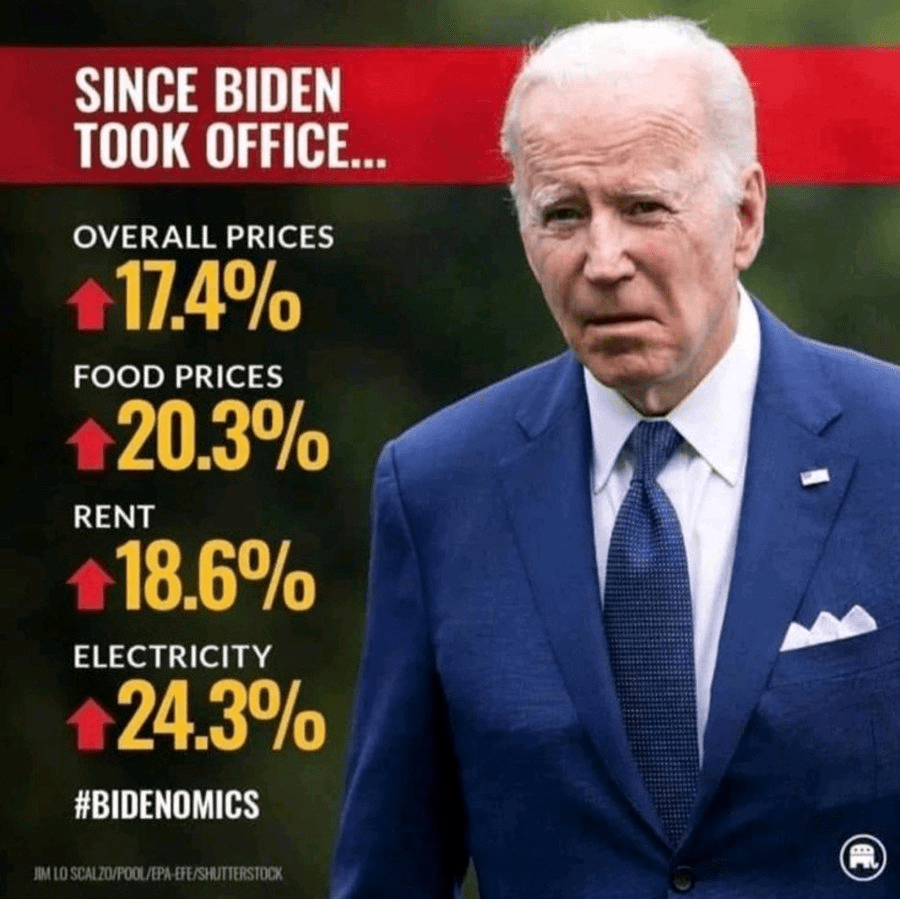
Despite Biden’s rambling that inflation is improving, bear in mind that the inflation rate is at it highest in 50 years. Yes, it has improved from 18% in 2022 to above 10% today.
A recent research paper by four noted economists, including Larry Summers, the former Treasury Secretary under Barack Obama and former Harvard President, discovered that the real inflation rate during the Biden years, using pre-1983 calculations reached 18% in 2022.
The number is the highest inflation rate the country has seen in over 50 years.
Bidenomics is really about insane money printing after Covid and the installation of Biden as President. Biden and The Federal Reserve are both pushin’ too hard. Biden to fundamentally change the US and The Fed trying to cope with the inflation reaction. With Covid and then Biden’s selection as President, Federal outlays exploded (blue line) and remain elevated under Biden. To help finance the (outrageous) spending The Federal Reserve massively increased the M2 Money supply (green line). Now, The Fed has withdrawn some of the excessive monetary stimulus, but there is a staggering amount monetary stimulus still swimming around the economy like a Great White Shark.
The problem with Federal policies (energy, government spending, government debt) is that there are unpredictable factors that undo the best laid plans of mice and men. And rats such as crop blights and changes in consumer habits.
A good example is the Strategic Petroleum Reserve, which can be drained if craven politicians want to manage oil and gasoline prices for political purposes. Unfortunately, the promise of replenishment is made difficult by rising crude oil prices. The Biden admin cancels plan to refill emergency oil reserve amid high prices (some caused by factors such as war, often caused by government).
In fact, spot crude is up 73% under Biden. Partly, because of Biden’s promised war on fossil fuels and international disasters like war, blights, etc. This is why I cringe when I hear politicians and “economists” discuss why inflation will fall.
On the food side, we have cocoa prices rising 136% under Biden. Again, not predictable when policies were being made. Combine crop blights were rising transportation costs and DC, we have a problem! But this is one reason why The Fed, etc, focus on core inflation (excluding energy and food prices).
There are many examples of rising prices and how they hurt consumers, particularly middle-class and low wage workers.
How did The Federal Reserve react to the inflation Biden helped create? They raised The Fed Funds Target Rate (Upper Bound) by 2,100% to combat Bidenflation. Freddie Mac’s 30-year mortgage rate is up 156% helping to crush homeownership aspiration for younger households.
And then we have Congress/Biden shoveling more than $10 billion in subsidies to Intel, even though Intel has an incentive to develop chips using borrowed funds and Intel retained earnings. But why put your shareholders at risk in case the chip gamble doesn’t payoff. Just shift the risk to US taxpayers!
First, online shopping has crushed retail commercial space. Second, crime is rampant in The Big Apple. A slowing economy is contributing to the malaise in commercial real estate (CRE).
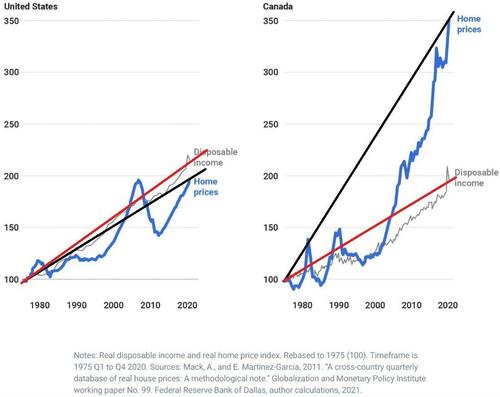
According to Bloomberg, Canadian pension funds – which until recently had been among the world’s most prolific buyers of real estate, starting a revolution that inspired retirement plans around the globe to emulate them because, in the immortal words of Ben Bernanke, Canadian real estate prices never go down…
Canada Pension Plan Investment Board has recently done three deals at deeply discounted prices, selling its interests in a pair of Vancouver towers, and a business park in Southern California, but it was its Manhattan office tower redevelopment project that shocked the industry: the Canadian asset manager sold its stake for just $1. The worry now is that such firesales will set an example for other major investors seeking a way out of the turmoil too, forcing a wholesale crash in the Manhattan real estate market which until now had managed to avoid real price discovery.
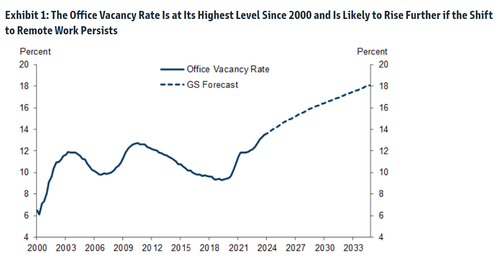
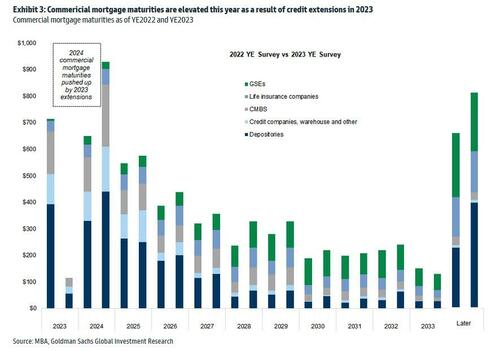
Indeed, as Goldman wrote earlier this week, while office vacancy rates are expected to keep rising well into the next decade..
… the average price of many nonviable offices has fallen only 11% to $307/sqft since 2019 (left side of Exhibit 6). The bank goes on to note that in the hardest-hit cities, as many as 14-16% of offices may no longer be viable, and their average transaction prices have already declined by 15-35%. However, because of lack of liquidity in this market, these recent transaction prices have not yet started to reflect the current values of many existing offices. Goldman ominously concludes that “alternative valuation methods, like those that are based on repeat-sales and appraisal values, suggest that actual office values may be far lower than the average transaction price.” Well, a $1 dollar price would certainly confirm that actual office values are far, far lower (more in the full Goldman note available to professional subscribers).
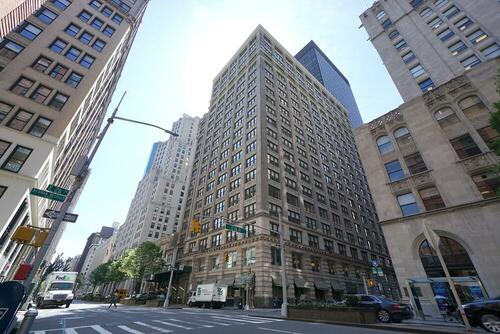
And going back to the historic firesale, at the end of last year the Canadian fund sold its 29% stake in Manhattan’s 360 Park Avenue South for $1 to one of its partners, Boston Properties, which also agreed to assume CPPIB’s share of the project’s debt. The investors, along with Singapore sovereign wealth fund GIC Pte., bought the 20-story building in 2021 with plans to redevelop it into a modern workspace.
360 Park Avenue South
“It’s the opposite of a vote of confidence for office,” said John Kim, an analyst tracking real estate companies for BMO Capital Markets. “My question is, who could be next?”
As office building anxiety has swept the financial world, as the persistence of both remote work and higher borrowing costs undercuts the economic fundamentals that made the properties good investments in the first place, a wave of banks from New York to Tokyo recently conceded that loans they made against offices may never be fully repaid, sending their share prices plunging and prompting fears of a broader credit crunch.
But the real test will be what price office buildings actually trade for – especially once the hundreds of billions of loan backing the properties mature….
…. and until now there have been precious few examples since interest rates started rising. That’s why industry-watchers see such shocking liquidations like CPPIB’s as a very ominous sign for the market.
The Manhattan firesale isn’t the pension fund’s first sale: last month, CPPIB sold its 45% stake in Santa Monica Business Park, which the fund also owned with Boston Properties, for $38 million. That’s a discount of almost 75% to what CPPIB paid for its share of the property in 2018. The deal came just after the landlords signed a lease with social media company Snap that required they spend additional capital to improve the campus, Boston Properties Chief Executive Officer Owen Thomas said on a conference call.
Peter Ballon, CPPIB’s global head of real estate, declined to comment on the recent deals, but said the fund has continued to invest in office buildings, including a recently completed, 37-story tower in Vancouver.
“Selling is an integral part of our investment process,” Ballon said in an emailed statement. “We exit when the asset has maximized its value and we are able to redeploy proceeds into higher and better returns in other assets, sectors and markets, including office buildings.”
As Bloomberg notes, the pension fund isn’t actively backing away from offices, but it’s not looking to increase its office holdings either. And where a property requires additional investment, CPPIB might simply look to sell so it can put that cash somewhere it can get higher returns instead, said the person, who asked not to be identified discussing a private matter.
CPPIB’s C$590.8 billion ($436.9 billion) fund is one of the world’s largest pools of capital, and its C$41.4 billion portfolio of real estate — stretching from Stockholm to Bengaluru — includes almost every property type, from warehouses, to life sciences complexes, to apartment blocks.
While that scale would mitigate any potential losses from individual transactions, it also means even a small shift in CPPIB’s office appetite has the power to cause ripple effects in the market.
While the 360 Park liquidation may be shocking, it’s just the first of many: with hybrid work schedules set to depress demand for office space in the long term, and higher interest rates increasing the cost of the constant upgrades needed to attract and keep tenants, even the best office buildings may not be able to compete with investment opportunities elsewhere.
“To get even better returns in your office investment you’re going to have to modernize, you’re going to have to put a lot more money into that office,” said Matt Hershey, a partner at real estate capital advisory firm Hodes Weill & Associates. “Sometimes it’s better to just take your losses and reinvest in something that’s going to perform much better.”
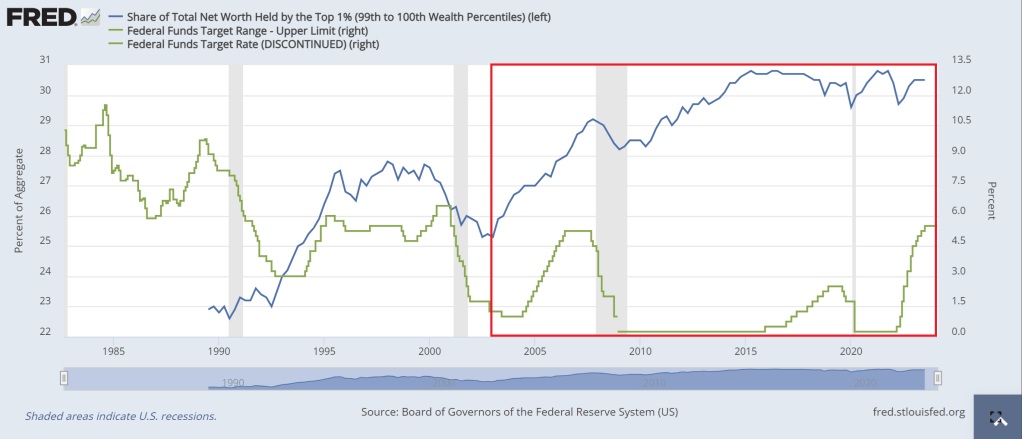
An example of the Sisyphus economy? The top 1% of earners (blue line) have seen an incredible increase in net worth, particularly after Fed Chair Alan Greenspan’s big rate cuts (green line) from 2000 to 2004. Each subsequent rate cuts under Bernanke (2007-2008) and Yellen (who just kept rates too low for too long). The end result? In the red box, the top 1% made out like bandits.
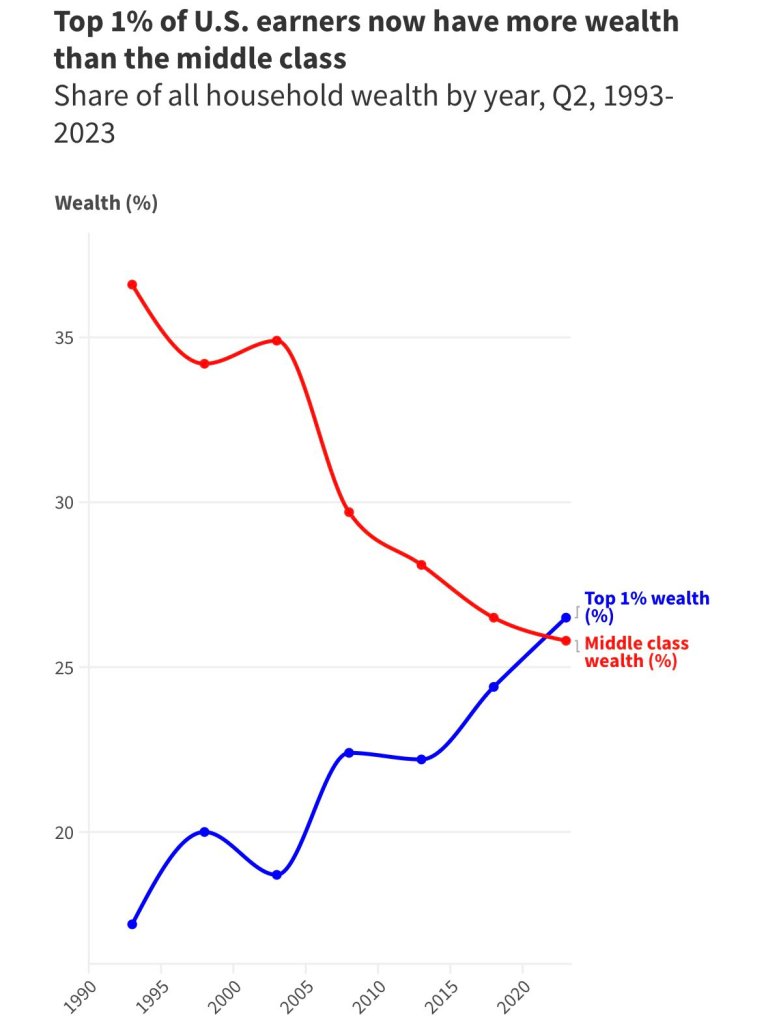
The end result? The top 1% of earners now have more wealth the the middle class.
Of course, asinine Federal government policies (like open borders and making donors wealthy with green energy spending) and the lack of a serious approach to corruption have complicated matters.
So the working class, middle class and low wage workers, are the ones pushing the boulder up a hill while government insiders like Biden make millions through influence peddling. So, unlike the Sisyphus legend, the middle class and low wage workers are being punished by simply existing.
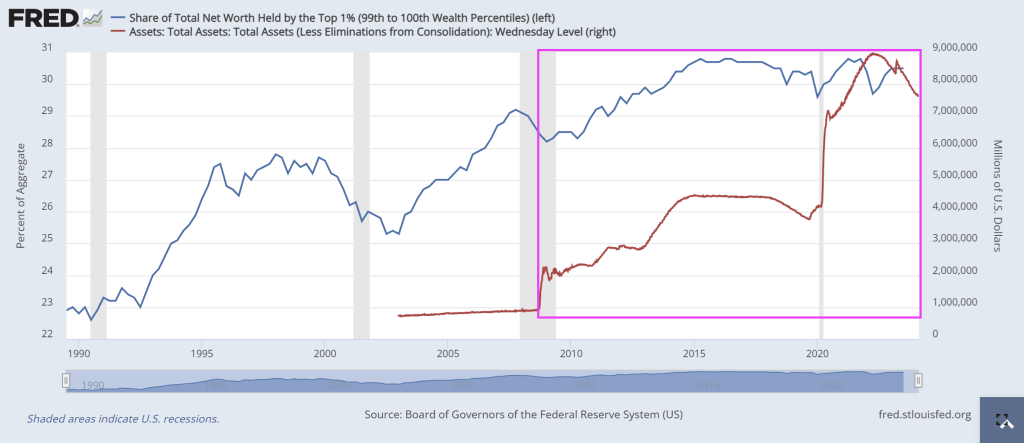
The Fed’s balance sheet has had a similar effect, particularly since the financial crisis of 2007-2008 when The Fed truly became unhinged under Janet Yellen. So of course, Yellen was made Secretary of Treasury, the largest honey pot in the world, so she could continue growing the elites power while minimizing the wealth of all others.
Should we end The Fed? Of course! But we can’t even have a rational discussion on why we are funding a war in Ukraine (to protect their border?) while we leave our borders open to invasion?
Here is one of the 1% who made a fortune by simply having a big mouth and being in politics.
I watched Tucker Carlson’s interview with Russian President Vladimir Putin. Putin is an amazing contrast to our 81-year old President with dementia who can barely speak while Putin was articulate. Not at all what Hillary Clinton was raving about (she is still furious about losing to Trump after losing to Obama). One thing that caught my attention was Putin talking about The Fed’s endless printing of money. Well, THAT is how the US grows GDP these days. Borrow and spend with the private sector as an after thought.
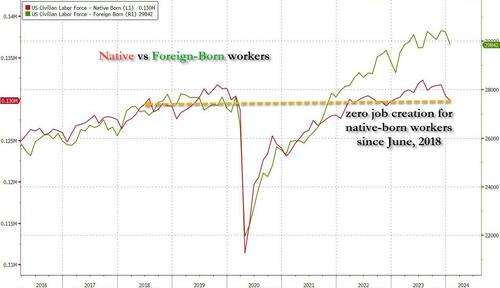
Let’s revisit the HORRIBLE jobs report from December. Not only were all job gains in the past year entirely thanks to part-time workers, but native-born workers plunged by a another whopping 560 thousand, bringing the two-month total drop to just under 2 million.This meant that not only has all job creation in the past 4 years been exclusively for foreign-born workers, but there has been zero job-creation for native-born American workers since July 2018 (don’t believe us? go ahead and check the data directly from the Fed).
So, the Federal government is borrowing trillions of dollars so that 1) part-time jobs are created and 2) foreign born workers have jobs, but not native born Americans?? (Blogger Paul Krugman thinks that immigration will add $7 trillion in real GDP over the next 10 years and this will save Social Security and Medicare. Huh? I admit, millions of immigrants will spend money, but many will be on the Federal and State doles, so its tax dollars going to immigrants to spend.) This seems like Obama/Biden are using Cloward-Piven tactics to overwhelm Social Security, Medicare and other social services, NOT grow the economy as Krugman projects.
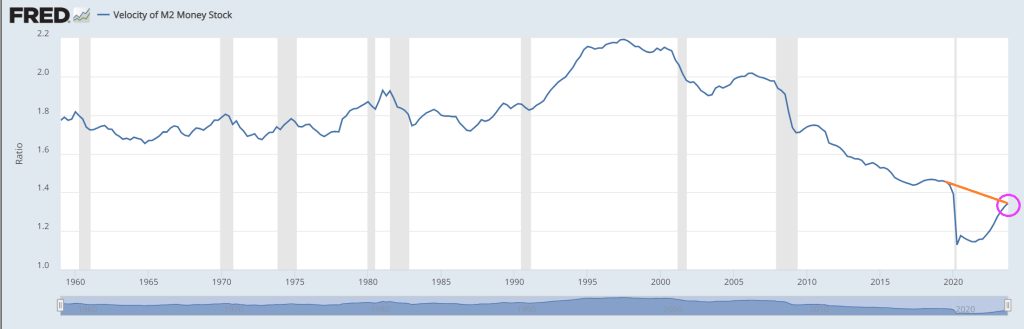
Typically, economists look at measures like M2 Money Velocity (Real GDP/M2). M2 Money Velocity is rising … but still remains below where it was pre-Covid under Donald Trump.
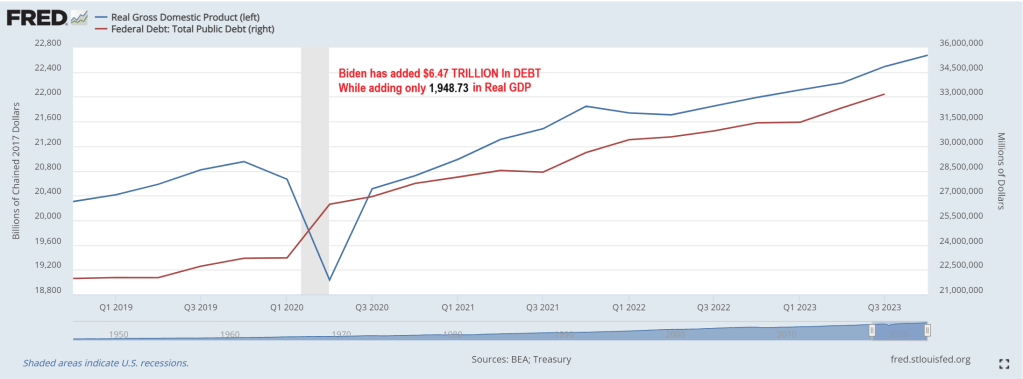
But a more relevant velocity is the velocity of DEBT. As in GDP/Debt. Under Biden, the US has added almost $6.5 TRILLION in debt while real GDP has risen by only $1.949 trillion. That amounts to a DEBT velocity of 0.30. Meaning that the US gets an anemic $30 in real GDP for every $100 in additional Federal debt.
Yes, the US economy is broken and requires endless money printing and debt financing to pay for endless wars and now millions of illegal immigrants getting on “the dole.” Then we have Biden’s forgiving student loan debt (inappropriately) and now Big Tech wants $7 trillion to develop AI (in a normal economy, tech companies would develop AI themselves, but under Obama/Biden, we are not in a normal economy).
Here is Daddy (Ukraine) Warbucks Biden with his biting dog and daughter Ashey.
“Progress on inflation has brightened the economic picture despite a slowdown in hiring and pay. Wages adjusted for inflation have improved over the past six months, and the economy looks like it’s headed toward a soft landing in the U.S. and globally,” says Nela Richardson, Chief Economist, ADP.
ADP National Employment Report
The ADP National Employment Report shows Private Sector Employment Increased by 107,000 Jobs in January; Annual Pay was Up 5.2%
Job Switching Payouts
Year-over-year pay gains for job-stayers reached 5.2 percent in January, down from 5.4 percent in December.
For job-changers, pay was up 7.2 percent, the smallest annual gain since May 2021.
Median Change in Annual Pay (ADP matched person sample) Job-Stayers 5.2%, Job-Changers 7.2%
ADP Notice
January’s report presents the scheduled annual revision of the ADP National Employment Report, which updates the data series to be consistent with the annual Quarterly Census of Employment and Wages (QCEW) benchmark data for March 2023. In addition, this revision introduces technical updates, namely, in re-weighting of ADP data to match QCEW data. The historical file was updated to reflect these revisions.
Notice Translation
ADP revises its data to match annual BLS data from March of 2023. The BLS will do the same in its annual revisions.
The BLS does not even back adjust the numbers so its historical record is bogus. And despite being incredibly lagging, the Fed makes key decisions on the data.
Job Openings Rise in December But Quits Tell the Real Story
There’s lots of meaningless chatter yesterday about job openings. However, actions speak louder than openings.
This report comes after Fed Chair Jerome Powell said “No Sugar Tonight” as in no expected rate cuts. That is, until it becomes obvious that Biden will lose the election, THEN The Fed will start cutting rates like crazy.
An example of the trash that Biden and Democrats are importing from Latin America, Africa and China. Among other sewers. I am sure that employers are lining up to hire this guy. … NOT! Correction: Biden may appoint this creep to his cabinet with the other losers.
Joe, are you kidding about the sizzling economy? Karine Jean Pierre is also guilty of comedy or gross propaganda.
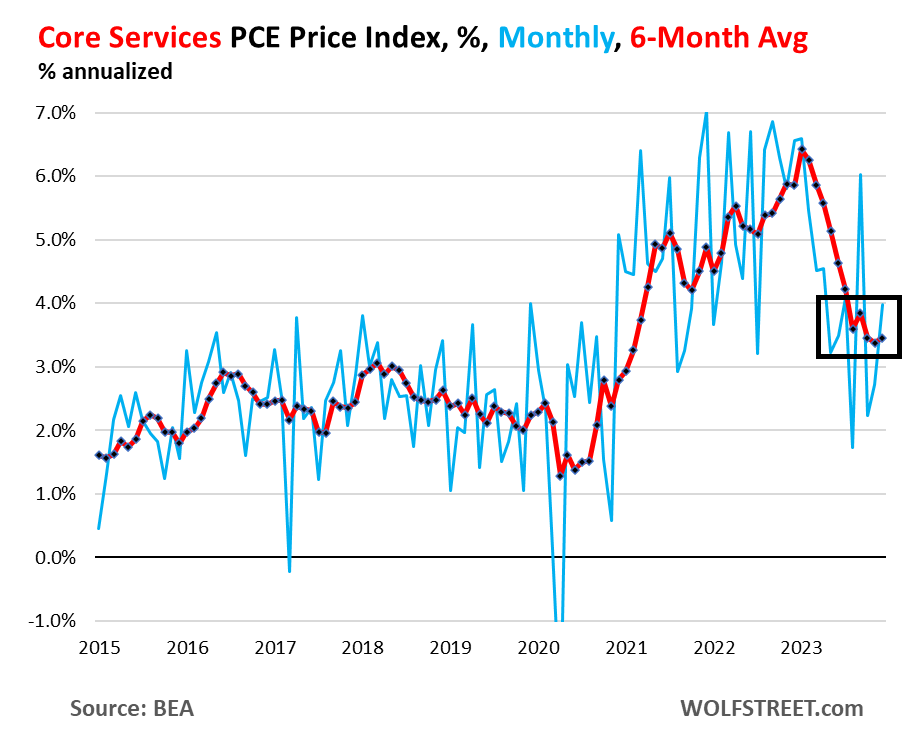
So right up front – and the Fed has been talking about this, though no one listens: The “core services” PCE price index has gotten stuck at 3.5% over the past six months annualized, and accelerated to 4.0% month-to-month annualized in December, with housing inflation stuck at about 6.7% over the past six months annualized, and with other core services components still red-hot.
The core services PCE price index rose by 0.33% in December from November, the second acceleration in a row, according to data from the Bureau of Economic Analysis today. This amounts to an increase of 4.0% annualized (blue).
The six-month moving average, which irons out the huge ups and downs of the month-to-month data, accelerated to 3.5%, and has been in this range since August, after the sharp deceleration in early 2023 (red).
Core services is where consumers spend the majority of their money, and they matter. Which is why Fed governors have said in near unison that they’re in no hurry to cut rates, but have taken a wait-and-see approach, with an eye on core services. And if it goes away, fine.
But on the surface, the PCE price index looks encouraging, and this has been the trend for months, with the overall PCE price index at +2.6% year-over-year in December, the lowest since March 2021; and with the core PCE price index at +2.9% year-over-year, also the lowest since March 2021, and aiming for the Fed’s 2% target.
The factors for the year-over-year cooling in these inflation measures have been the same for months: plunging energy prices, sharply dropping prices of durable goods after the huge spike in 2020 and 2021, cooling food inflation (with prices still rising from very high levels, but slowly), and favorable “base effects” when compared to a year ago.
But energy prices don’t plunge forever, so that will go away; durable goods prices don’t drop sharply forever either, though they can drop for a while longer to unwind some more of the price spike they’d been through in 2020 and 2021; and the base effects are going to get timed out this year, when the base of the year-over-year comparisons become the lower inflation figures of 2023.
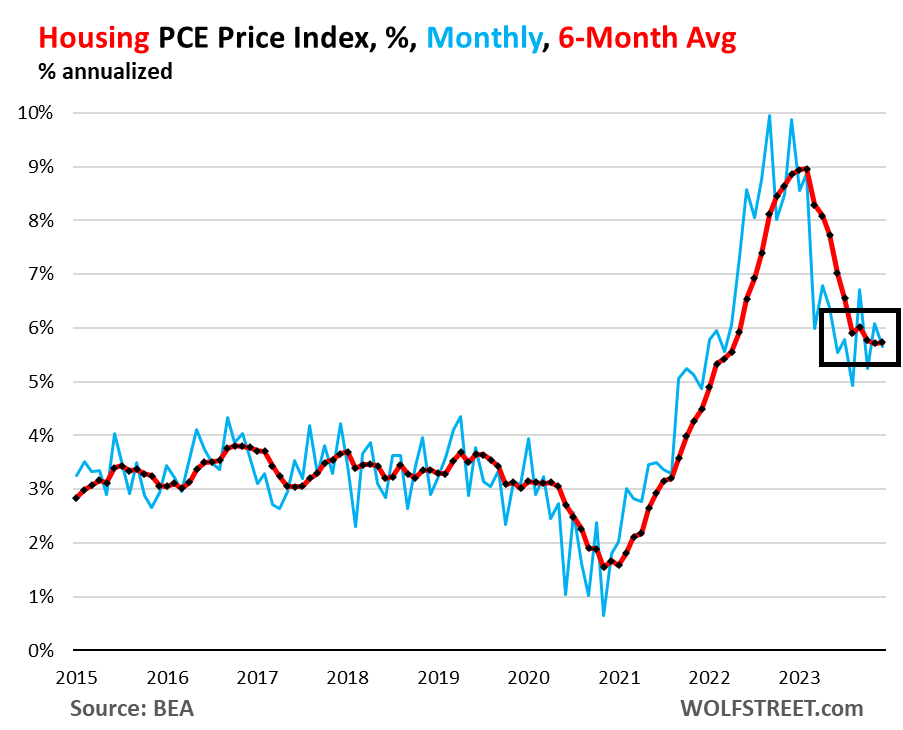
Housing inflation, still red hot and not cooling anymore. The PCE price index for housing rose by 0.46% in December from November and has been in this range since March, after the sharp slowdown early in 2023. This amounts to 5.7% annualized (blue in the chart below).
The housing index is broad-based and includes factors for rent in tenant-occupied dwellings; imputed rent for owner-occupied housing, group housing, and rental value of farm dwellings. It’s the largest component of core services.
The six-month moving average annualized, which shows the more recent trends, also rose by 5.7% in December, and has been in the same range since August (red).
So it looks like the PCE price index for housing has gotten stuck at 5.7%. This stubborn inflation in housing is a blow to theories trotted out for 18 months that housing was lagging, and that we know it will go away as an issue, etc., etc. The increases are less hot than they had been, but remain hot and have become persistent.
The major categories of core services in the PCE price index, as a six-month average of month-to-month changes, annualized:
Core services, major categories, 6-month average, annualized
Housing
5.7%
Description and chart above
Non-energy utilities
2.5%
Water, sewer, trash
Health care
2.5%
Physicians, outpatient, hospital, nursing care, dental, etc.
Transportation services
6.1%
Auto repair & maintenance, auto leasing & rentals, public transportation, airfares, etc.
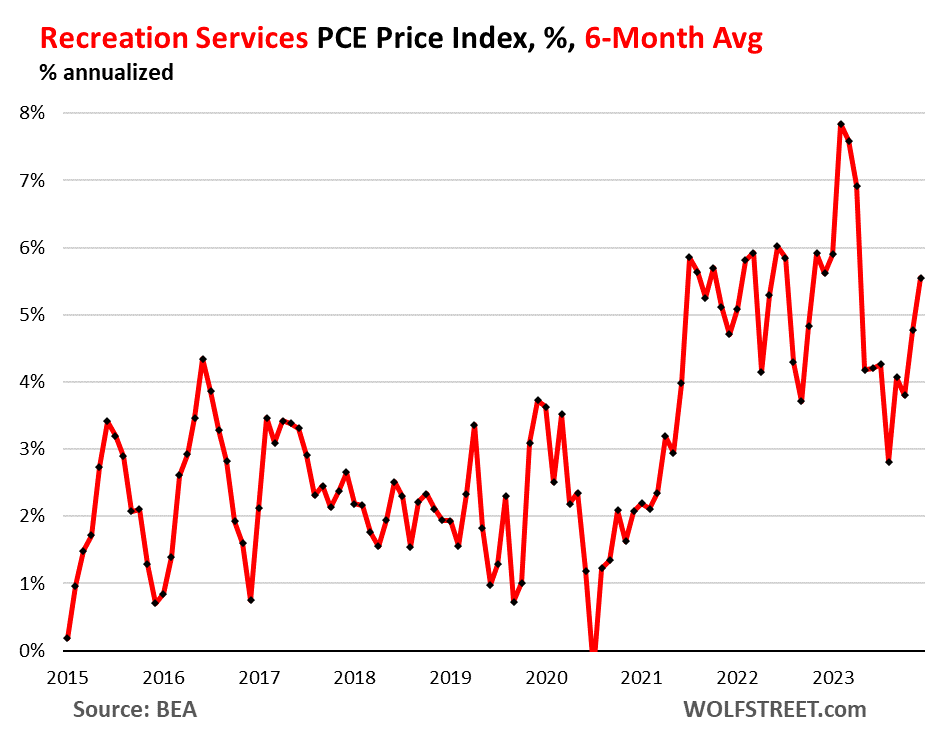
Recreation services
5.6%
Concerts, sports, movies, gambling, streaming, vet services, package tours, etc.
Food services, accommodation
2.8%
Meals & drinks at restaurants, bars, schools, cafeterias, etc.; accommodation at hotels, motels, schools, etc.
Financial services
3.5%
Fees & commissions at banks, brokers, funds, portfolio management, etc.
Insurance
2.8%
Insurance of all kinds, including health insurance
Other services
0.1%
Collection of other services
Inflation in Transportation services and Recreation services is accelerating on the basis of the 6-month moving average, with the PCE price index for Transportation services rising by 6.1%, and the index for Recreation services rising by 5.6%:
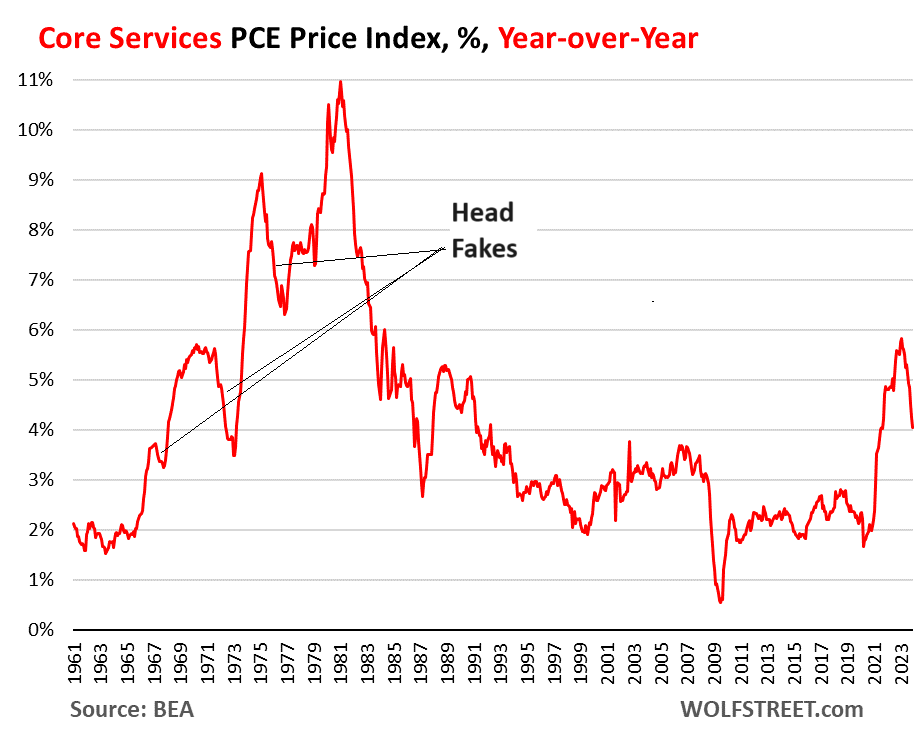
The head-fakes last time.
Inflation in services turns out to be tough to beat, and it can dish up big head-fakes. Last time we had this type of surge of inflation, so that was in the 1970s and 1980s, we thought repeatedly that we had inflation licked, only to find out that we’d fallen for an inflation head-fake. There were three head-fakes in core services on the way to the peak of 11% in 1981:
But Democrats are desperate to stay in power and rake in billons of dollars. Their strategy? Nobody But Joe. Well, except maybe Mike Obama.


You must be logged in to post a comment.