I was expecting MORE housing construction given the 10+ million illegal immigrants that Biden/Mayorkas have waived across the border.
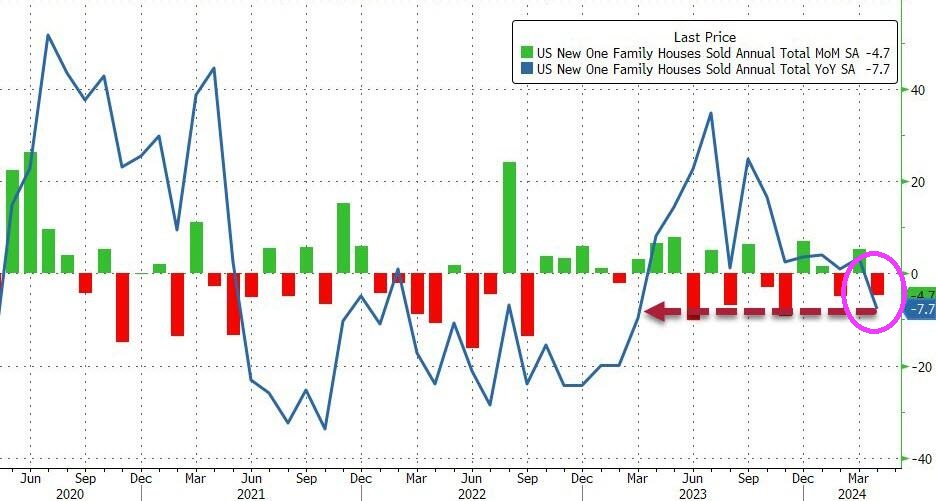
Sales of new single‐family houses in April 2024 were at a seasonally adjusted annual rate of 634,000, according to estimates released jointly today by the U.S. Census Bureau and the Department of Housing and Urban Development. This is 4.7 percent below the revised March rate of 665,000 and is 7.7 percent below the April 2023 estimate of 687,000.
The previous three months were revised down.
The second graph shows New Home Months of Supply.
The months of supply increased in April to 9.1 months from 8.5 months in March.
The all-time record high was 12.2 months of supply in January 2009. The all-time record low was 3.3 months in August 2020.
This is well above the top of the normal range (about 4 to 6 months of supply is normal).
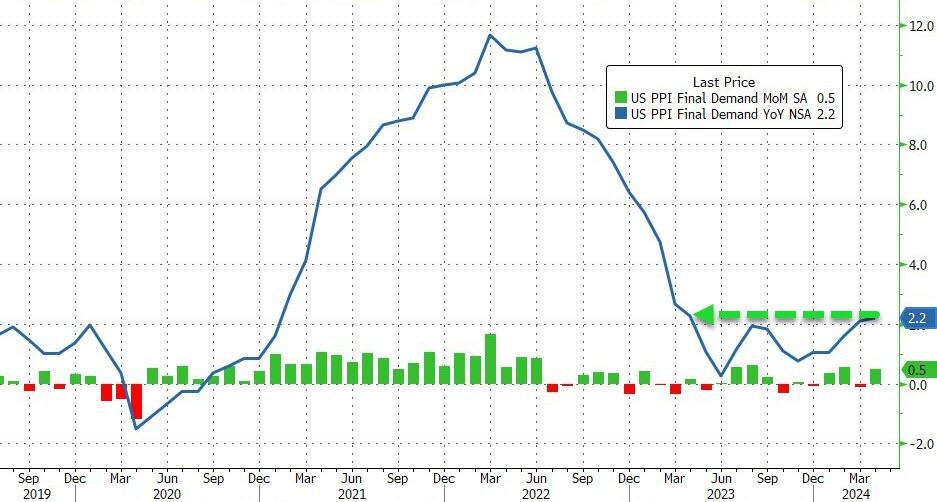
April Producer Prices rose 0.5% MoM (vs +0.3% exp), with March’s +0.2% MoM revised down to -0.1% MoM. The downward revision did not stop the YoY read rising to 2.2% (from +2.1% in March)…
Source: Bloomberg
This is the highest YoY read since April 2023 and is the fourth hotter than expected headline PPI print…
Source: Bloomberg
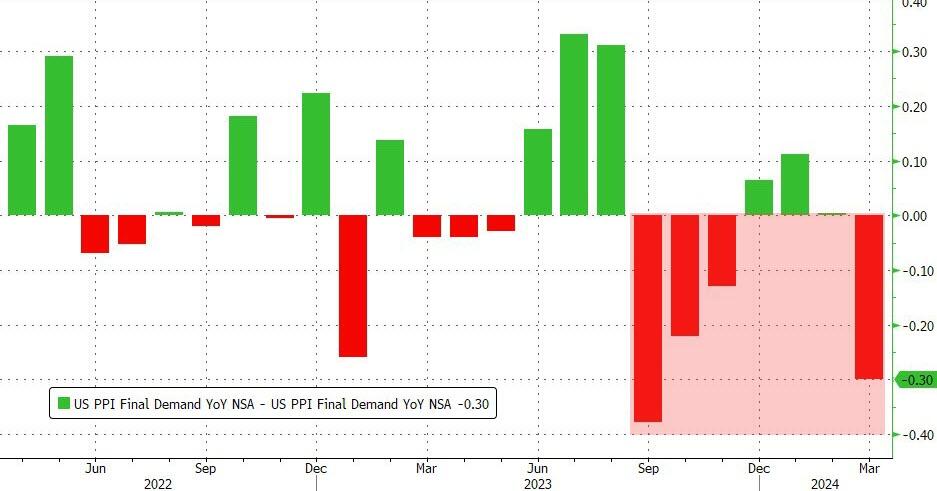
Producer Prices have been aggressively downwardly revised for 4 of the last 7 months…
Source: Bloomberg
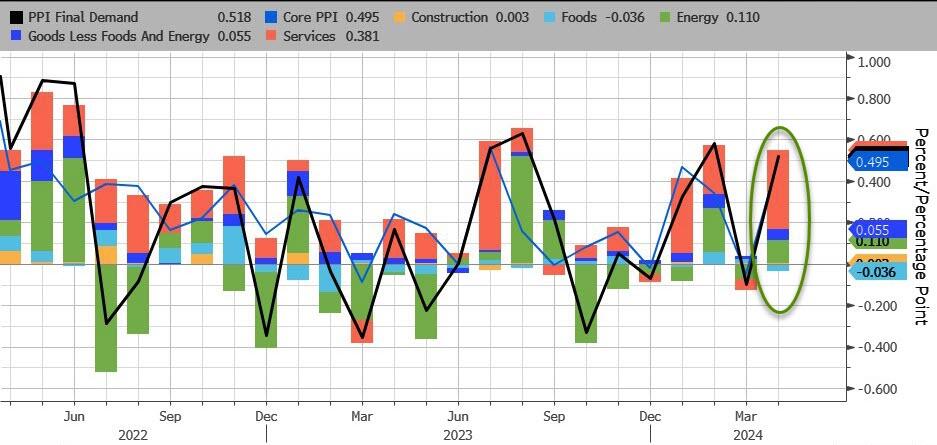
Services costs soared, dominating April’s PPI gains with Energy the second most important factor. Food prices actually declined on a MoM basis.
Source: Bloomberg
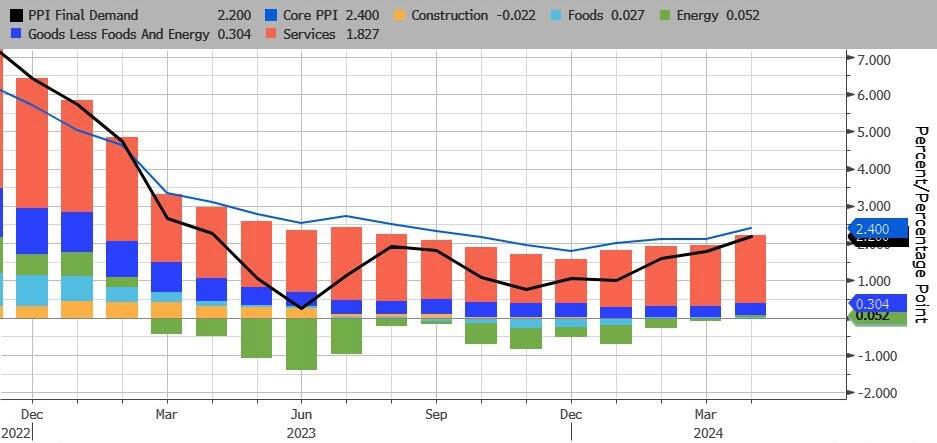
On a YoY basis, headline PPI’s rise was dominated by Services (rising at their hottest since July 2023). For the first time since Feb 2023, none of the underlying factors were negative on a YoY basis…
Source: Bloomberg
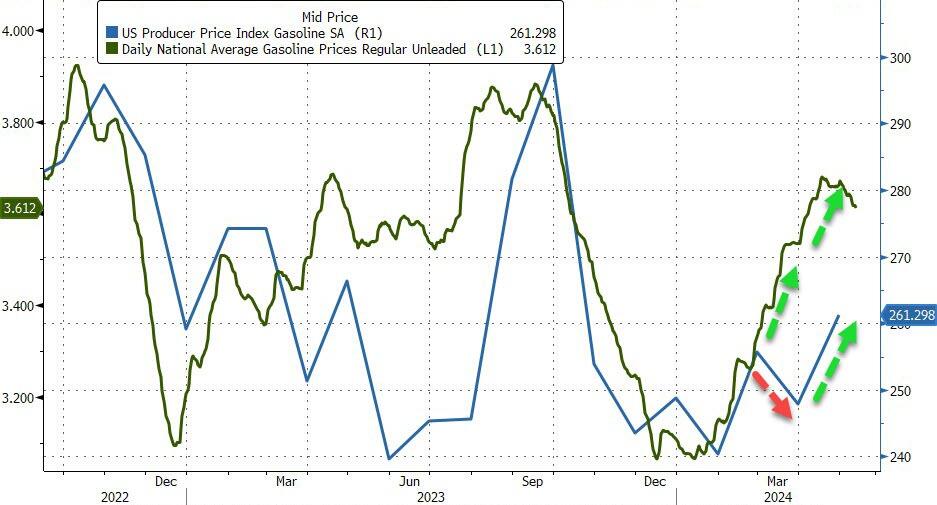
After last month’s farcical ‘seasonally adjusted’ gasoline price, April saw the PPI Gasoline index rise (with actual prices at the pump) but still has a long way to go…
Source: Bloomberg
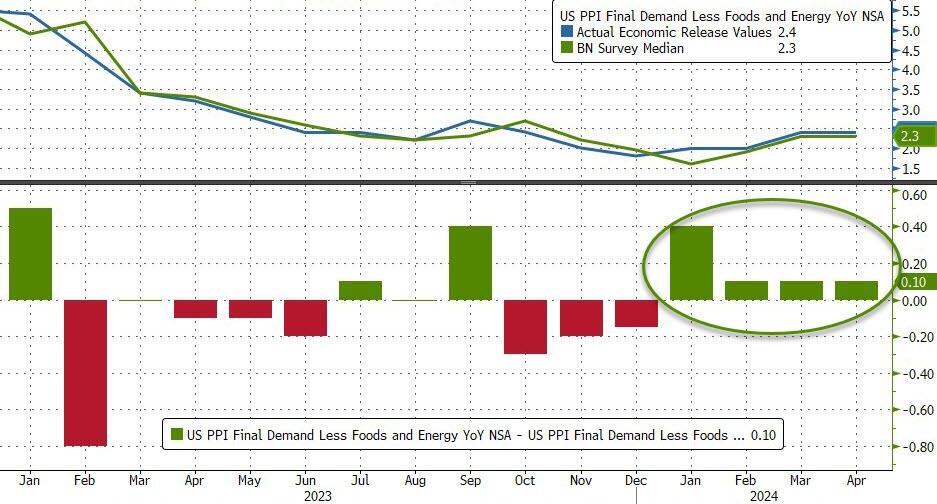
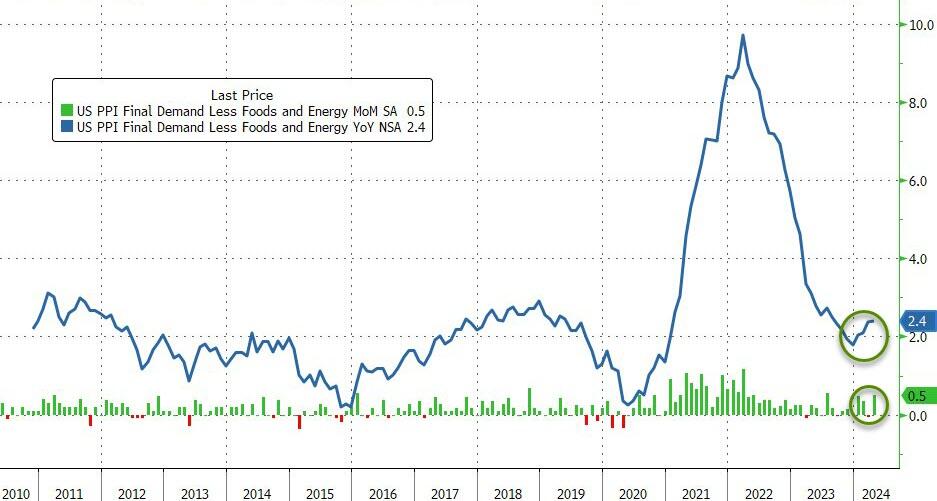
Core PPI was worse – rising 0.5% MoM (more than double the +0.2% MoM expected) – which pushed the Core PPI YoY up to +2.4%…
Source: Bloomberg
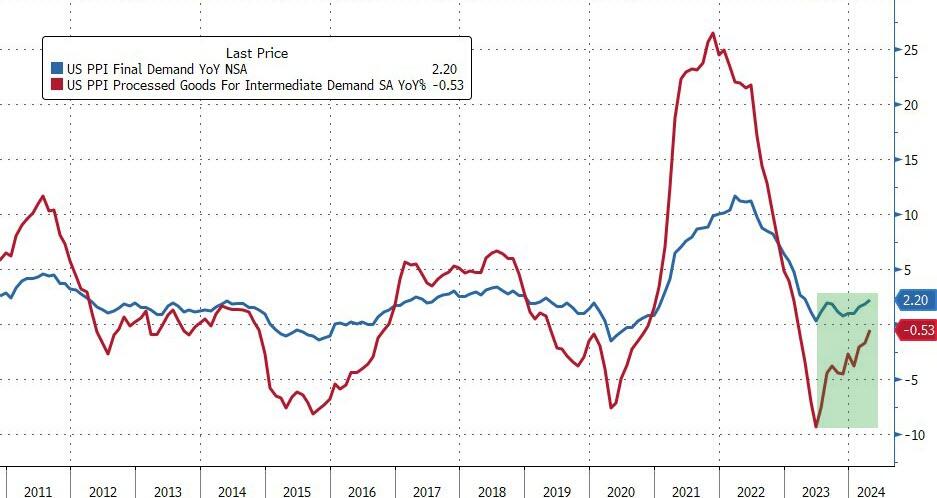
And finally US PPI Final Demand Less Foods Energy and Trade Services rose by 0.4% MoM and 3.1% YoY (the highest in 12 months).
Worse still the pipeline for primary PPI is not good as intermediate demand is starting to accelerate…
Source: Bloomberg
Over the past month, ‘higher prices’ have dominated ‘lower prices’ in recent survey data…
Higher producer prices:
New York Empire manufacturing price paid advanced to 33.7 from 28.7.
Philadelphia Fed manufacturing reported prices paid gained to 23.0 from 3.7 in March.
Philadelphia Fed non-manufacturing prices paid rose to 31.0 from 26.6 in the prior month.
Richmond Fed services prices paid rose to 6.11 from 5.43 in March.
Kansas City Fed manufacturing prices paid advanced to 18 from 17.
Kansas City Fed services input price growth continued to outpace selling prices.
S&P Global manufacturing input cost inflation quickened to hint at sustained near-term upward pressure on selling prices.
ISM Manufacturing prices paid gained to 60.9, the highest since June 2022, from 55.8 in March.
ISM Services prices paid notched up to 59.2, the highest since January, from 53.4 in March.
Lower producer prices:
New York Fed Services prices paid fell to 53.4 from 55.1 in March.
Richmond Fed manufacturing growth rates of prices paid dipped to 2.79 from 3.22 in March
Dallas Fed Manufacturing outlook reported prices paid for raw materials dropped to 11.2 from 21.1 in the prior month.
Dallas service sector input prices index nudged down to 28.8 from 30.4 in the prior month.
S&P Global Service saw input costs slowed from six-month highs in March.
Do you see the ‘flation’ now, Jay?
So, no, The Fed does not have inflation under control.
One year after regional banks crashed and burned due to the combination of tumbling debt/treasury prices coupled with cratering commercial real estate loans, fears about the current state of Commercial Real Estate – where most offices still see tenants at best 3 to 4 days a week and are literally burning through rents – appear long forgotten. Is that sensible?
For one answer, we turned to the latest report from Goldman’s REIT/CRE expert Chandhi Luthra who has published a visual assessment of the state of CRE in 2024 in terms of loan maturities, 2023 extensions, and property and lender groups. She also looks at the latest transaction and leasing volumes, and shares several key takeaways.
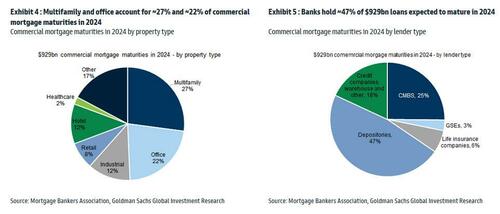
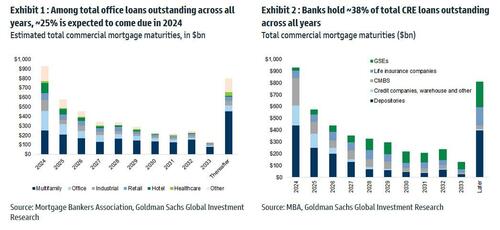
There are ~$4.7tn of outstanding commercial/multifamily mortgages outstanding, according to the Mortgage Bankers Association’s 2023 Commercial Real Estate Survey of Loan Maturity Volumes.
More specifically in 2024, $929bn of CRE mortgages are expected to mature, ~20% of ~$4.7tn total commercial mortgages outstanding. In terms of property type, multifamily and office account for ~27% and ~22% of commercial mortgage maturities in 2024 respectively. In terms of lender type, banks hold ~47% of debt maturing in 2024, followed by CMBS at ~25%.
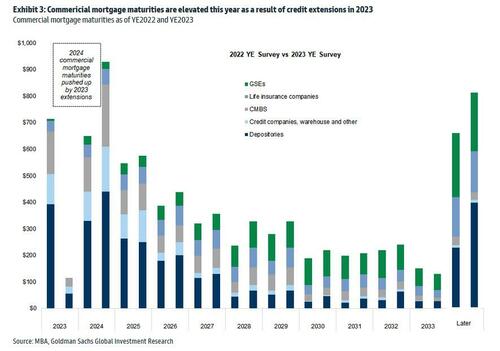
It is worth noting that 2024 commercial mortgage maturities are pushed up by 2023 extensions. As shown in Exhibit 3, among the CRE loans scheduled to mature in 2023, ~$610bn were refinanced, with ~$300bn pushed into 2024 and the remainder into future years. As a result, the total CRE refinancing volume is expected to be ~$929bn in 2024.
Of course, it does not end there, and since there has been no fundamental improvement, it is certain that extension volumes in 2024 will be high as well. However, as interest rates are expected to come down, demand for refinancing in 2024 may outpace that in 2023 according to the Goldman analyst (rates are still far, far higher than where they were when most of the loans were originated several years ago). At the same time, for loans that have already been extended in the past, it is also likely that future extensions could be harder.
Among the loans backed by office properties overall, ~25% is expected to come due in 2024. In terms of lender type, banks (primarily small, regional banks) hold ~38% of total CRE loan outstanding across all years, followed by the GSEs at 20%.
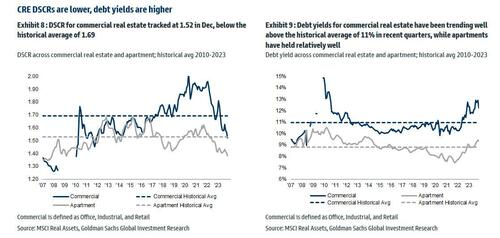
Looking at different debt metrics, DSCR for commercial real estate (office, industrial and retail combined) tracked at 1.52 in Dec, below the historical average of 1.69; debt yields for commercial real estate have been trending well above the historical average of ~11% in recent quarters, while apartments have held relatively well.
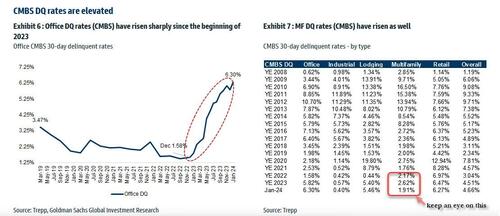
Office CMBS DQs have risen significantly, with Jan tracking at 6.3%, up significantly from 1.58% in Dec 2022. And while everyone knows the Office canary in the coalmine is dead and buried, keep an eye on Multifamily CMBS DQs which tracked at 1.91% vs 2.62% in December, with the sequential decline associated with a large San Francisco apartment loan that was recently disposed. The overall DQ rate tracked at 4.66% in January.
The Goldman strategist concludes with a word about CRE transaction and leasing: U.S. CRE transaction market continues to be muted, primarily driven by elevated interest rates, limited sources of capital, and the pricing gap between buyers and sellers. January volume was down -11% yoy, driven by easier compares in Jan 2023 (down -55%). In terms of leasing, Jan preliminary trends indicate weakness in activities, with office down -25% yoy and industrial down -28% yoy.
Here, Goldman trader Sara Cha chimes in (her report is also available to pro subs) and notes that we can see from the transaction data “why sentiment in CRE brokers is a bit more mixed of late – thought yesterday’s JLL print had mixed reception – while you’ve seen some signs of life in capital markets space broadly to start the year, not seeing that as much on the CRE front (remember those 3Q-4Q greenshoots?).“
Multifamily CRE
The commercial real estate sector continues to experience elevated stress . The latest crack to emerge is the increasing number of delinquencies on multifamily mortgages.
In April, about 8.6% of commercial real estate loans bundled into collateralized loan obligations were distressed, reaching the record high set in January, according to Bloomberg, citing new data from analytics firm CRED iQ.
The loans bundled into CRE CLOs were merged with funds from individual investors to acquire multifamily housing during the Covid era. After that, borrowing rates surged, catching many off guard. A significant portion of the deteriorating loans had floating-rate interest rates, putting massive pressure on landlords’ cash flows, diminishing the market worth of the properties, and obliterating equity in a large number of investments.
According to data provider Trepp, $78.5 billion of CRE CLO loans are outstanding. This means many CRE CLO issuers are racing to find ways to prevent a tsunami of bad loans from defaulting or risk losing the fees they collect on the securities.
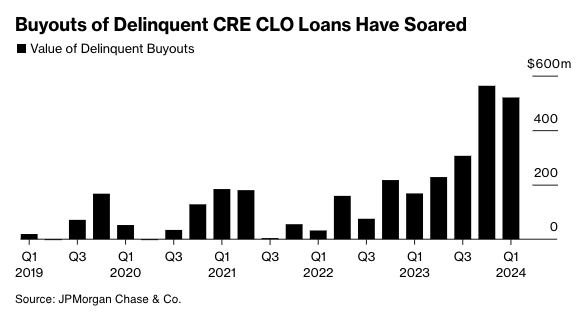
Recent estimates from JPMorgan show lenders purchased $520 million of delinquent loans in the first quarter of this year. Lenders have been ramping up the number of buyouts over the last four quarters because of mounting bad loans in a period of elevated rates.
Source: Bloomberg
JPMorgan strategist Chong Sin said he’s surprised by lenders’ ability to obtain warehouse lines to purchase bad debt, given tightening credit conditions.
“The reason these managers are engaged in buyouts is to limit delinquencies,” Sin said, adding, “The wild card here is, how long will financing costs remain low enough for them to do that?”
Anuj Jain, an analyst at Barclays Plc, expects buyouts to continue as distress increases across the CRE CLO space.
“If the outlook for the Fed shifts materially to hikes or no rate cuts for a while, that might lead to a sharp increase in delinquencies, which can stifle issuers’ ability to buy out loans,” Jain said.
Bloomberg explains much of the CLO space derives from multifamily bridge loans originated around 2021-2022:
CRE CLO issuance surged to $45 billion in 2021, a 137% increase from two years earlier, when buyers of apartment blocks sought to profit from the wave of workers moving to the Sun Belt from big cities. Three-year loans would give them time to complete upgrades and refinance, the thinking went.
Fast forward to today and the debt underpinning many of the bonds is coming due for repayment at a time when there’s less appetite for real estate lending, insurance costs have skyrocketed and monetary policy remains tight. Hedges against borrowing cost increases are also expiring and cost significantly more to purchase now.
Those blows helped increase multifamily assets classed as distressed to almost $10 billion at the end of March, a 33% rise since the end of September, according to data compiled by MSCI Real Assets.
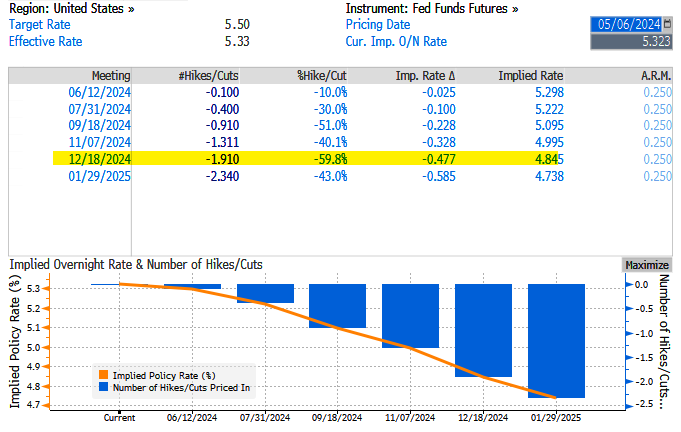
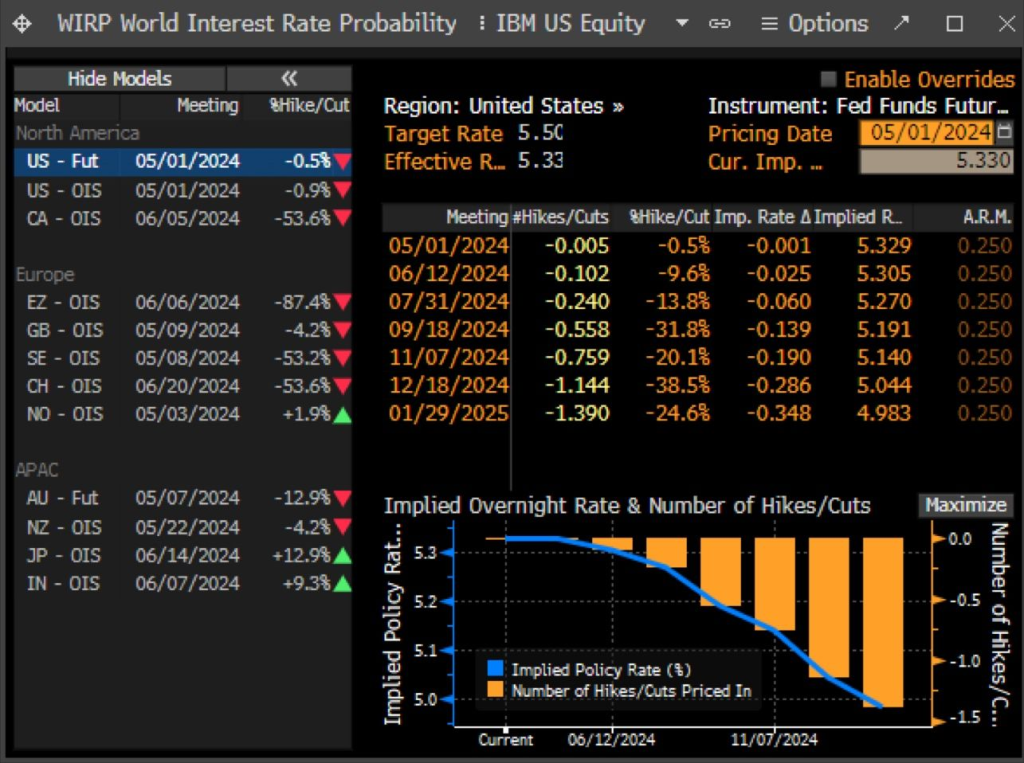
Last Wednesday, the Fed left interest rates unchanged at around 550bps as inflation data reaccelerates and economic growth tilts to the downside, stoking stagflation fears.
Fed swaps are pricing in just under two cuts – this is down from nearly seven earlier this year and about 1.14 before last week’s FOMC.
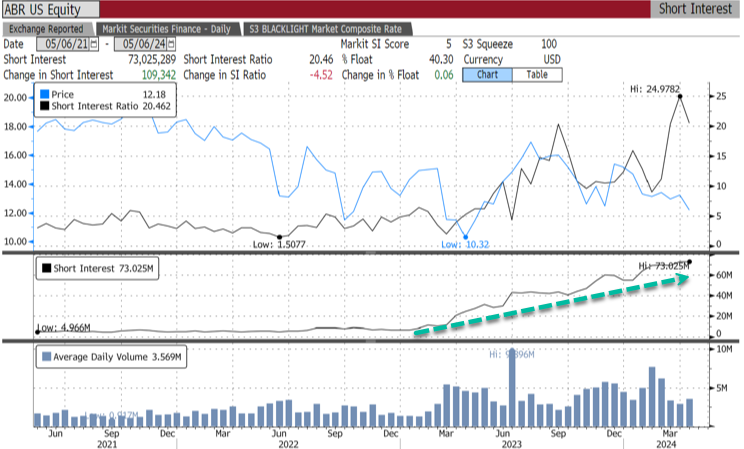
Meanwhile, bears are piling in on CRE CLO issuer Arbor Realty Trust Inc., with 40.3% of the float short, equivalent to 73 million shares short.
“The multifamily CRE CLO market was not prepared for rate volatility,” said Fraser Perring, the founder of Viceroy Research, which has placed bear bets against Arbor, adding, “The result is significant distress.”
The longer the Fed delays rate cuts, the worse the CRE mess will get.
Housing in the US is simply unaffordable, particularly after HUD levied new regulation rising the cost of new housing up to $31,000. Wait for this to kick into the data for mortgage demand!
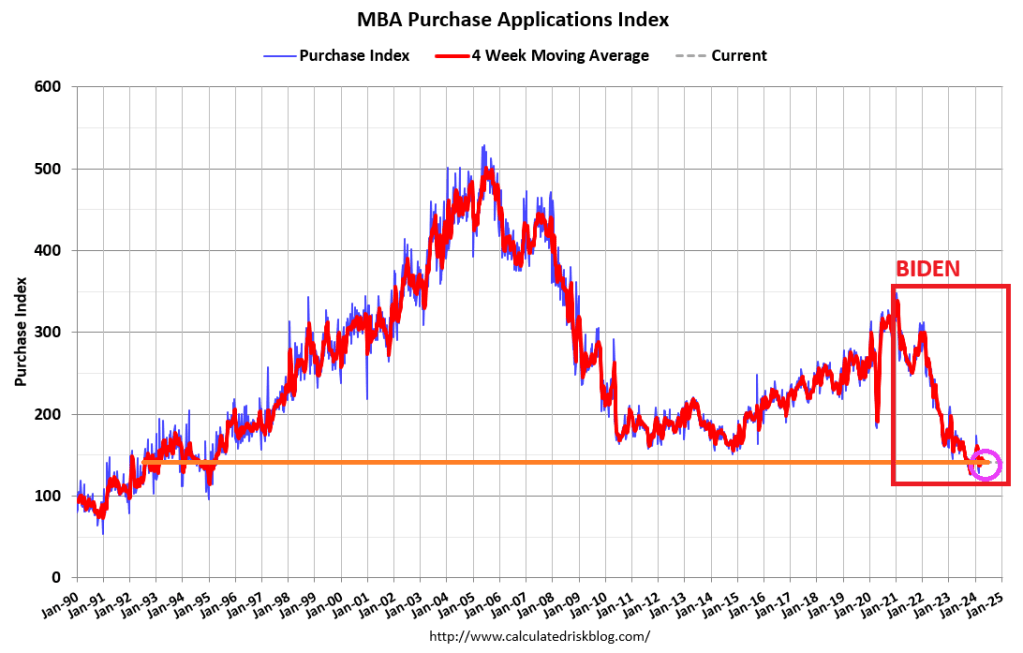
Mortgage applications decreased 2.3 percent from one week earlier, according to data from the Mortgage Bankers Association’s (MBA) Weekly Mortgage Applications Survey for the week ending April 26, 2024.
The Market Composite Index, a measure of mortgage loan application volume, decreased 2.3 percent on a seasonally adjusted basis from one week earlier. On an unadjusted basis, the Index decreased 1.4 percent compared with the previous week. The seasonally adjusted Purchase Index decreased 2 percent from one week earlier. The unadjusted Purchase Index decreased 1 percent compared with the previous week and was14 percent lower than the same week one year ago.
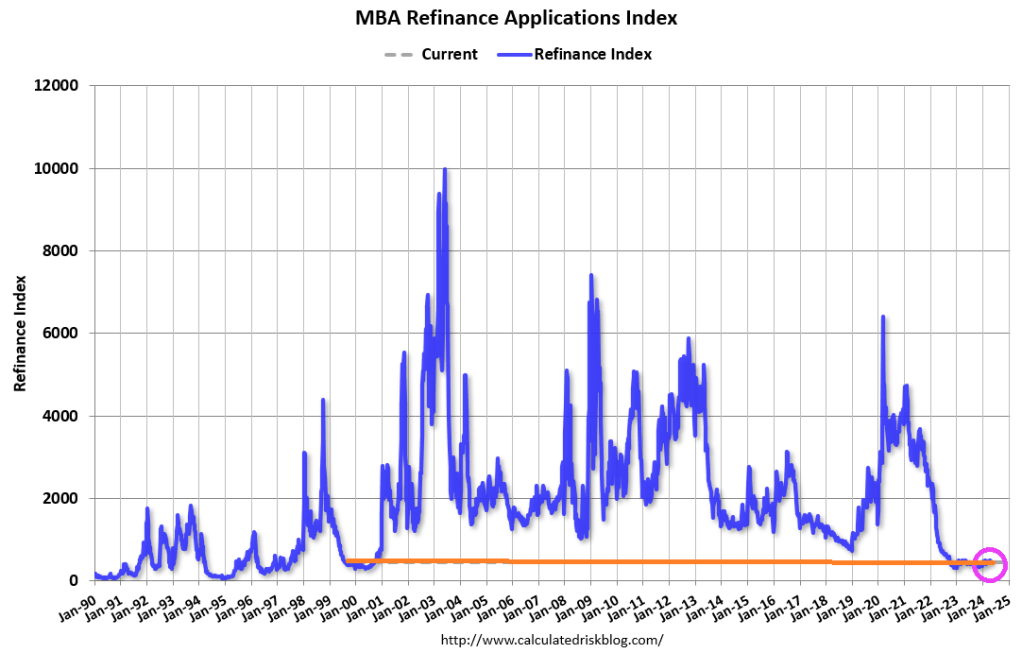
The Refinance Index decreased 3 percent from the previous week and was 1 percent lower than the same week one year ago.
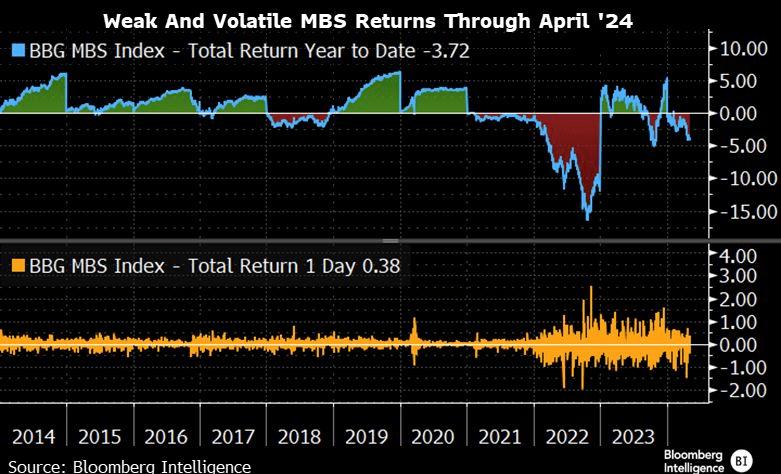
MBS returns are weak and volatile.
How is the Biden Regime making homeownership more affordable? They aren’t. The are using regulations, to drive the cost of new housing way up. New HUD energy rules will raise the cost of home construction by imposing stricter building codes. The National Association of Home Builders says the energy rules can add as much as $31,000 to the price of a new home. Payback time is 90 years (how long it will take the recoup the initial investment).
Under Biden’s “leadership” we are all addicted to gov. But at least Ukraine and Zelenskyy will be getting a guaranteed 10 years of financial support from the US … while E Palestine Ohio and Maui remain destroyed.
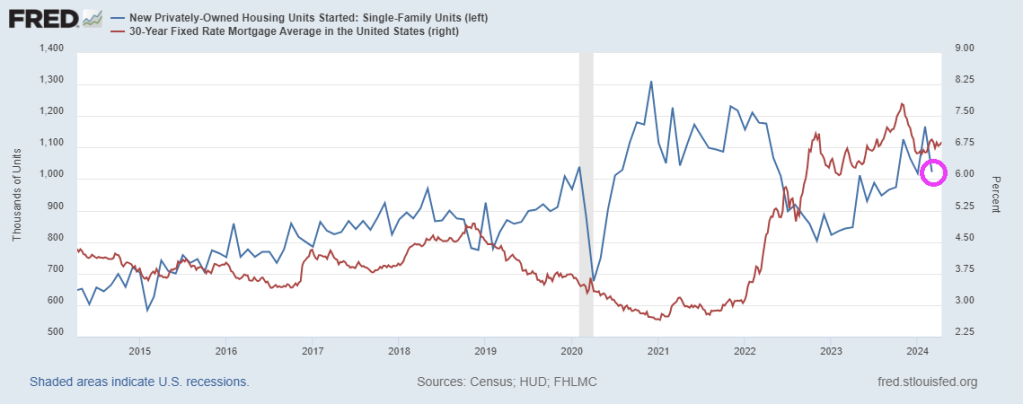
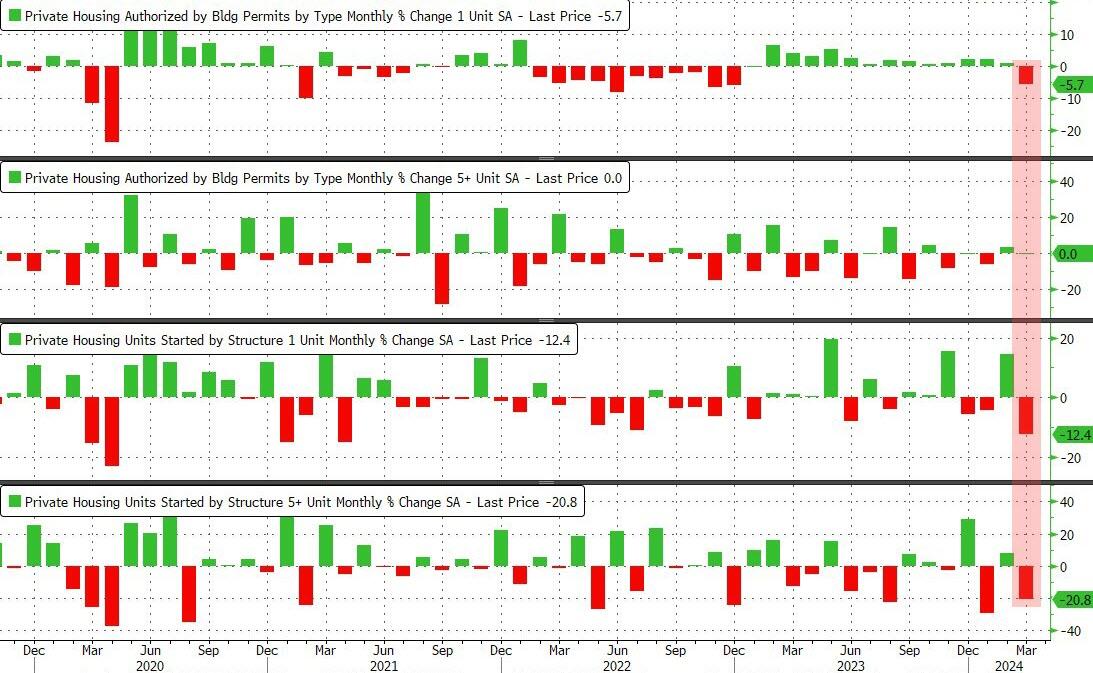
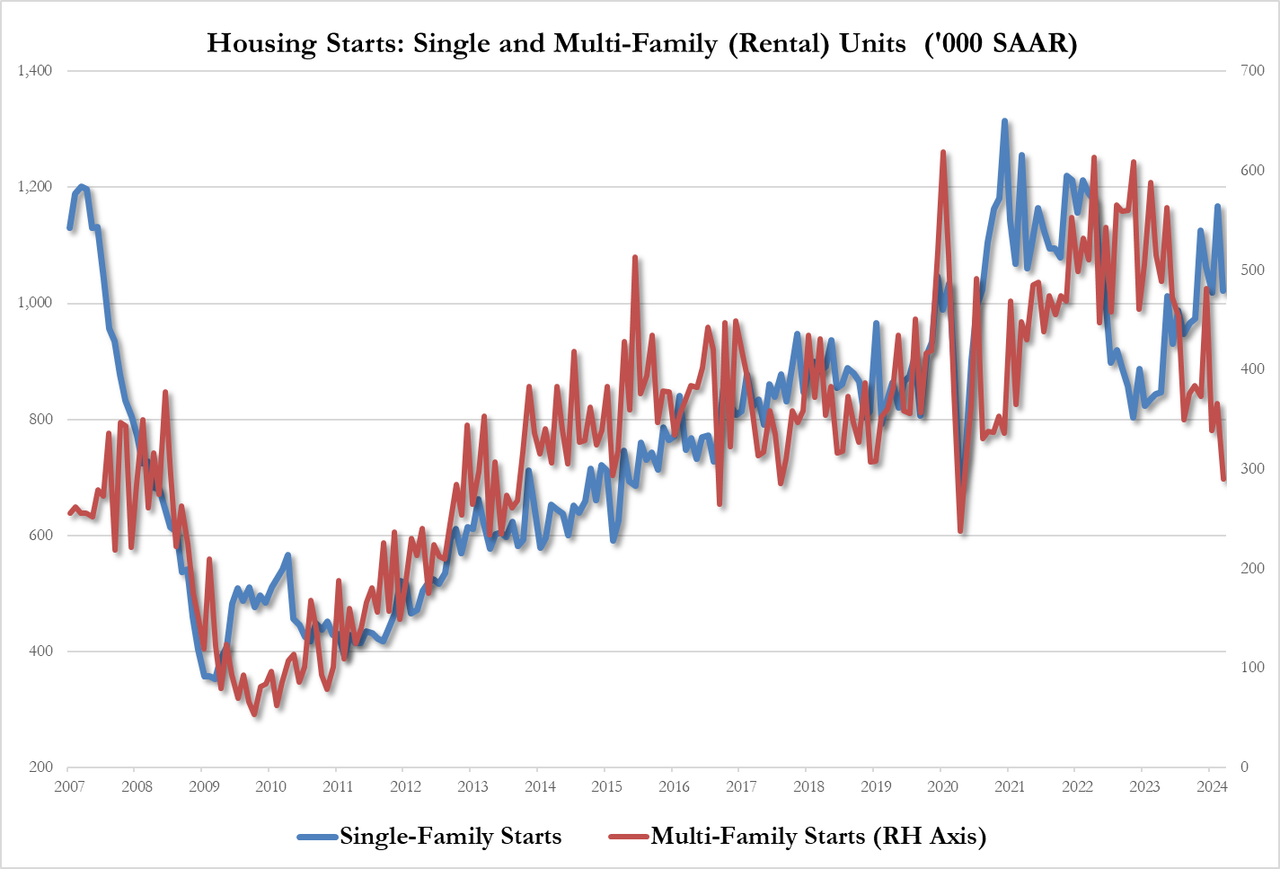
Come feel the noise! After steady growth in 1-unit housing starts under Trump, housing starts have been eratic under Biden despite the foreign invasion force of millions … of low wage workers.
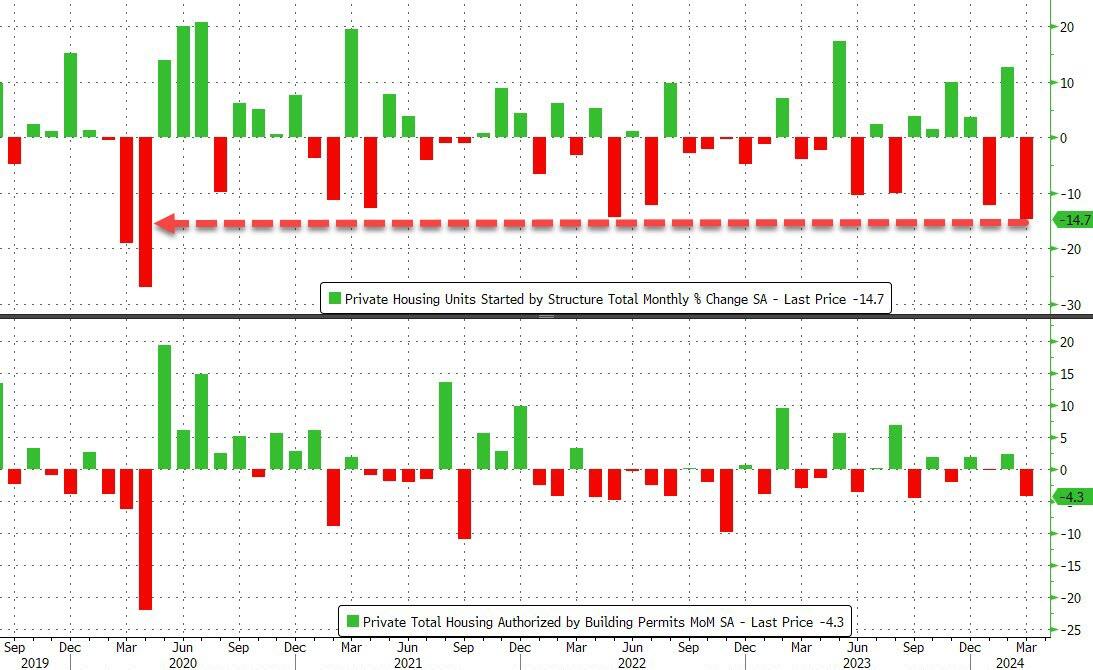
For context, this is the largest MoM drop in housing starts since the COVID lockdowns…
Source: Bloomberg
It was a bloodbath across the board with Rental Unit Starts plummeting 20.8% MoM…
Source: Bloomberg
That pushed total multi-family starts SAAR down to its lowest since COVID lockdowns…
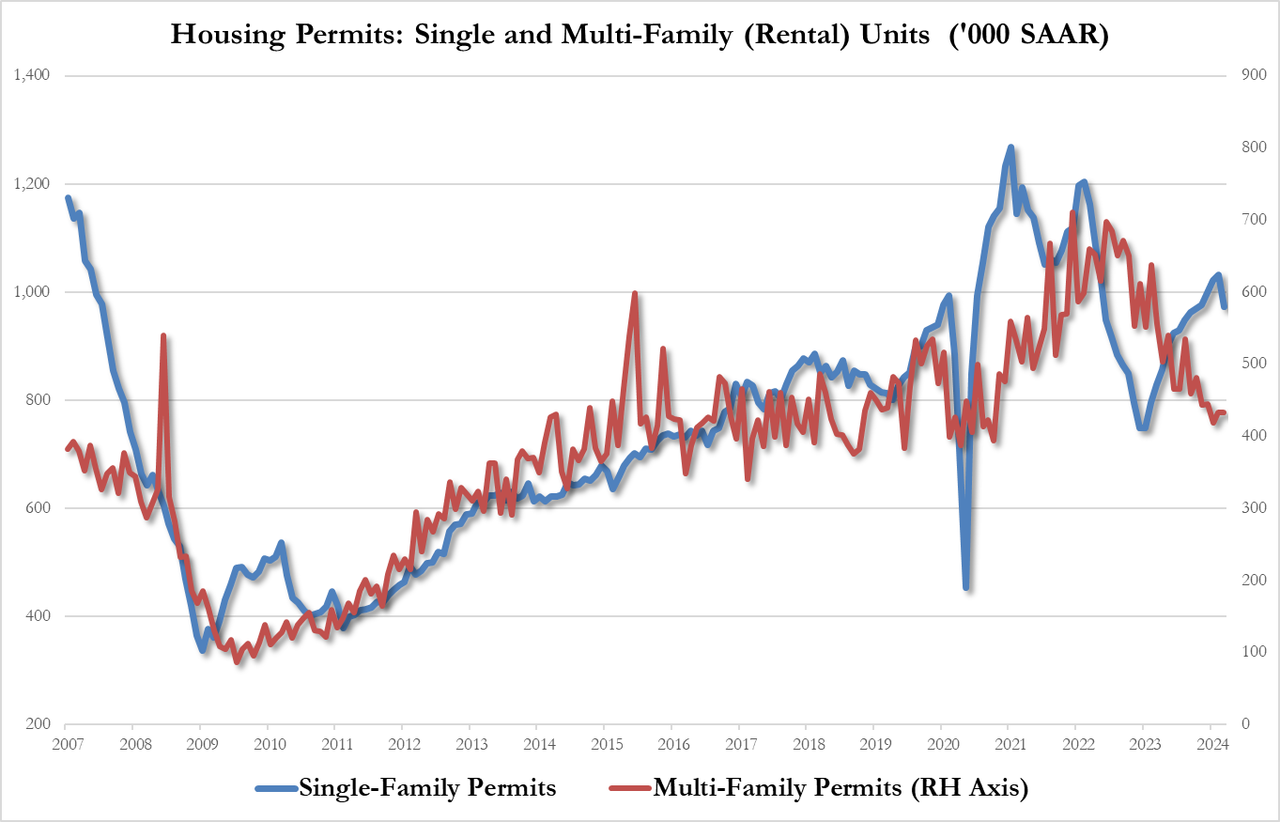
The plunge in permits was less dramatic and driven completely by single-family permits down 5.7% to 973K SAAR, from 1.032MM, this is the lowest since October. Multi-family permits flat at 433K
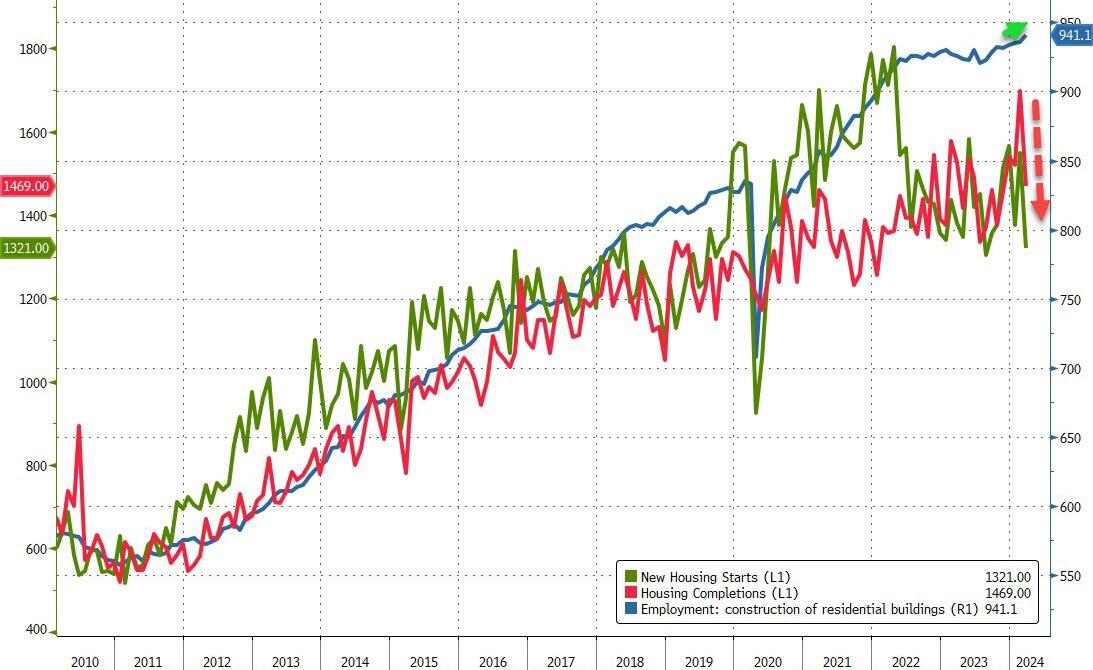
Intriguingly, while starts and completions plunged in March, the BLS believes that construction jobs surged to a new record high…
Source: Bloomberg
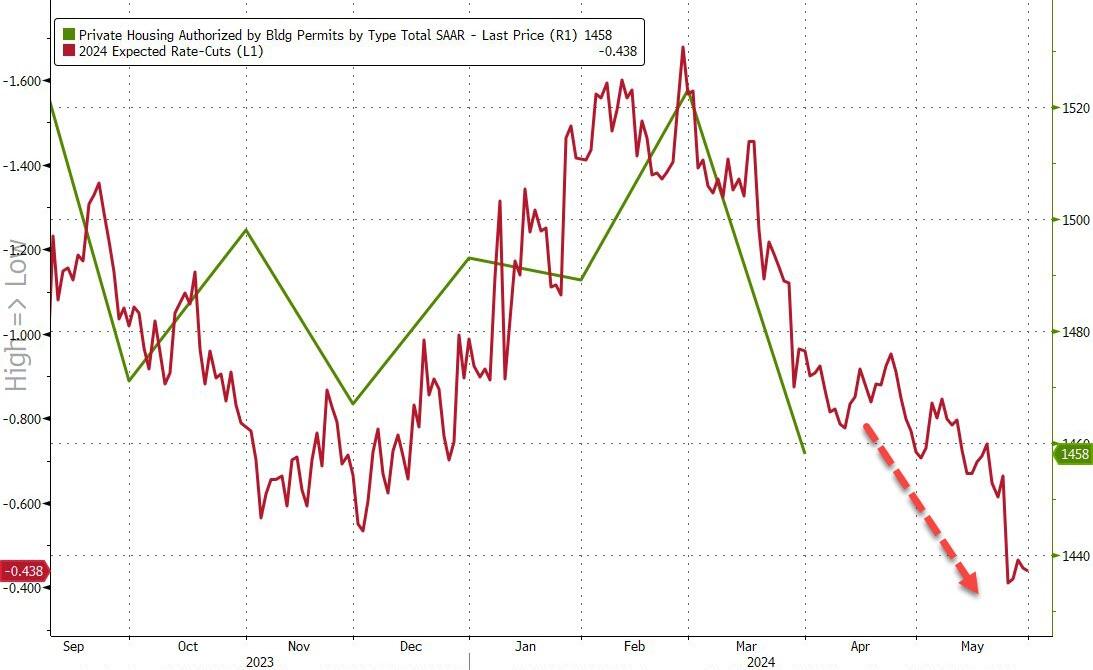
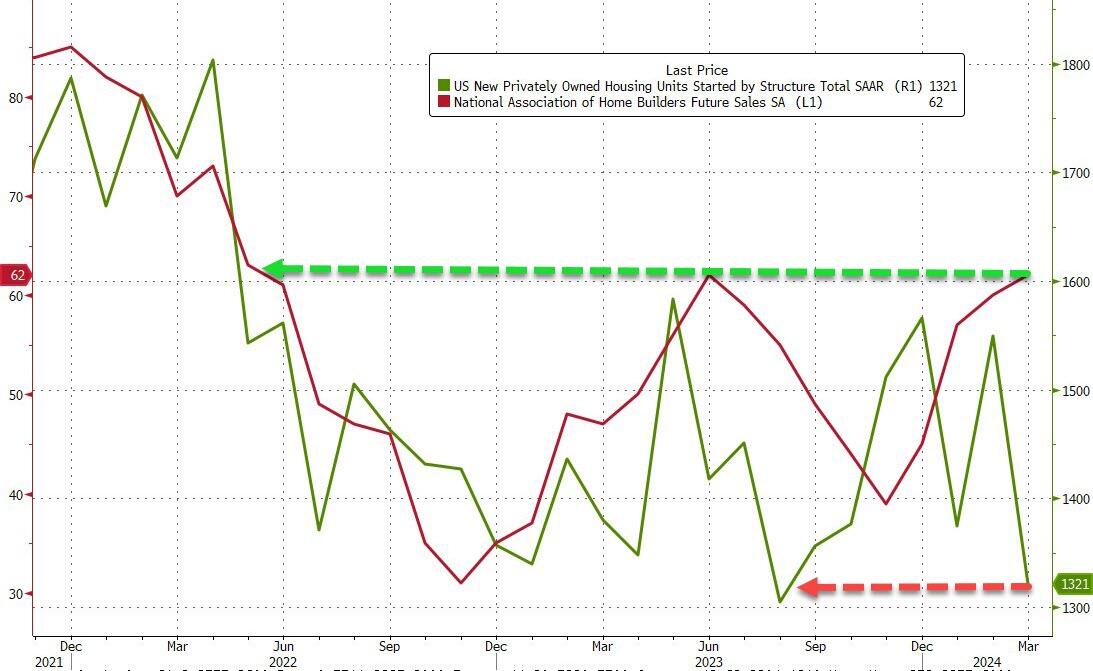
Finally, just what will homebuilders do now that expectations for 2024 rate-cuts have collapsed?
Source: Bloomberg
One thing is for sure – do not trust what homebuilders ‘say’ (as NAHB confidence jumped to its highest since May 2022 at the same time as housing starts crashed)…
Bidenomics is really about insane money printing after Covid and the installation of Biden as President. Biden and The Federal Reserve are both pushin’ too hard. Biden to fundamentally change the US and The Fed trying to cope with the inflation reaction. With Covid and then Biden’s selection as President, Federal outlays exploded (blue line) and remain elevated under Biden. To help finance the (outrageous) spending The Federal Reserve massively increased the M2 Money supply (green line). Now, The Fed has withdrawn some of the excessive monetary stimulus, but there is a staggering amount monetary stimulus still swimming around the economy like a Great White Shark.
The problem with Federal policies (energy, government spending, government debt) is that there are unpredictable factors that undo the best laid plans of mice and men. And rats such as crop blights and changes in consumer habits.
A good example is the Strategic Petroleum Reserve, which can be drained if craven politicians want to manage oil and gasoline prices for political purposes. Unfortunately, the promise of replenishment is made difficult by rising crude oil prices. The Biden admin cancels plan to refill emergency oil reserve amid high prices (some caused by factors such as war, often caused by government).
In fact, spot crude is up 73% under Biden. Partly, because of Biden’s promised war on fossil fuels and international disasters like war, blights, etc. This is why I cringe when I hear politicians and “economists” discuss why inflation will fall.
On the food side, we have cocoa prices rising 136% under Biden. Again, not predictable when policies were being made. Combine crop blights were rising transportation costs and DC, we have a problem! But this is one reason why The Fed, etc, focus on core inflation (excluding energy and food prices).
There are many examples of rising prices and how they hurt consumers, particularly middle-class and low wage workers.
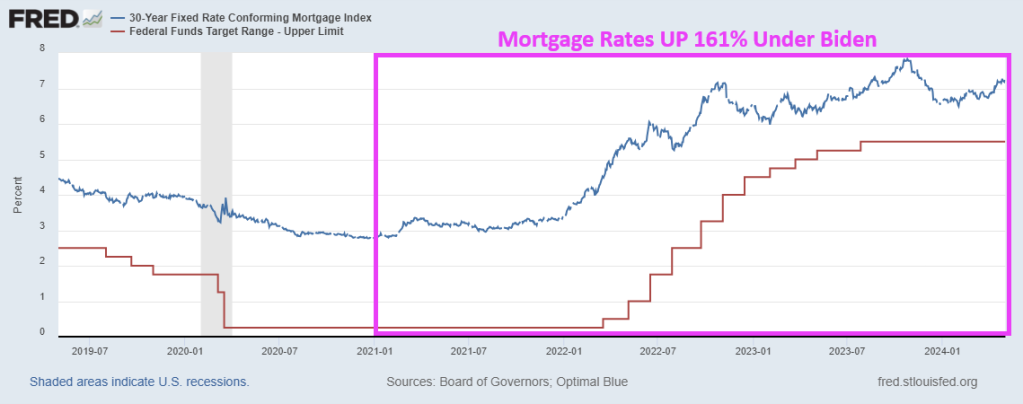
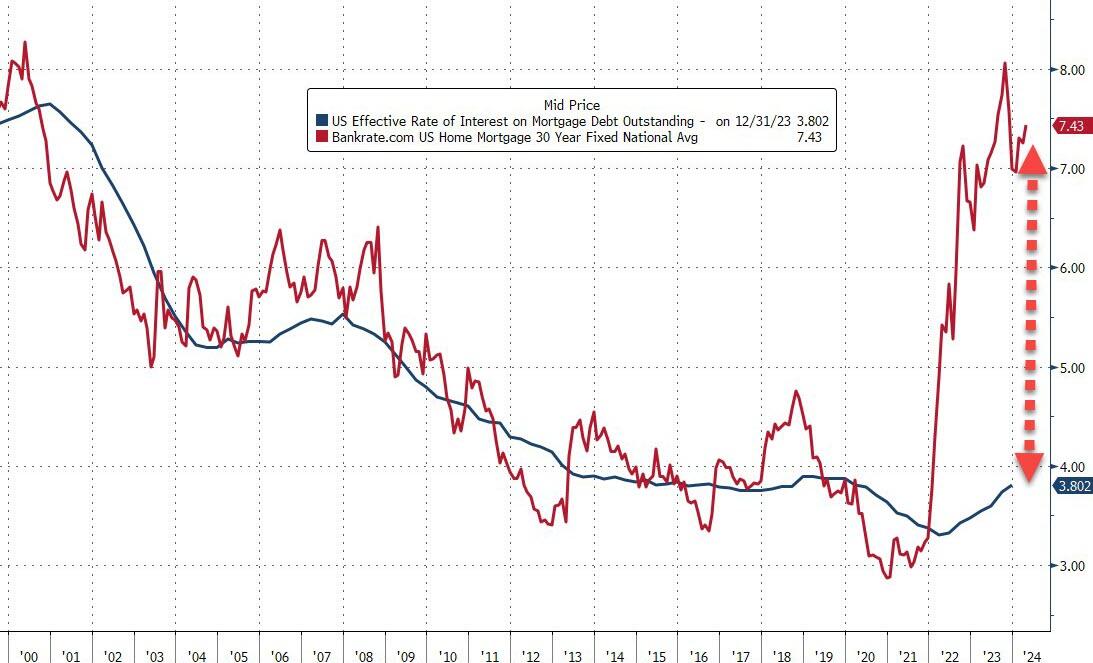
How did The Federal Reserve react to the inflation Biden helped create? They raised The Fed Funds Target Rate (Upper Bound) by 2,100% to combat Bidenflation. Freddie Mac’s 30-year mortgage rate is up 156% helping to crush homeownership aspiration for younger households.
And then we have Congress/Biden shoveling more than $10 billion in subsidies to Intel, even though Intel has an incentive to develop chips using borrowed funds and Intel retained earnings. But why put your shareholders at risk in case the chip gamble doesn’t payoff. Just shift the risk to US taxpayers!
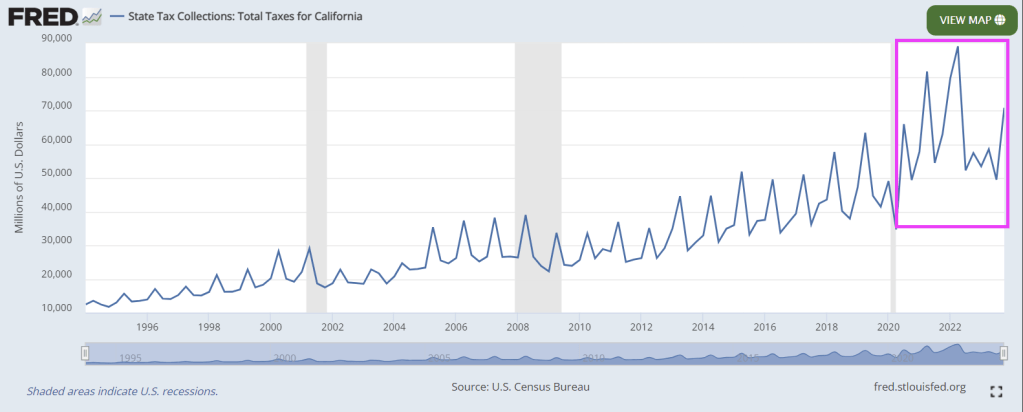
There is gold in them thar hills in California. And politicians like Gavin Newsom (aka, Pond Scum) not only spend all their cash available from (ruinous) taxes, but also spend like drunken miners and run up massive deficits and debts.
Governor Gavin Newsom bragged of a surplus, but California is seriously underwater. The next recession will hit the state extremely hard.
California’s total state and local government debt now stands at almost $1.6 trillion, or about half the state’s GDP.
That isn’t an alarming ratio when compared to the national debt, which has now soared to 128 percent of U.S. GDP with no end in sight. But Californians carry this $1.6 trillion state and local debt ($40,000 per capita) in addition to their share of the national debt (about $90,000 per capita).
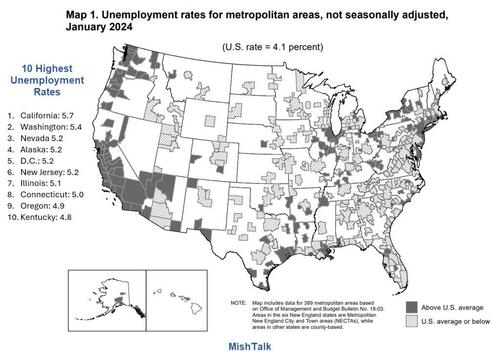
Unsurprisingly, California has the highest unemployment rate in the nation at 5.7 percent vs. 4.1 percent nationally.
A Booming Economy?
California has massive problems although the stock market is at a record high and the economy is allegedly booming. The next recession will hit California exceptionally hard, and it’s not too far off.
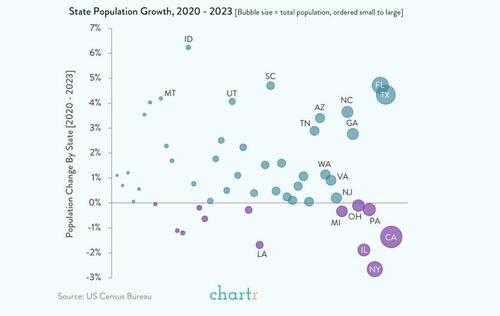
But thanks to Newsom’s Presidential ambitions (God help us!), along with virtually psychopathic state legislators, California has been tax crazy (particularly in 2022). This has helped to drive a demoralized middle class to Arizona, Texas, Nevada and other lower tax states.
And then we have California’s fast food minumum wage disaster, causing closing of small, family-owned restaurants. And causing massive layoffs in the fast food industry and probably leading to an AI takeover of corporate resturants (I remember taking my poor wife to Olive Garden and I refused to use to electronic ordering system and demanded a real waiter to serve us. The waiter told us that nobody liked the electronic ordering system).
While not the only guilty party, Newsom is a leader … in bankrupting California with his budgetary fantasies and Presidential aspirations.
I am surprised that Newsom hasn’t used the themesong from Jim Bowie as his themesong.
Jerome Powell and The Federal Reserve have to make a decision about tightening monetary policy or loosening it. It’s a Presidential election year and The Fed will probably do what is necessary to support The Biden Administration’s re-election. But let’s look at the various conflicting economic indicators that are causing confusion at The Fed.
First, the Federal Reserve’s preferred gauge of inflation wasn’t hotter than expected in February, which could keep a mid year interest rate cut on the table.
The year-over-year change in the so-called “core” Personal Consumption Expenditures index — which excludes volatile food and energy prices — clocked in at 2.8% for the month of February.
That was in line with economist expectations and down from 2.9% in January. Core prices rose 0.3% from January to February, which was also in line with expectations and down from 0.5% in the previous month.
The new PCE reading could be an encouraging development to some Fed officials who raised questions in recent months about the persistence of inflation after some hotter-than-expected numbers at the start of 2024.
“Core services inflation is slowing and will likely continue throughout the year,” Jeffrey Roach, chief economist for LPL Financial, said in a note.
“By the time the Fed meets in June, the data should be convincing enough for them to commence its rate normalization process. But where we sit today, markets need to have the same patience the Fed is exhibiting.”
Some Fed officials have been cautioning investors to be patient about the pace of rate cuts.
Fourth, on the housing front, the 30-year mortgage rate is up 156% under Biden’s Reign of Error. Rate cuts would be helpful for reducing mortgage rates.
Fifth, commercial real estate. The NBER states that approximately 44% of office loans may have negative equity. They estimate that a 10% to 20% default rate on commercial real estate (CRE) loans, similar to levels seen during the Great Recession, could result in additional bank losses of $80 to $160 billion. They emphasize the impact of interest rates, noting that none of these loans would default if rates returned to early 2022 levels. With around $1 trillion in maturing CRE loans this year, higher interest rates could lead to challenges in refinancing, especially for office spaces facing high vacancy rates and declining valuations.
Finally, we have Citi’s economic surprise index (blue line) which is positive at 30.70 despite The Fed already having raised their target to the highest level since 2000 before the Iraq War/9-11 recession.


You must be logged in to post a comment.