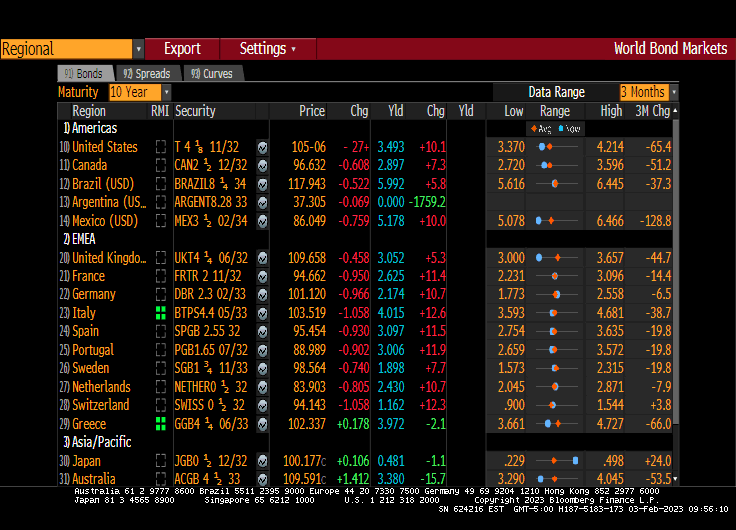
Last week’s strange jobs report (massive discrepancy between the Establishment and Household data) did push expectations of further Fed rate hikes up. In fact, the US Treasury 10-year yield is up 10 basis points this morning.
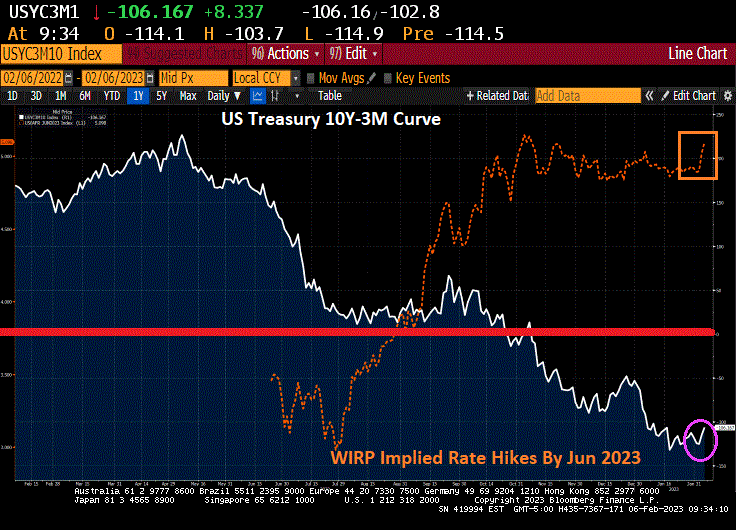
The US Treasury 10Y-3M yield curve remains inverted at -106 basis points while the implied Fed rate hike for the June 2023 FOMC meeting jumps to over 5%.
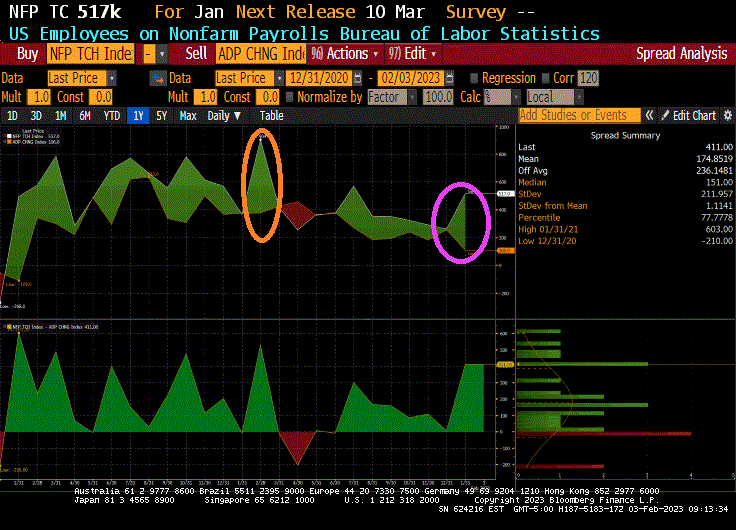
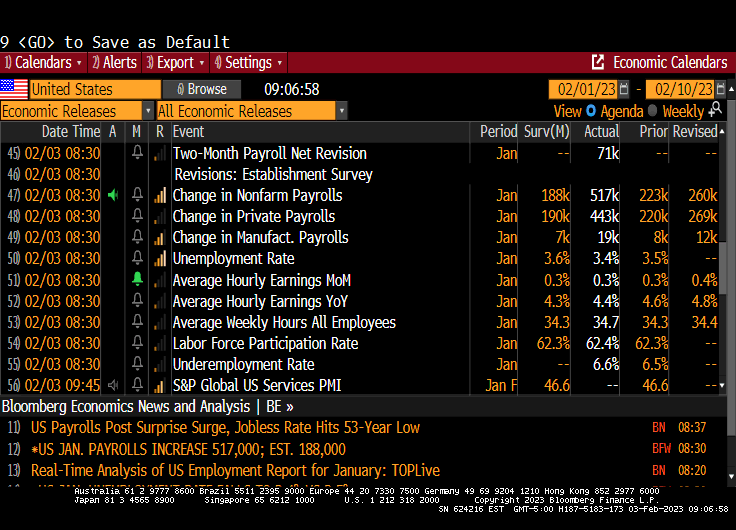
Today’s jobs report from the Bureau of Labor Statists (BLS) was stunning. 517k jobs added! Very strange since the ADP jobs added report on Febuary 1st was only 106k. THAT is a huge discrepancy (probably a seasonal adjustment in the BLS reporting).
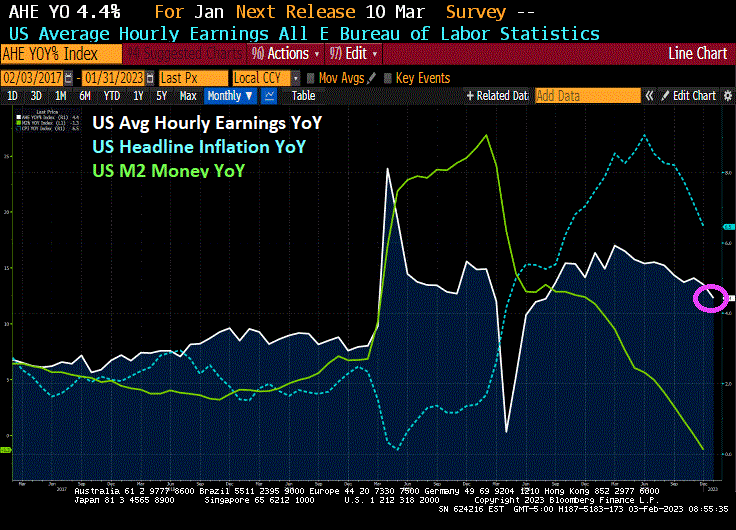
Average hourly earnings rose to 4.4% YoY. Too bad headline inflation is still roaring at 6.5%. So, the inflation tax is still overwhelming wage growth.
The spread between the January jobs report (BLS) and the ADP jobs added report (ADP) is similar to the infamous jobs report that the Philly Fed “corrected” (orange circle).
Here is the summary of the BLS numbers.
And on the strange jobs report, US Treasury 10-year yields are up 10+ basis points.
Where were the jobs added? How about “Hey Bartender!” since leisure and hospitality added 128k jobs in January.
Leisure and hospitality added 128,000 jobs in January compared with an average of 89,000 jobs per month in 2022. Over the month, food services and drinking places added 99,000 jobs, while employment continued to trend up in accommodation (+15,000).
In January, employment in professional and business services rose by 82,000, led by gains in professional, scientific, and technical services (+41,000). Job growth in professional and business services averaged 63,000 per month in 2022.
Government employment increased by 74,000 in January. Employment in state government education increased by 35,000, reflecting the return of university workers after a strike.
Health care added 58,000 jobs in January. Job growth occurred in ambulatory health care services (+30,000), nursing and residential care facilities (+17,000), and hospitals (+11,000).
Employment in retail trade rose by 30,000 in January, following little net growth in 2022 (an average of +7,000 per month). In January, job gains in general merchandise retailers (+16,000) and in furniture, home furnishings, electronics, and appliance retailers (+7,000) were partially offset by a decline in health and personal care retailers (-6,000).
Construction added 25,000 jobs in January, reflecting an employment gain in specialty trade contractors (+22,000). Employment in the construction industry grew by an average of 22,000 per month in 2022.
In January, transportation and warehousing added 23,000 jobs, the same as the industry’s average monthly gain in 2022. Over the month, employment in support activities for transportation increased by 7,000.
Employment in social assistance increased by 21,000 in January, little different from the 2022 average gain of 19,000 per month.
Manufacturing employment continued to trend up in January (+19,000). In 2022, manufacturing added an average of 33,000 jobs per month.
Employment showed little change over the month in other major industries, including mining, quarrying, and oil and gas extraction; wholesale trade; information; financial activities; and other services.
The source of the jobs miracle? Changes in how jobs are measured.
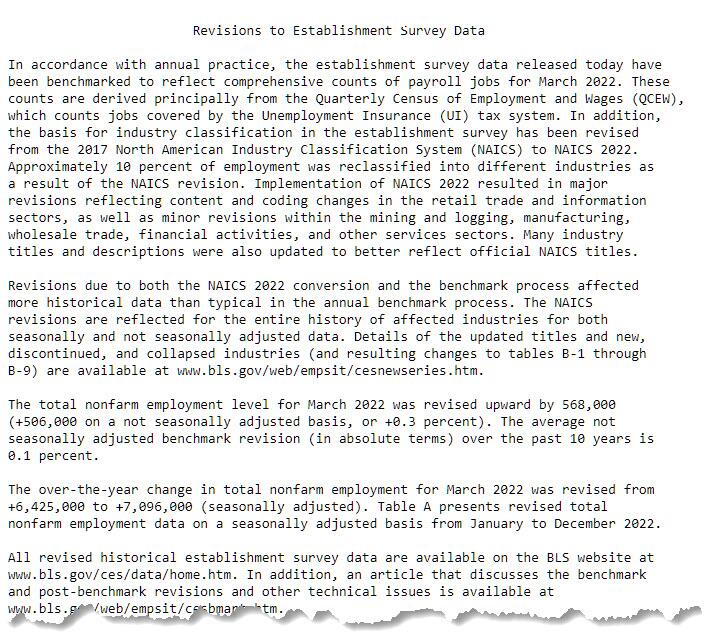
Changes to The Employment Situation Data | | | | Establishment survey data have been revised as a result of the annual benchmarking | | process, the NAICS 2022 conversion, and the updating of seasonal adjustment factors. | | Also, household survey data for January 2023 reflect updated population estimates. | | See the notes at the end of this news release for more information. | |_________________________________________________________
President Biden had better give his State of the Union Address before the economy worsens any more.
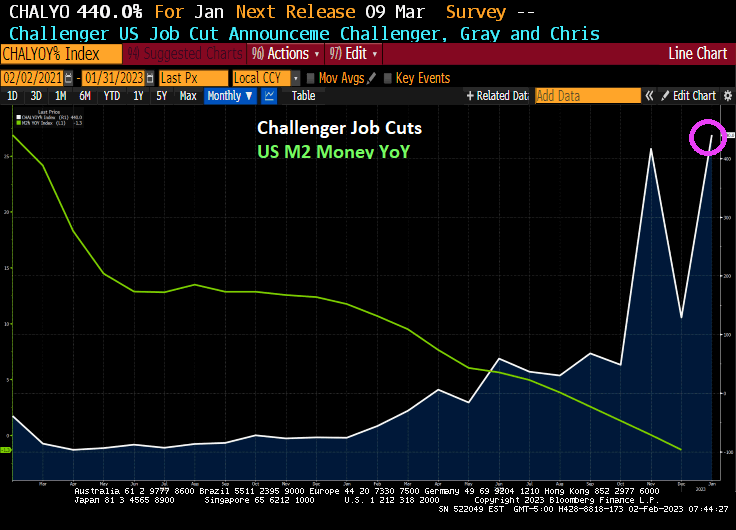
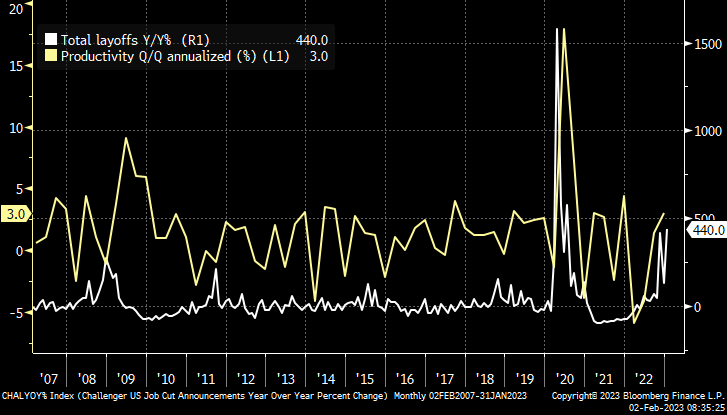
In January, the Challenger, Gray and Christmas jobs cuts index was a doozy. Jobs cuts rose 440%. This is happening as The Federal Reserve keeps its feet on the monetary brake pedal.
The Challenger report shows a big jump of 135.8 percent in layoff intentions to 102,943 in January, up from 43,651 in December and 440.0 percent higher than the 19,064 in January 2022. Many of the job cuts are in the tech sector, but job cuts are now spreading across the economy as a recession looms.
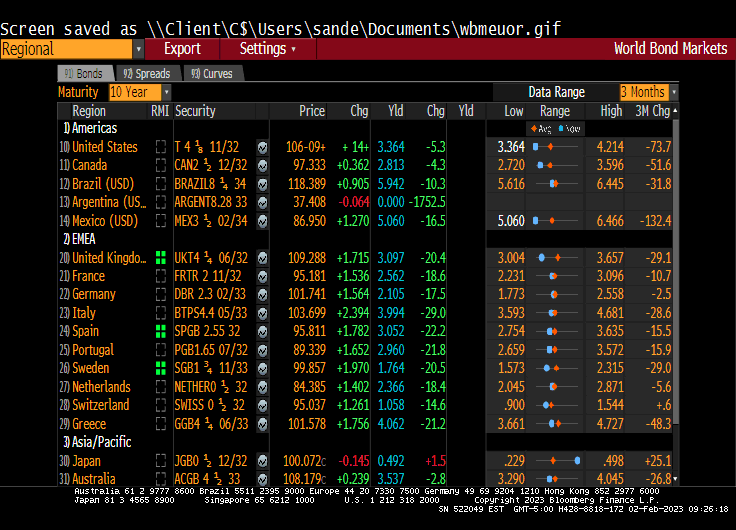
This morning, the US Treasury 10-year yield is down only -3.5 basis points, but it is Europe where the action is. UK is down -16.2 basis points and Italy is down -14.8 bps. UPDATE: US 10Y yield down -5.3 BPS, Italy 10Y down -29 bps.
The Federal Reserve slowed its drive to rein in inflation and said further interest-rate hikes are in store as officials debate when to end their most aggressive tightening of credit in four decades.
Policymakers lifted the Fed’s target for its benchmark rate by a quarter percentage point to a range of 4.5% to 4.75%. The smaller move followed a half-point increase in December and four jumbo-sized 75 basis-point hikes prior to that.
The unanimous decision by the Federal Open Market Committee was in line with financial market expectations.
Markets are forecasting a pivot after the June meeting in 2023.
The face of The Federal Reserve. Although Yellen is now Biden’s Secretary of Treasury.
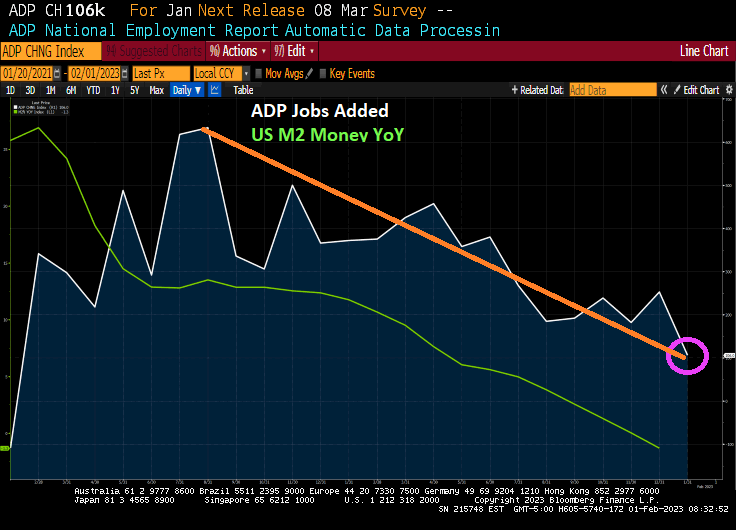
The US economy is slowing down. In fact, ADP jobs added just printed at 106k in January, the lowest reading since August 2021. ADP jobs added follows the slow down of M2 Money growth YoY as The Fed tightens its monetary policy.
Do I detect a trend (orange line)?
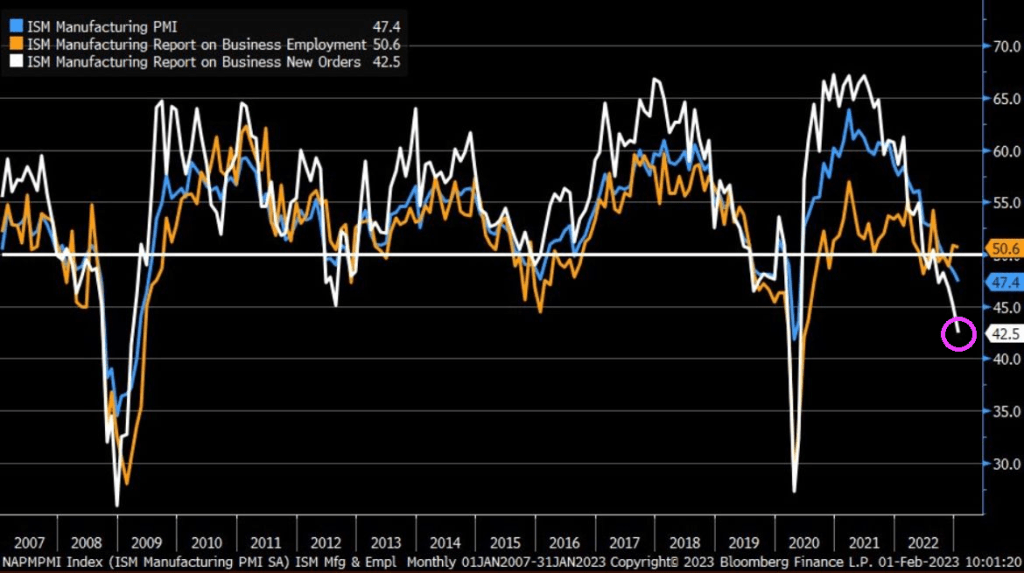
Speaking of trends, check out ISM Manufacturing New Orders. Lowest since Great Recession of 2008 (if I exclude the government economic shutdown Covid recession).
I doubt that January’s ADP report or the ISM Manufacturing report will be mentioned in Biden’s State of the Union address.
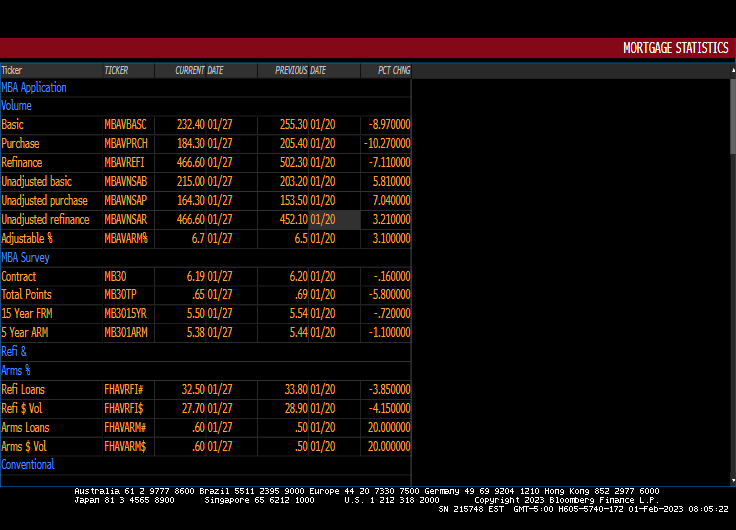
The January mortgage applications book is closed. And we are off to another year of rising applications until May. Then the downhill slide.
Mortgage applications decreased 9.0 percent from one week earlier, according to data from the Mortgage Bankers Association’s (MBA) Weekly Mortgage Applications Survey for the week ending January 27, 2023.
The Refinance Index decreased 7 percent from the previous week and was 80 percent lower than the same week one year ago. The seasonally adjusted Purchase Index decreased 10 percent from one week earlier. The unadjusted Purchase Index increased 7 percent compared with the previous week and was 41 percent lower than the same week one year ago.
US mortgage rates have been steadily declining since November 2022.
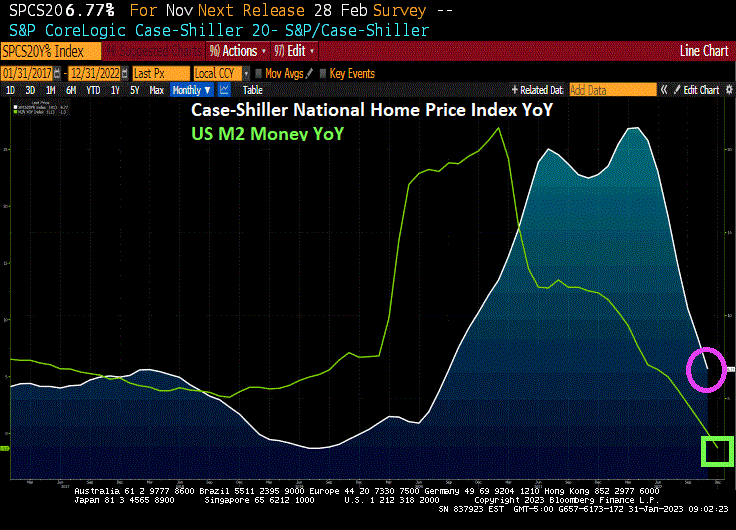
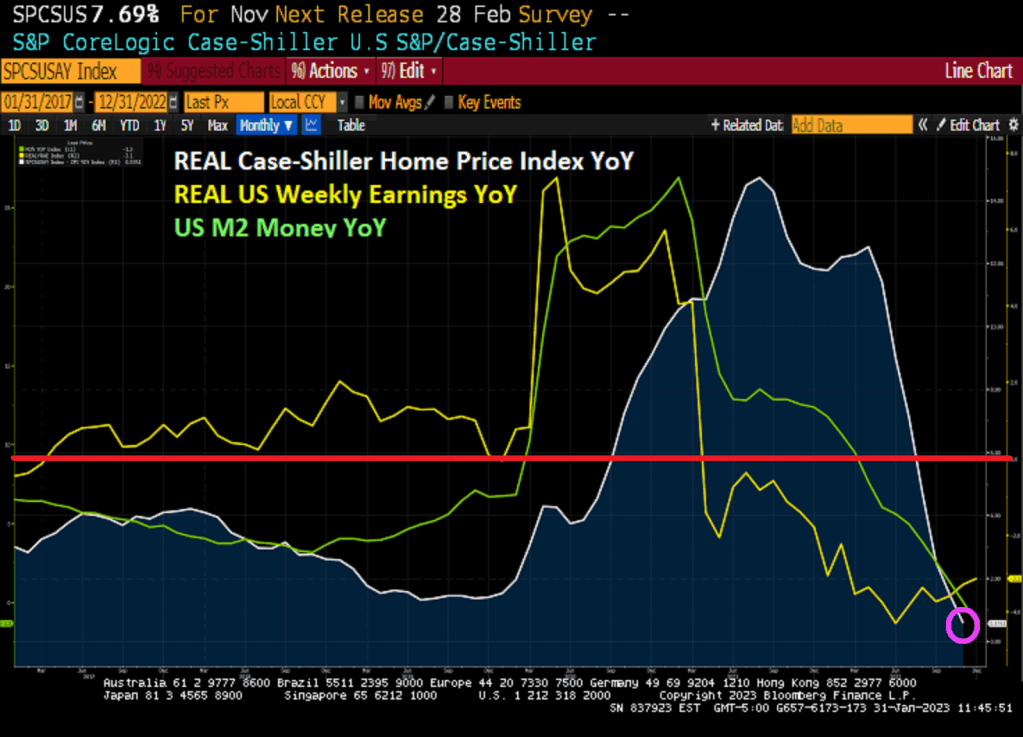
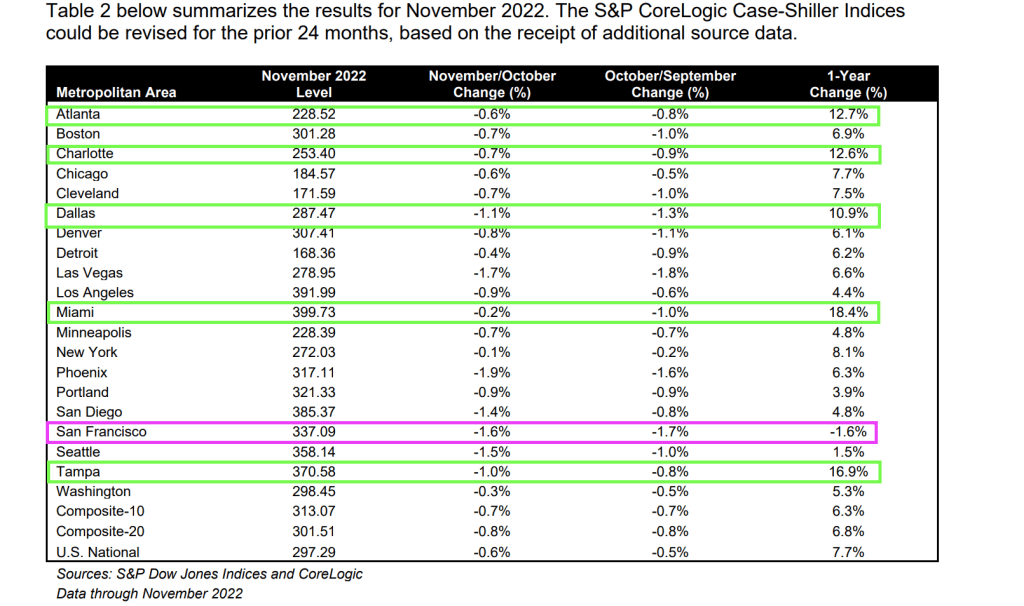
On a year-over-year (YoY) basis, the Case-Shiller National home price index slowed to 6.77%. On a month-over-month (MoM) basis, the CS National index fell -0.54%. That is the 5th straight month of home price declines.
In REAL terms, the Case-Shiller National home price index is up only 0.58% YoY as REAL Weekly Earnings growth is negative at -3.1% YoY.
Only San Francisco fell on a YoY basis (down -1.6%). Five metro areas were above 10% and they are all in the South. Atlanta, Charlotte. Dallas, Miami and Tampa.
On MoM basis, every metro area in the Case-Shiller 20 index saw price declines from October to November.
The Federal Reserve’s Open Market Committee (FOMC) is meeting on Wednesday. What will they do?
First, The Fed Funds Target (upper bound) is above the Core US inflation rate YoY. Second, M2 Money growth YoY has slowed to -1.3%.
Of course, the members of the FOMC might decide that this is not enough and may keep raising rates and shrinking The Fed’s enormous balance sheet.
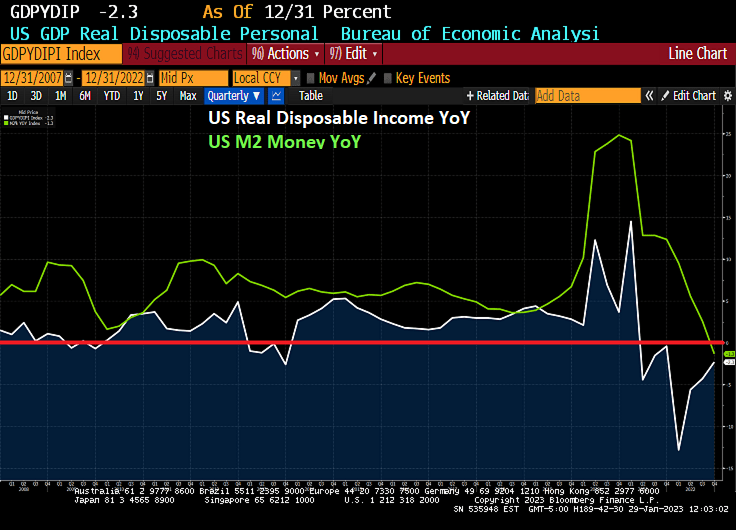
In the “Haven’t they suffered enough?” arena, US real disposable income has fallen by -21% since Biden was sworn-in as President.
On the other hand, the Taylor Rule is still pointing to a target rate of 10% (we aren’t even half way there at 4.50%).
Oh and the price of insuring against a US debt default remains elevated (since Biden and Schumer are baving like arrogant bullies) and are refusing to negotitate over spending cuts.
The 1Y CDS volatility cube indicates that it will all be over soon.
Welcome to the wonderful world of Bidenomics, giving the US 40 year highs in inflation leading The Federal Reserve to remove its enormous monetary stimulus (known as “The Punch Bowl.”
I previously pointed out that US Real GDP was actually less than 1% year-over-year (YoY) in 2022, hardly a fantastic number given the trillions in Biden/Pelosi/Schumer spending (Omnibus, Infrastructure, etc) and Powell/Fed’s whopping monetary stimulus in 2020. But real disposable income, the amount households have left to spend after adjusting for inflation, had been falling for 7 straight months.
In fact, REAL disposable personal income peaked in March 2021, shortly after Biden was sworn-in as President in Janaury 2021 at $19,213.9 billion (or $19.214 TRILLION). As of December 2022, real personal disposable income had fallen to $15,213.0 or $15.213 TRILLION. That is a loss of $4 TRILLION since March 2021. Or a -21% Loss in Real Disposable Income.


You must be logged in to post a comment.