Interest On US Debt Skyrockets Above $1 Trillion For The First Time Ever (Annual Interest Payments On 30-year Mortgage In 2020 Was $8,500, But Has Almost Tripled To $24,300!)

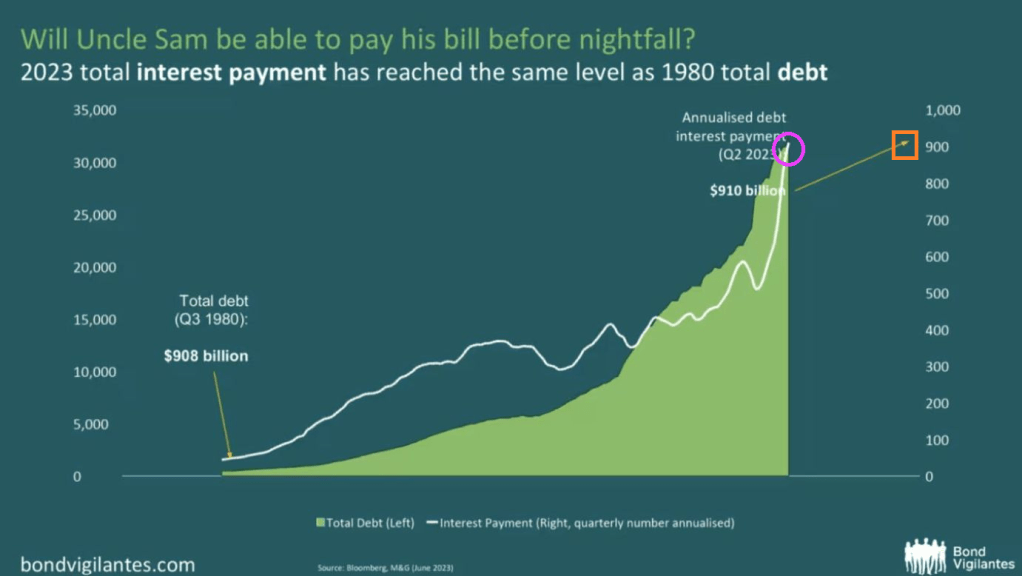
Another day, another dose of bad fiscal/monetary news. Not surprising with the US Treasury being run by Janet Yellen, who doesn’t seem to know much economics. In fact, with Biden/Congress spending like drunken sailors in port, inflation and The Fed’s counterattack, we see that interest of US debt just hit $1 TRILLION!

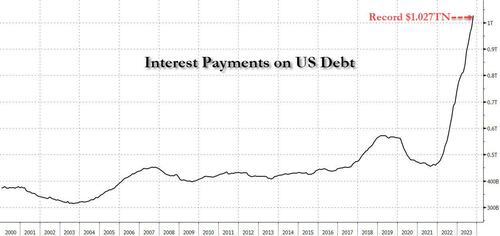
$1.027 trillion in interest is calculated by multiplying the average interest rate on marketable US Treasury debt (which according to the Treasury is 3.096% as of Oct 31) by the $26.003 trillion in marketable US debt (as of Oct 31) which nets off to $805 billion, and adding to this non-marketable debt interest (which as of Oct 31 was 2.884% multiplied by the amount of non-marketable debt which is $7.696 trillion) and which in turn is an additional $222 billion in interest. Add across and you get $1.027 trillion.

Naturally, this calculation of estimated real-time interest costs – which is entirely based on Treasury data – is different than what the Treasury actually paid. Interest costs in the fiscal year that ended Sept. 30 ultimately totaled $879.3 billion, up from $717.6 billion the previous year and about 14% of total outlays, however that number is merely lagging what the pro forma print currently is, and will inevitably catch up to it, and then lag on the other side even as pro forma interest payment start dropping (once interest rates plunge after the next QE/YCC is launched).

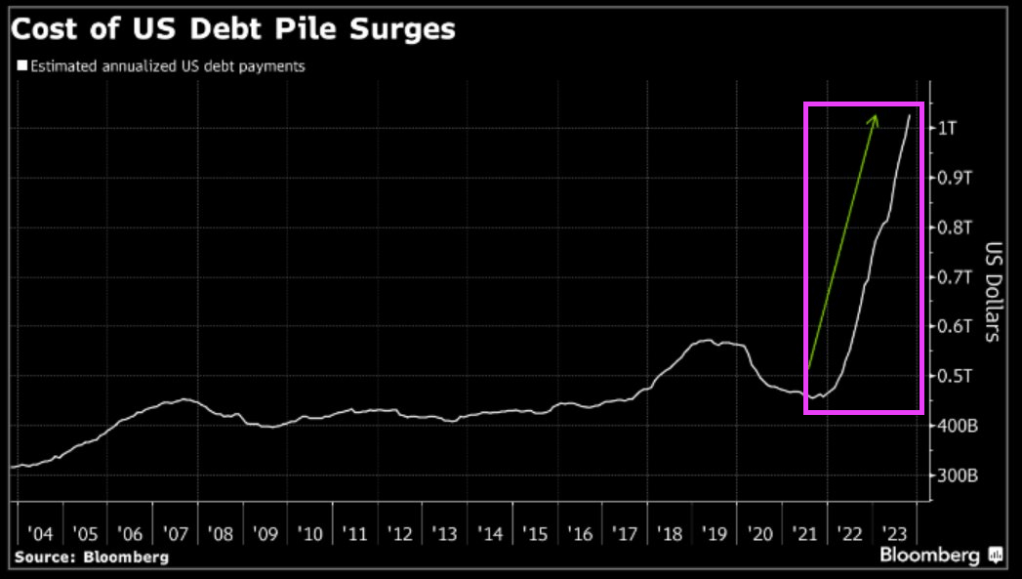
Fans of exponential functions, we got you covered: the unprecedented surge in both interest rates and interest expense in the past two years means that total US interest has doubled since April 2022 and that’s with the inherent lag in interest catch up – as a reminder, the vast majority of 5, 7, 10 and 30 year debt is still locked in at much lower interest rates, and as such, rates will continue to rise as all of the existing debt rolls into much higher rates over the coming years.

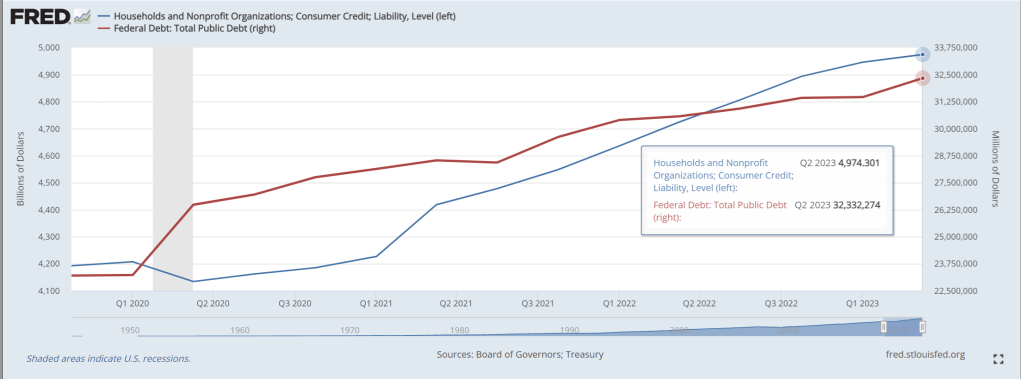
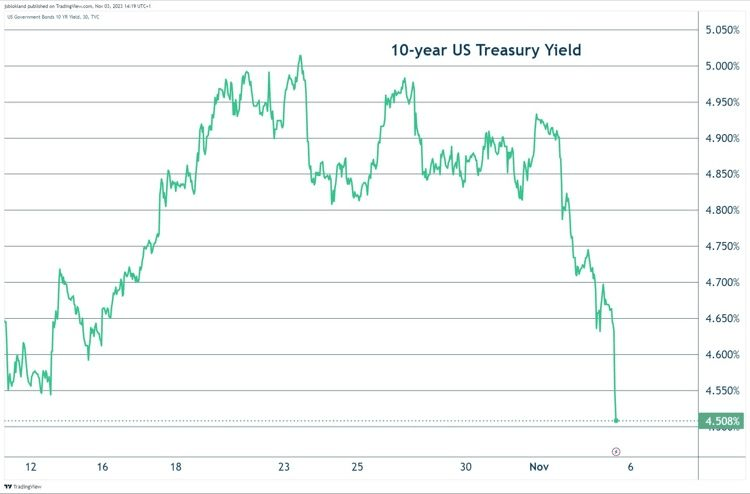
Looking ahead, the staggering surge in both yields and total long-term Treasuries in recent months confirms the government will continue to face an escalating interest bill. As a reminder, we were the first to point out that it took just one month after US federal debt first rose above $33 trillion for the first time, to spike by another $600 billion.

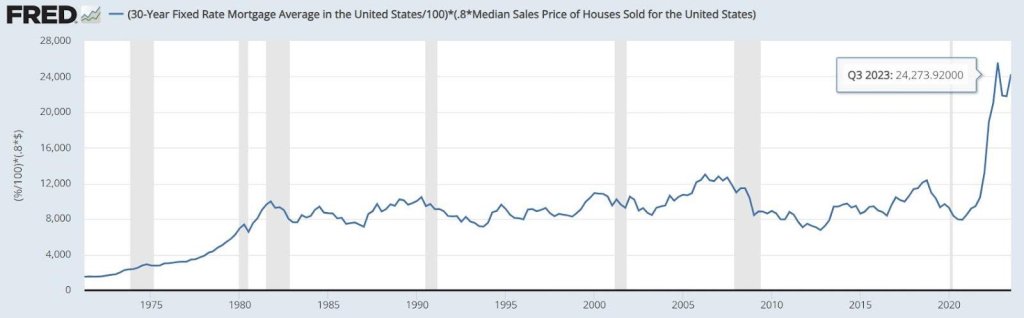
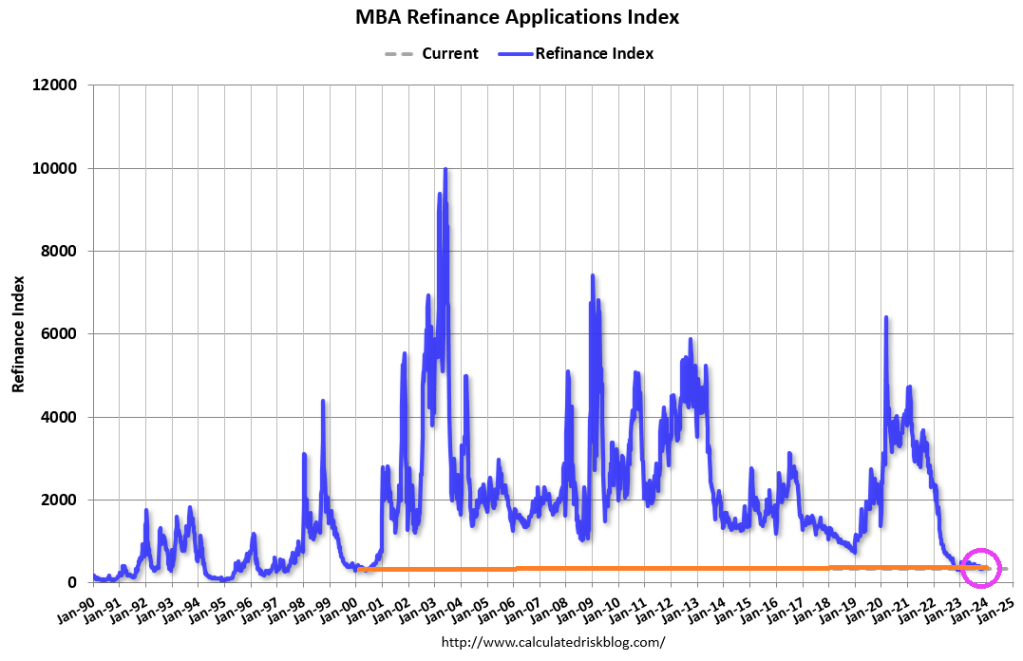
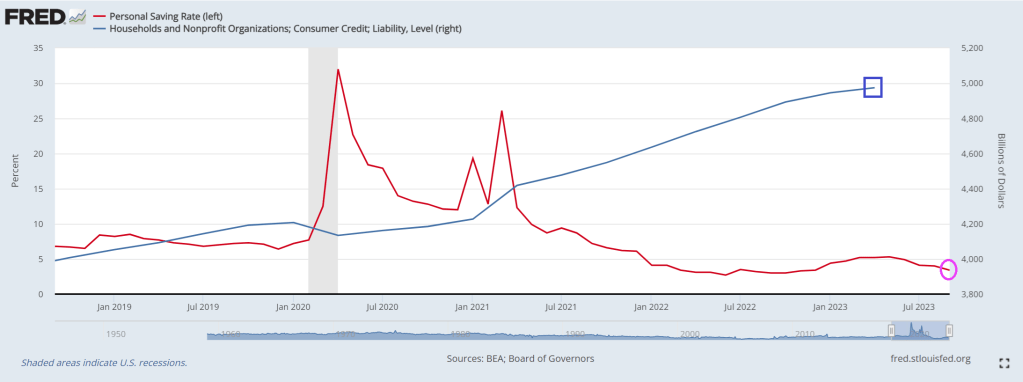
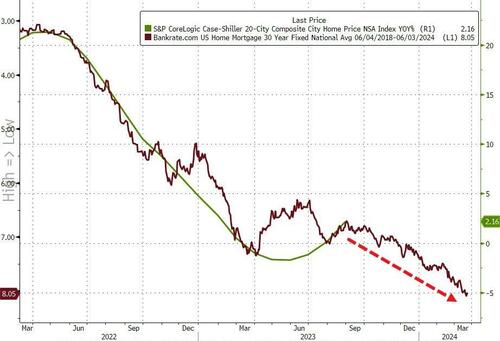
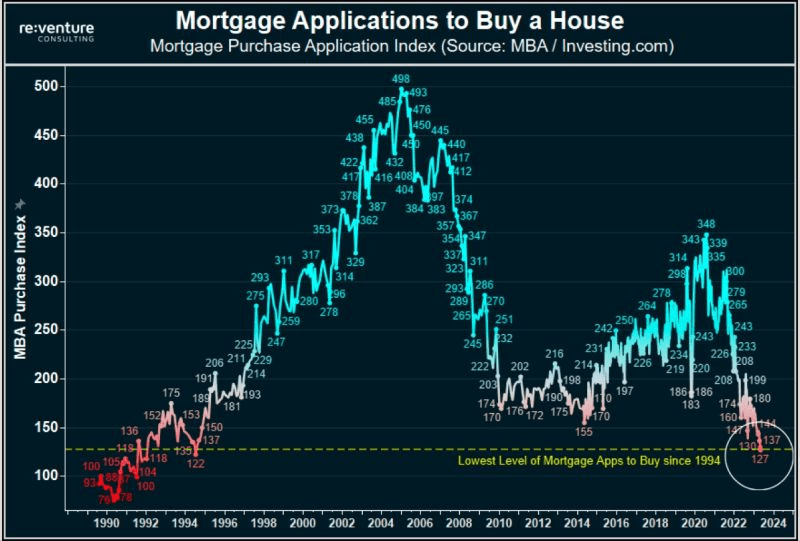
On the personal finance side, annual Interest payments on a 30-year, fixed-rate mortgage before Biden was $8,500, but after Biden it almost tripled to $24,300! That means that annual mortgage interest rose 186% under Biden.

Down, Down, Down! Cost Of US Debt Surges As Federal Debt Hits $33.71 TRILLION And Unfunded Liabilities Hit $211 TRILLION (Livin’ La Vida Bidenomics!)

The US economy is drowing in debt, going down, down, down.

US Federal debt just hit $33.71 TRILLION. And unfunded liabilities (promises from Uncle Spam) are now $211 TRILLION. That is 526% of the the current debt load. Which means either lots of additional debt, higher tax rates or cuts in entitlements.

The cost of US debt continues to soars as The Fed combats Bidenflation.

But it isn’t just Federal government debt that is exploding under Bidenomics. Consumer credit card debt has exploded under Bidenomics as consumer struggle with inflation.

Livin’ La Vida Biden! And Bidenomics!!!

Biden’s Mortgage Market! Mortgage Demand (Applications) Increase By 2.5% From Previous Week As Mortgage Purchase Demand Down -20% From Last Year (Refi Demand Down -7% From Last Year While Mortgage Rate Is UP 169% Under Biden)

US inflation is lower than it was a year ago (cheers from The View CNN and MSNBC cheerleaders), but inflation remains stubborning above The Fed’s 2% target rate and will likely remain above 2% for the nexf few years. So mortgage demand is much like inflation … mortgage demand increased in the latest week but generally is very low compared to last year.

Mortgage applications increased 2.5 percent from one week earlier, according to data from the Mortgage Bankers Association’s (MBA) Weekly Mortgage Applications Survey for the week ending November 3, 2023.

The Market Composite Index, a measure of mortgage loan application volume, increased 2.5 percent on a seasonally adjusted basis from one week earlier. On an unadjusted basis, the Index increased 1 percent compared with the previous week. The Refinance Index increased 2 percent from the previous week and was 7 percent lower than the same week one year ago

The seasonally adjusted Purchase Index increased 3 percent from one week earlier. The unadjusted Purchase Index increased 1 percent compared with the previous week and was 20 percent lower than the same week one year ago.

The 30-year fixed mortgage rate dropped by 25 basis points to 7.61 percent, the largest single week decline since July 2022. But, mortgage rates are up 169% under Biden and Bidenomics.

Bideomics is over, under, sideways, down. Mostly down.

Alarm! Bidenomics And The Tilt Effect (Mortgage Rates Up 174% Under Biden, 10Y Treasury Yield Up 402%, Real Disposable Income Declining, TLT Calls Explode!)

Alarm!

No, this isn’t the tilt effect in the mortgage market where inflation is front-loaded in mortgage rates making mortgage payments quite unaffordable. Although inflation is causing mortgage rates to be up 174% under Biden (while Biden continues to brag about how Bidenomics is helping). Meanwhile, the 10Y Treasury yield is up 402% under Biden (making refinancing the US staggering debt load more difficult to refinance. Higher mortgage rates tilt the present value of mortgage payments to the front, making housing even more unaffordable. Thanks Joe!

But the Tilt effect I am talking about is the TLT effect. TLT (iShares US Treasuries 20y+ ETF) calls. Friday was the largest TLT call volume ever.

Meanwhile, US real disposable income is declining.

I’ll feel a whole lot better when Biden is gone.

Meanwhile, inflation under Biden is still eight miles high.

“Rich Men North Of Richmond” Economy! US Debt Up 45% Since Q1 2020, But Consumer Debt Is Up 19% Under Biden (Personal Savings Down To 3.4% Compared To 7.7% In Last Month Before Covid Outbreak (Earnings Calls Reveal Concern About Continued Demand)

Call it “The Rich Men North Of Richmond” economy. Where the coastal elites drive the US economy off the cliff with insane spending and borrowing with much of the benefits flowing to big political donors, not the middle class. Think of Span Bankfraud Parboiled as an example.

President Biden loves to spend billions and go on endless vacations (he is in Rehobeth Beach Delaware yet again). He (illegally) forgave student debt, keeps spending billions on Ukraine and keeps spending on failed green energy nightmares.

Biden and his allies will tout the latest GDP numbers as an example of how marvelous Bidenomics is. BUT that GDP report was driven largely by consumer spending.

Since the Covid outbreak in 2020, Federal (public) debt is up 45%! Wow. And consumer debt is up 19% under Biden to cope with inflation (caused primarily by massive Federal spending).

To fuel consumer spending, the personal savings rate has fallen to 3.4%. For point of reference, the personal savings rate in Februray 2020 was 7.7%, so the consumer is running out of gas thanks to inflation and spending.

And with a debt-stressed consumer, earnings call revealed concern about continued demand.

Note the trend in jobs added as The Fed tightened to fight inflation.

Jobs Come Crumbling Down! October Jobs Added Only 150k, 50% Drop From September (Unproductive Government Jobs Increased By 51k While Productive Construction Jobs Grew By Only 23k) Bidenomics Hurts So Good??

Yes, the jobs come crumbling down!

Total nonfarm payroll employment increased by 150,000 in October, below the average monthly gain of 258,000 over the prior 12 months. This represents a drop of more than 50% from the original Sept print, and the second lowest since 2022!

In October, job gains occurred in health care, government, and social assistance. Employment in manufacturing declined due to strike activity. (See table B-1.) Health care added 58,000 jobs in October, in line with the average monthly gain of 53,000 over the prior 12 months. Over the month, employment continued to trend up in ambulatory health care services (+32,000), hospitals (+18,000), and nursing and residential care facilities (+8,000). Employment in government increased by 51,000 in October and has returned to its pre-pandemic February 2020 level. Monthly job growth in government had averaged 50,000 in the prior 12 months. In October, employment continued to trend up in local government (+38,000).

In October, construction employment continued to trend up (+23,000).

So, unproductive government jobs increased by 51k while productive construction employment grew by only 23k.

Average weeky; earnings growth YoY slowed to 3.2%. Too bad core inflation last printed at 4.13% YoY in September.

But the household survey shows employment collapsed by 348K, the biggest drop since the Covid shutdown.

As usual, historical data was revised massively lower, with the jobs change for August revised down by 62,000, from +227,000 to +165,000, and the change for September was revised down by 39,000, from +336,000 to +297,000. With these revisions, employment in August and September combined is 101,000 lower than previously reported. In total, 8 of the past 8 months have been revised sharply lower in what only idiots can not see is clearly mandated political propaganda designed to make the economy look stronger at first glance then quietly revise the growth away.

Bidenomics hurts so good? At least that is what Biden and KJP will say.

Soft Jobs Report Weakens Impetus for Fed Rate Hike in December. Translation? Weak jobs report = no more Fed rate hikes = falling interest and mortgage rates.  

10-year US Treasury yield now down a whopping 40 basis points in the last three trading sessions.

And its beginnig to look a lot like a BAD Christmas!

How do you recession? B-I-D-E-N-O-M-I-C-S.

Biden’s Fiscal Folly! Massive Federal Spending Is NOT Sound Fiscal Policy, Another $1.6 TRILLION In Debt (Yields Show Washington’s Interest-Rate Payments Will Eclipse Australia’s GDP)

Appartently, Joe Biden and fellow big spenders in Washington DC, Mordor on The Potomac, don’t care about fiscal discipline. With seemingly endless spending of wars (Ukraine, Israel, Taiwan and the invasion at our southern border, and inane “green” spending,

Janet Yellen and the US Treasury will be auctioning off $776 billion of debt in the final quarter of calendar 2023, a bit below market expectations. Treasury said it will auction another $816 billion in the first quarter of 2024. So, that is yet another $1.6 TRILLION in debt.

The rapid rise in US yields to ~5% points to the government’s annual interest-rate bill rising to 4.5-5% of debt outstanding in the next six months. That’s in the region of $1.7 trillion – or the GDP of Australia – each year.

Such large payments are negative for the economy. Interest is likely to be paid for using higher-velocity money (e.g. taxes) and received by holders less likely to spend the proceeds in the broad economy, and instead re-invest it. Independent monetary policy becomes increasingly difficult when the equivalent of 6% of US GDP is being diverted towards interest payments each year.

It’s not only the size of Treasury borrowing that’s a problem, but it’s maturity composition.

Today’s recommended financing schedules gave further color on longer-term debt issuance needs (i.e. debt that’s not bills).

Issuance has latterly been skewed to bills, which has ameliorated the impact on liquidity as money market funds have been able to intermediate through the reverse repo (RRP) facility at the Fed. But as issuance skews back towards longer-term debt (watch for increases in auction sizes in 2y, 3y, 5y, 7y, 10y, 20y and 30y debt for insight on this), that will have an increasingly negative impact on liquidity, especially if the Treasury maintains its large cash balance at the Fed (as it said on Monday it expected to do).

The Fed has little (or no) say over any of this.

Monetary policy will become increasingly overwhelmed in such an environment, which is why today’s Fed meeting, where it is expected to keep rates on hold, is a bit of an afterthought.

Also of more consequence currently is Japan.

The BOJ’s decision to maintain negative yields and keep its yield curve control policy largely intact ladles on yet more underlying risks to the global macro environment.

Allegedly, The Fed isn’t interested in buying additional US debt, and likely China and Japan won’t be buying our debt either. But maybe the REAL Federal government, Blackrock and their friends will buy the debt!

Guns Of August? Home Prices Rise Again In August, +2.57% YoY (Illegal Immingrant Destinations Like Chicago, New York And Detroit Are Up The Most)

Bidenomics is best represented by the novel “The Guns of August” since American’s middle class is getting blasted by Biden’s economic policies and The Fed’s rate rate hikes. Find out where Texas Governor Abbot is bussing illegal immigrants and buy in the market!!

Home prices rose for the 5th straight month in August (the latest data released by S&P Global Case-Shiller today), up 1.01% MoM (better than the 0.8% rise expected).

Source: Bloomberg

The ongoing MoM rises pushed the YoY gain in home prices at America’s 20 largest cities up 2.16%, the most since January 2023. The National Home Price index rose even faster at 2.57% YoY.

Illegal immigration destinations Chicago, New York, and Detroit all saw major home price rises (+5.0%, +4.9%, and +4.8% YoY respectively). Las Vegas, Phoenix, and San Francisco remain lower YoY (-4.9%, -3.9%, -2.5% respectively).

But, judging by the resumption of the rise of mortgage rates since the Case-Shiller data was created, we would expect prices to also resume their decline…

Source: Bloomberg

Inventory is going nowhere, buyers and sellers are stuck (affordability for the former and the mortgage cost gap for the latter), and The Fed isn’t cutting rates any time soon. Not pretty…

Simply Unaffordable! Income Needed To Buy A Home Is $111k While Median Household Income Is Only $78k, Credit Card Delinquencies Highest Since 1991, REITs Down > -10% YTD (Bitcoin, Gold UP YTD!)

Bidenomics is a windfall for the donor class (high rate of return on campaign contributions) while the middle class gets beaten to a pulp. Waiting for Biden to lean over and creepily whisper “It’s working!” Even though it is clearly not working, at least for the middle class.

Evidence that Bidenomics is not working and destructive? Try the surging income needed to buy a house under Biden. Home prices are rising faster than median household income. As in $111,000 income needed to buy a house, while median household income is only $78,000. So, housing is simply unaffordable under Bidenomics. The Biden era is outlined in pink.

Mortgage purchase applications have collapsed to 1994 levels.

Meanwhile, stressed households are seeing credit card delinquencies at the highest level since 1991.

And thanks to Uncle Spam (given how Uncle Sam is destroying the middle class it is now Uncle Spam), 2023 interest payments are the same as the total debt from 1980! Spam, which the Federal government has devolved into, is very high in fat, calories and sodium and low in important nutrients, such as protein, vitamins and minerals.

2022 was a bad year for investments under Bidenomics. 2023 year to date is showing huge gains for Bitcoin, the NASDAQ and gold. Bringing up the rear are long duration Treasuries and REITs (real estate investment trusts), both earning negative returns thus far of less than -10%.

When will we see rats fleeing the sinking SS Bidenomics as it sinks? JPMorgan Chase stock slips after bank says CEO Jamie Dimon is selling 1 million shares.

Biden, Treasury Secretary Janet Yellen and Fed Chair Jay Powell have a bad case of screwing you (Doctor, Doctor).

Back In Red! Personal Savings As % Of GDP In The Red Under Bidenomics, Fed Losses Staggering As Deficits SOAR! (Bitcoin/Gold SOAR)

To paraphrase AC/DC, the US is back in red.

Let’s start with personal savings as a percentage of disposable income. It has been in the red (meaning very low) under Billions Biden.

And The Fed is really in the red under Biden’s inflation rattling spending with losses leading to a surge in remittances.

And then we have the growth in the Federal deficit as a % of GDP in the red.

And the S&P 500 is in the red since August.

Even Biden’s pro-censorship buddies in the tech world are in the red since July.

On the black side of the ledge, Bitcoin (along with gold) are through the roof.

The first inflow to golf since May ’23.

But at least Bidenomics has helped the donor class get wealthier and has helped the lessers get part-time jobs.

Yes, Bidenomics is a highway to hell for the 99%. But a stairway to heaven for the donor class and 1%. And the donor class (and defense/banking/tech/drug industries) have Biden under their thumbs.

My foolish US Senator Sherrod “The Mad Marxist” Brown claimed that he hasn’t noticed illegal immigrants.

Of course, Senator Brown could travel with Biden to the border to witness military age men crossing the border under Biden/Mayorkis “:Operation US Chaos.”

Get me a bottle of cheap wine since it is all I afford under Bidenomics.