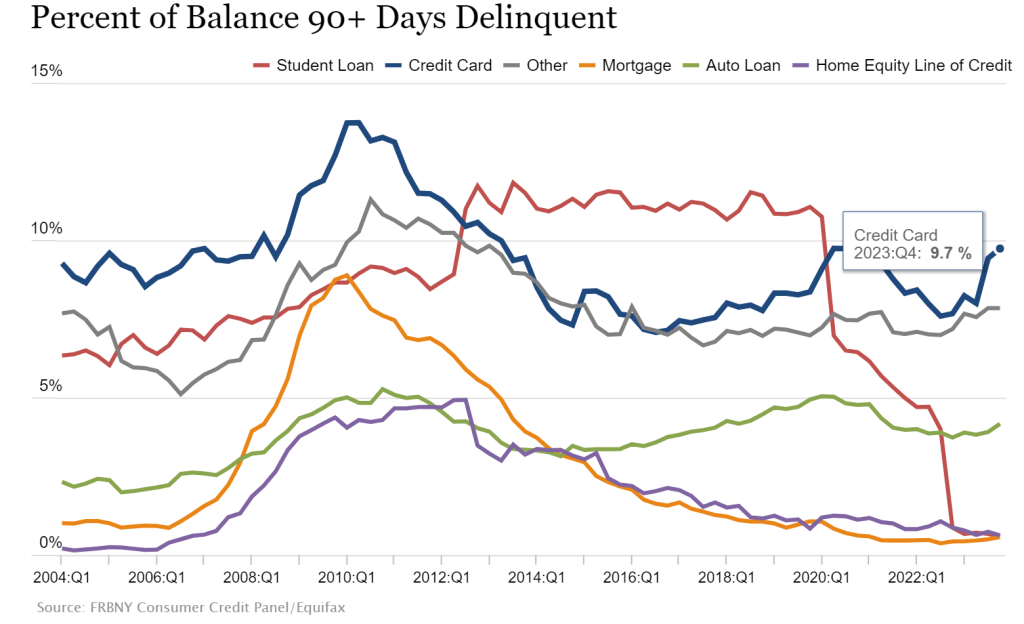
Credit card delinquecies (90+ days) rose to almost 10% in Q4 2023.
Credit card delinquencies surged more than 50% in 2023 as total consumer debt swelled to $17.5 trillion, the New York Federal Reserve reported Tuesday.
Debt that has transitioned into “serious delinquency,” or 90 days or more past due, increased across multiple categories during the year, but none more so than credit cards.
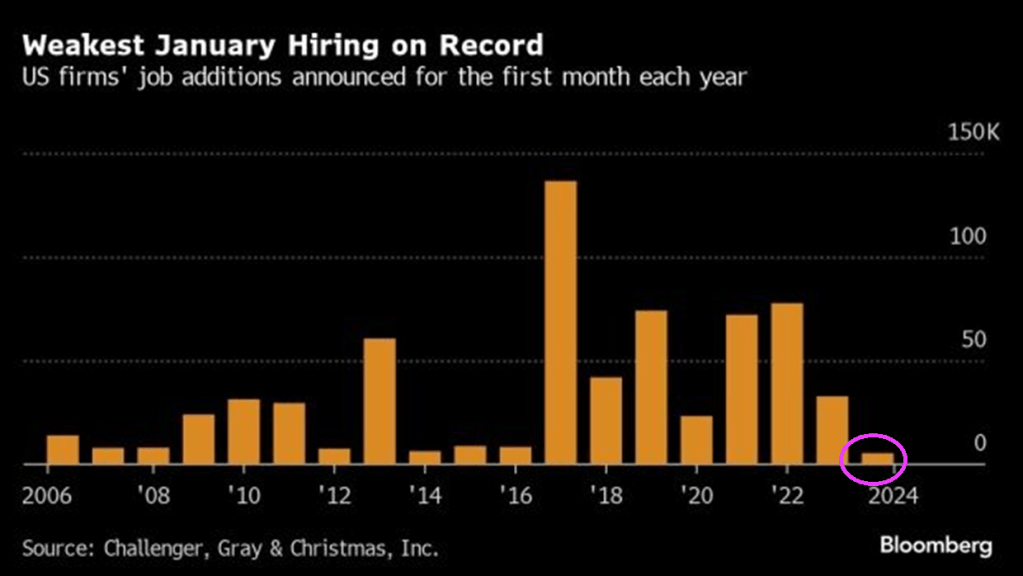
Rising credit card delinquencies combined with the worst job additions in January on record.
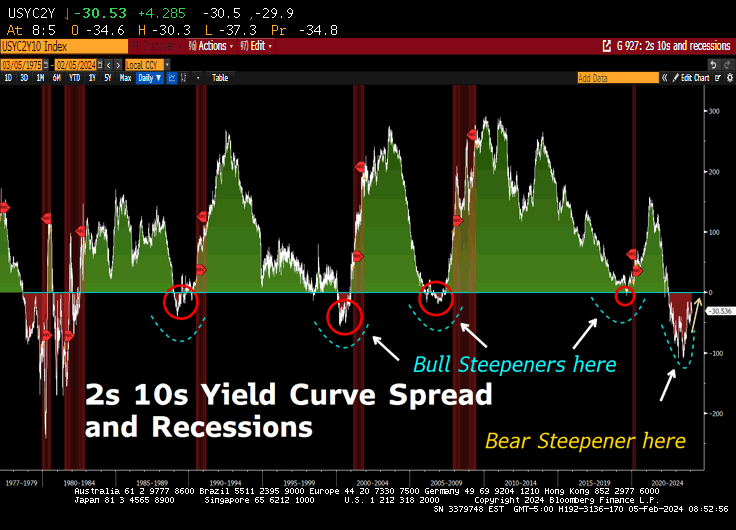
But at least the 10Y-2Y US Treasury yield curve is ALMOST flat (h
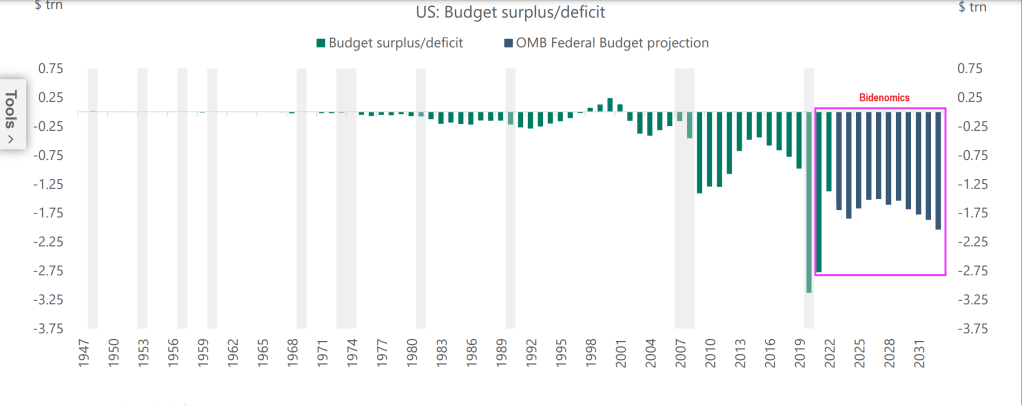
The great Will Rogers once said he never met a man he didn’t like. US President Joe Biden and Democrats have never met a spending opportunity they didn’t like (except for US border security, of course).
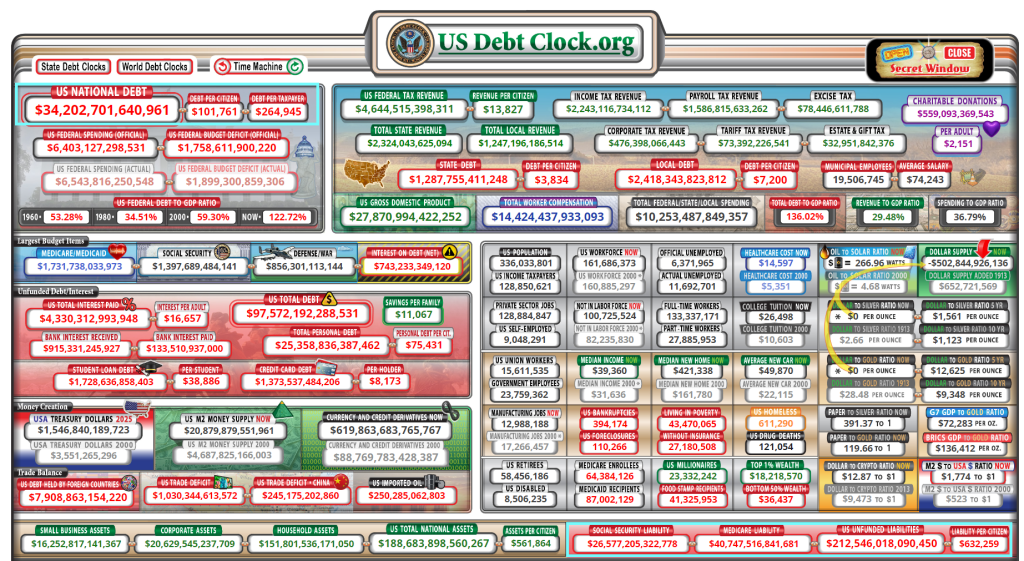
Under “Deficit Joe” Biden, Federal budget deficits have soared! And deficits are projected to grow!
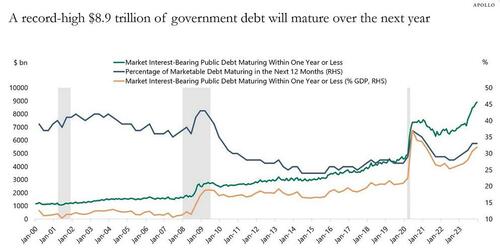
The problem, as Apollo’s gloomy chief strategist Torsten Slok points out, is that this feverish pace will only accelerate further, as a record $8.9 trillion of government debt will mature over the next year.
Meanwhile, the government budget deficit in 2024 will be $1.4 trillion according to the CBO (realistically expect this number to hit $2.0 trillion), and the Fed has been running down its balance sheet by $60 billion per month.
The bottom line is that someone will need to buy more than $10 trillion in US government bonds in 2024. That is more than one-third of US government debt outstanding. And more than one-third of US GDP.
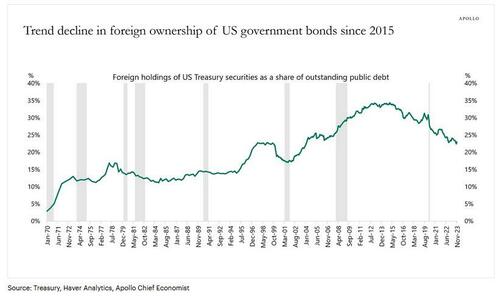
This may be a particular challenge when the biggest holders of US Treasuries, namely foreigners, continue to shrink their share.
More fundamentally, Slok muses, “interest rate-sensitive balance sheets such as households, pension, and insurance have been the biggest buyers of Treasuries in 2023, and the question is whether they will continue to buy once the Fed starts cutting rates.”
(Spoiler alert: no… but that’s what QE is for, and sooner or later, it’s coming back).
Apollo’s latest updated outlook on Treasury demand is below (pdf link).
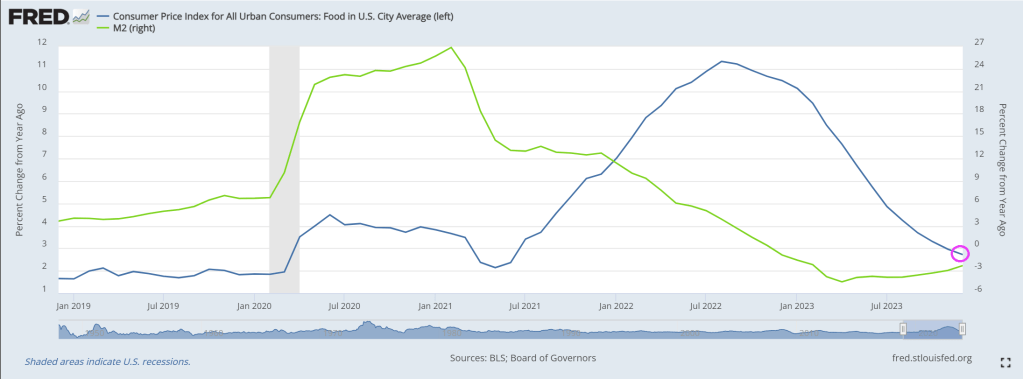
The Biden Administration which motto should be “Make Crime Great Again!” with awful crime in big cities, and millions pouring over the border, not to mention providing jobs for foreign workers and not native born Americans, is likely breathing a sigh of relief as food inflation falling to 2.7% year-over-year, still higher than pre-Covid levels under Trump. But at least food price inflation is slowing as The Fed’s money stimulus recedes.
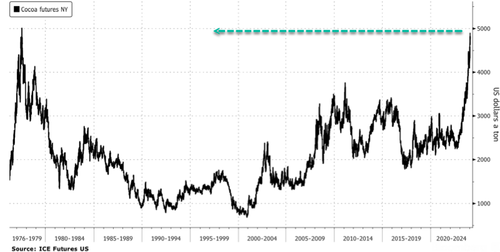
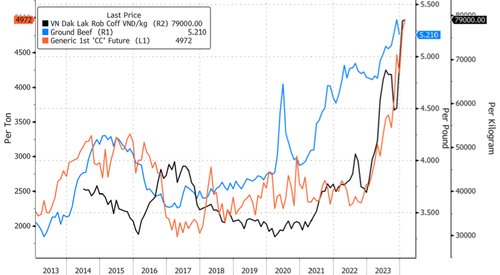
Cocoa prices climbed to a 46-year high this week in New York as concerns about dry conditions across West Africa could reduce yields for the Ivory Coast, the world’s largest producer of cocoa beans, ahead of the mid-crop in April.
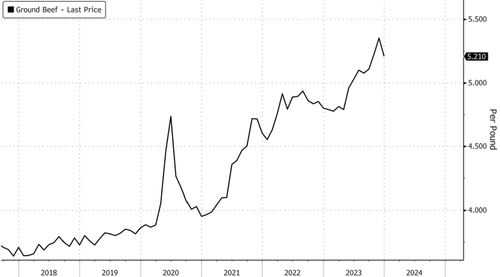
In the US, a rapidly shrinking cattle herd, now at the lowest levels in seven decades, has pushed the supermarket price of beef to a record of $5.21 per pound. Rising food prices are the central bank’s worst enemy.
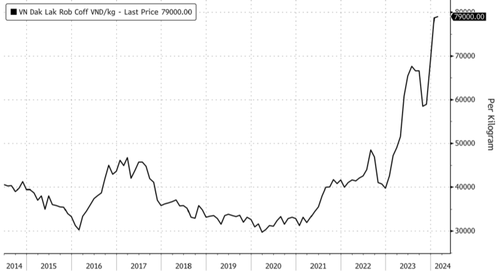
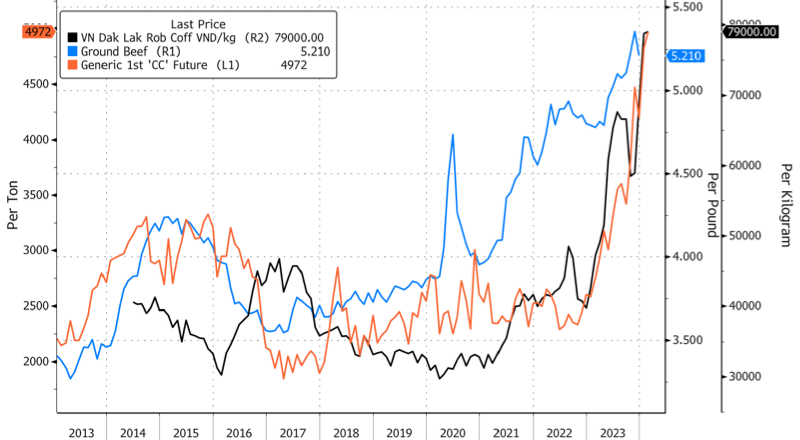
To end the week, breakfast lovers will be disappointed to learn robusta bean prices in Vietnam, the world’s largest producer of the bean, are absolutely out of control.
Local robusta prices in Vietnam hit a record on Thursday, topping nearly 80,000 per kilogram.
“That’s threatening to push prices in London up further, even after the benchmark capped its own all-time high this week at $3,336 a ton,” Bloomberg said, adding the surge in prices was primarily due to farmers “hoarding” the bean.
To recap this week, cocoa bean, beef, and robusta bean prices have been marching higher.
More bad news for Biden. Even though overall food inflation has receded, voters have long memories.
“Progress on inflation has brightened the economic picture despite a slowdown in hiring and pay. Wages adjusted for inflation have improved over the past six months, and the economy looks like it’s headed toward a soft landing in the U.S. and globally,” says Nela Richardson, Chief Economist, ADP.
ADP National Employment Report
The ADP National Employment Report shows Private Sector Employment Increased by 107,000 Jobs in January; Annual Pay was Up 5.2%
Job Switching Payouts
Year-over-year pay gains for job-stayers reached 5.2 percent in January, down from 5.4 percent in December.
For job-changers, pay was up 7.2 percent, the smallest annual gain since May 2021.
Median Change in Annual Pay (ADP matched person sample) Job-Stayers 5.2%, Job-Changers 7.2%
ADP Notice
January’s report presents the scheduled annual revision of the ADP National Employment Report, which updates the data series to be consistent with the annual Quarterly Census of Employment and Wages (QCEW) benchmark data for March 2023. In addition, this revision introduces technical updates, namely, in re-weighting of ADP data to match QCEW data. The historical file was updated to reflect these revisions.
Notice Translation
ADP revises its data to match annual BLS data from March of 2023. The BLS will do the same in its annual revisions.
The BLS does not even back adjust the numbers so its historical record is bogus. And despite being incredibly lagging, the Fed makes key decisions on the data.
Job Openings Rise in December But Quits Tell the Real Story
There’s lots of meaningless chatter yesterday about job openings. However, actions speak louder than openings.
This report comes after Fed Chair Jerome Powell said “No Sugar Tonight” as in no expected rate cuts. That is, until it becomes obvious that Biden will lose the election, THEN The Fed will start cutting rates like crazy.
An example of the trash that Biden and Democrats are importing from Latin America, Africa and China. Among other sewers. I am sure that employers are lining up to hire this guy. … NOT! Correction: Biden may appoint this creep to his cabinet with the other losers.
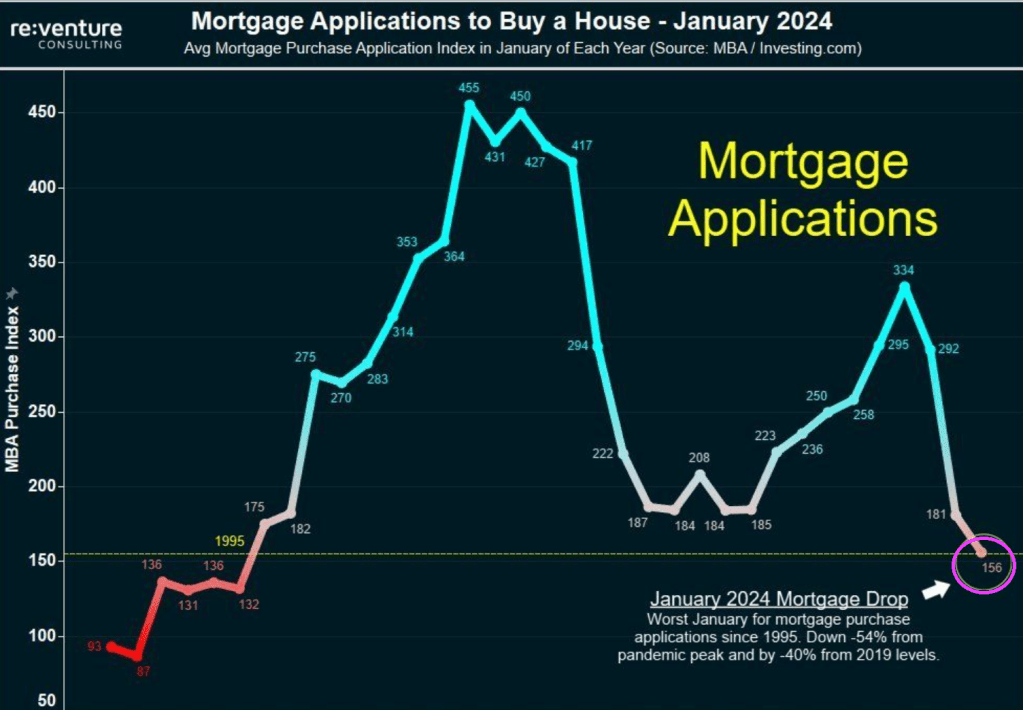
Yikes! Bidenomics is a disaster! MBA mortgage purchase applications are down 54% from Pandemic Peak. I was going to play “The Wreck of the Edmund Fitzgerald” by Gordon Lightfoot and rename it “The Wreck of The US Economy.”
Mortgage demand fell to a new 30-year low in January 2024, down 54% from the pandemic peak. Mortgage demand is down 14% over the last year and 40% from pre-pandemic levels.
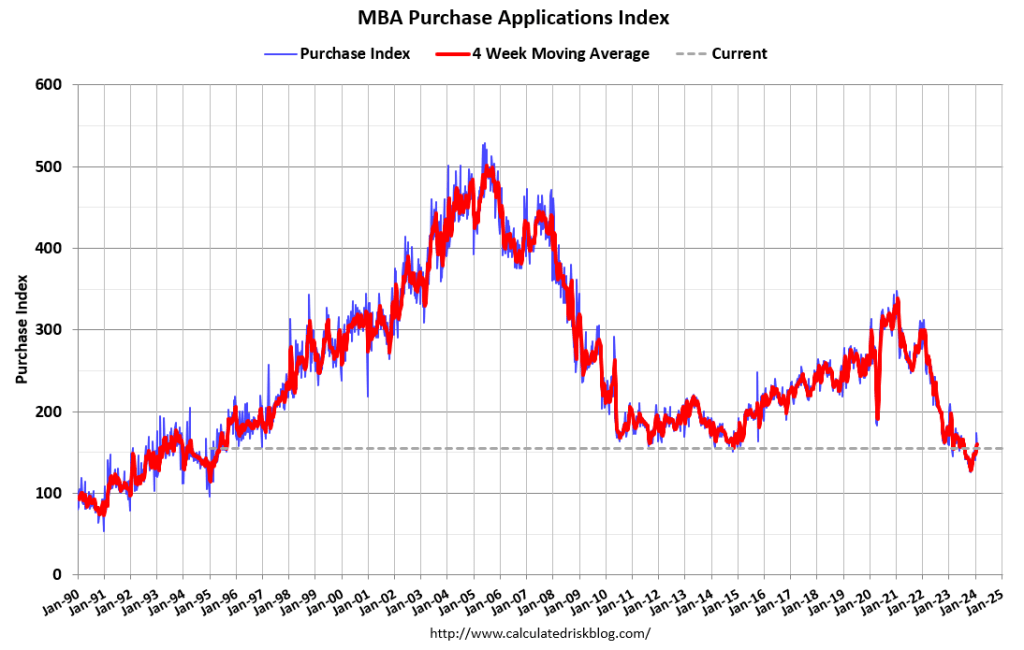
Mortgage applications decreased 7.2 percent from one week earlier, according to data from the Mortgage Bankers Association’s (MBA) Weekly Mortgage Applications Survey for the week ending January 26, 2024. Last week’s results included an adjustment to account for the MLK holiday.
The Market Composite Index, a measure of mortgage loan application volume, decreased 7.2 percent on a seasonally adjusted basis from one week earlier. On an unadjusted basis, the Index increased 8 percent compared with the previous week. The Refinance Index increased 2 percent from the previous week and was 3 percent higher than the same week one year ago. The seasonally adjusted Purchase Index decreased 11 percent from one week earlier. The unadjusted Purchase Index increased 6 percent compared with the previous week and was 20 percent lower than the same week one year ago.
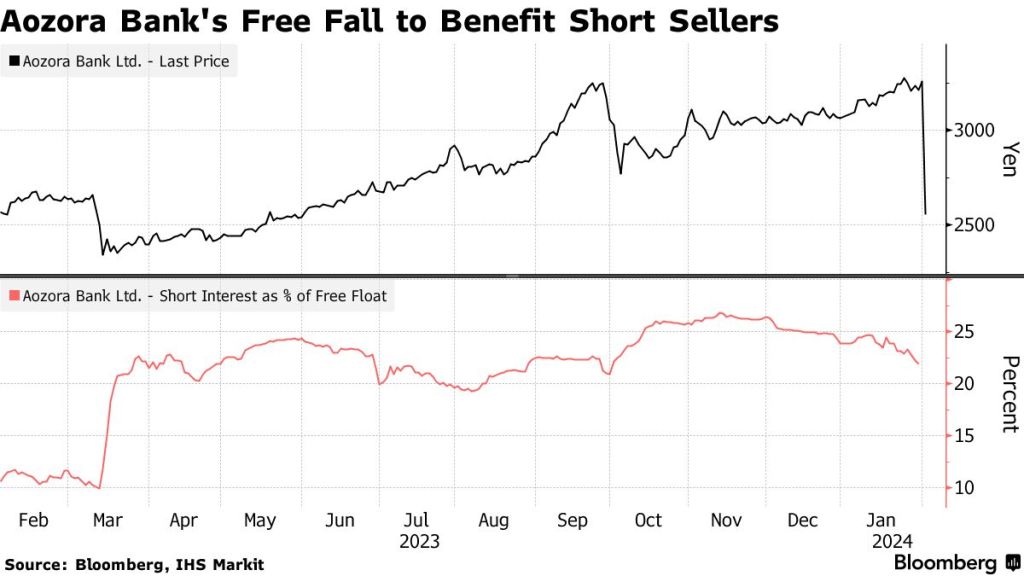
Like rows of falling dominoes, Aozora Bank, the 16th largest in Japan by market value, saw its shares plunge by 20% on Thursday after reporting a net loss of 28 billion yen ($191 million) for the fiscal year. This was in stark contrast to its earlier projection of a 24 billion yen profit.
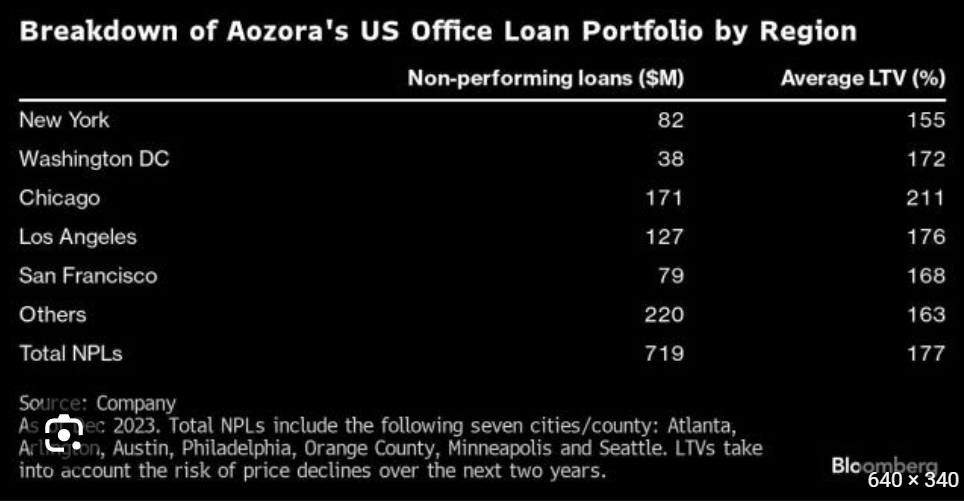
Aozora wrote down the value of its non-performing office loans by 58%, including a 63% reduction in Chicago and between 51% and 59% in New York, Washington D.C., Los Angeles, and San Francisco – all of these cities are plagued with violent crime and controlled by radical Democrats.
In total, the bank’s US office loans were about 6.6% of its portfolio, or approximately $1.89 billion. It said 21 office loans worth $719 million were classified as non-performing, and as a result it increased its loan-loss reserve ratio on US offices to 18.8% from 9.1%.
“It’s a shock,” said Tomoichiro Kubota, a senior market analyst at Matsui Securities Co., adding, “The expectation was the worst was over and that the bank had set aside enough provisions.” Guess not.
Far markets, this was another flashing red warning sign that not only is a tsunami of office loan defaults still on the horizon, but that banks continue to be woefully underprovisioned for the coming bloodbath.
“This is a huge issue that the market has to reckon with,” said Harold Bordwin, a principal at Keen-Summit Capital Partners LLC in New York, specializing in renegotiating distressed properties.
Bordwin said, “Banks’ balance sheets aren’t accounting for the fact that there’s lots of real estate on there that’s not going to pay off at maturity.”
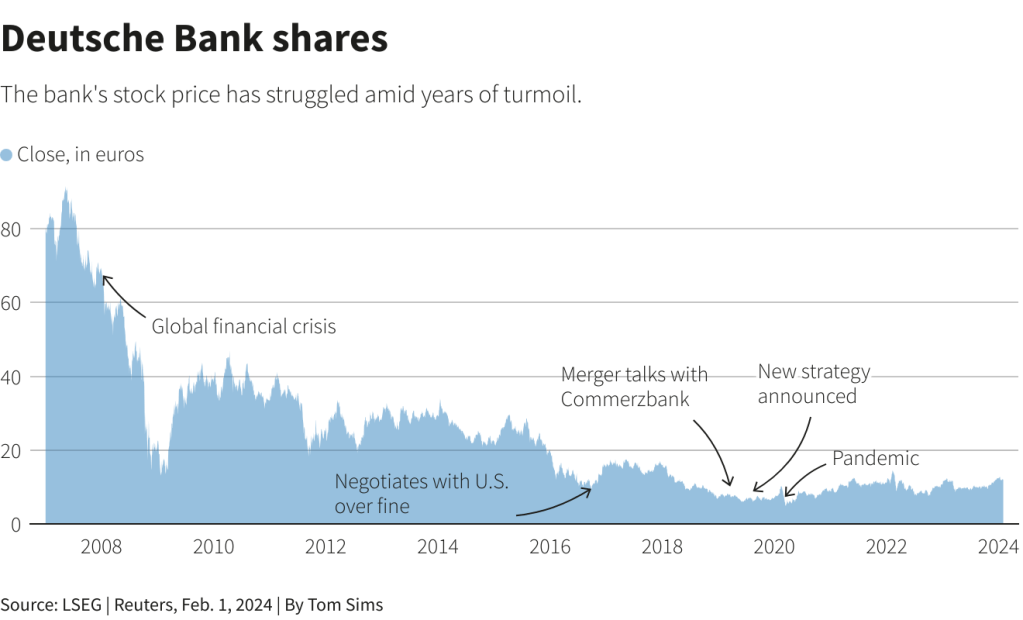
Besides New York Community Bancorp and Aozora Bank, Deutsche Bank noted in fourth-quarter results:
“Interest rate environment remains key driver for refinancing risk and potential [credit-loss provisions] in 2024 especially in office, with further drivers being ongoing sponsor support and expiring rental agreements.”
Fed chair Powell delivered bad news for the CRE world in yesterday’s FOMC meeting, warning that a March rate cut isn’t happening (absent a shock of course). Perhaps most notably, the Fed removed the following sentence from the FOMC statement: “The US banking system is sound and resilient.” Cynics asked why the Fed no longer sees “the US banking system is sound and resilient” – is it a signal of rumblings in the economy near-term, or was it just a lie before, and now that bank dominoes are again falling, will Powell be forced to trot it back out?
Where will this lead? Likely more bank and pension fund bailouts. You didn’t really believe that hype about the Dodd-Frank banking legislation that there will never be another bank bailout did, you??
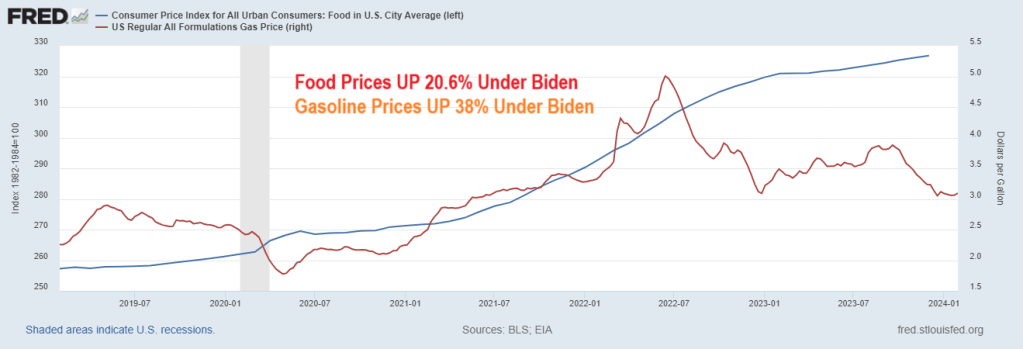
Treasury Secretary Janet Yellen just admitted what the rest of Americans already knew: high prices are here to stay. Example? Food prices (CPI) are up over 20% under Inflation Joe while gasoline prices are up 38% under Clueless Joe.
On the housing front, the Case-Shiller National Home Price Index is up 33.2% under Biden. And Freddie Mac’s 3-year mortgage rate is up 154% under Biden’s leadership (c’mon man! Obama is pulling the strings on Puppet Joe).
For months officials in the Biden administration have falsely claimed prices on everyday goods and services were going down. In reality, they’re getting more expensive at a slower pace.
During a briefing at the White House last week, Press Secretary Karine Jean Pierre had trouble explaining complaints from Biden when he purchased a smoothie that cost $6.
“Last Friday, the president was at a coffee shop in Pennsylvania, and he seemed to be surprised that the smoothie was $6 and how expensive it was,” a reporter asked. “I’m curious. So is the president now realizing the costs that Americans are bearing?”
“So, look, when he went over to you all, to the press corps, he was having a good time, right? And offered, as you know, offered to buy them coffee,” Jean Pierre responded. “There was a big group there, and he made sure everyone got coffee and pastries. So I just want to make that really clear.”
That is wonderful, KJP! The White House Press Corps got free coffee and pastries! Yippee!!!
But the rest of us in America are suffering from Bidenomics and inflation. Like food prices having risen 21% under Biden, gasoline prices UP 38%, home prices UP 33.2% and mortgage rates UP 154%.
A Blackstone-owned Manhattan office tower with a $308 million mortgage is being marketed at a discounted rate of $150 million, representing a 50% reduction. The special servicer, Midland Loan Services, has enlisted Jones Lang LaSalle Inc. to facilitate the sale of the tower at 1740 Broadway. The bundled debt, included in a commercial mortgage-backed security, is marked with a 50% discount. In April, the tower was appraised at $175 million, a substantial 71% decline from its $605 million valuation in 2014 when the mortgage originated.
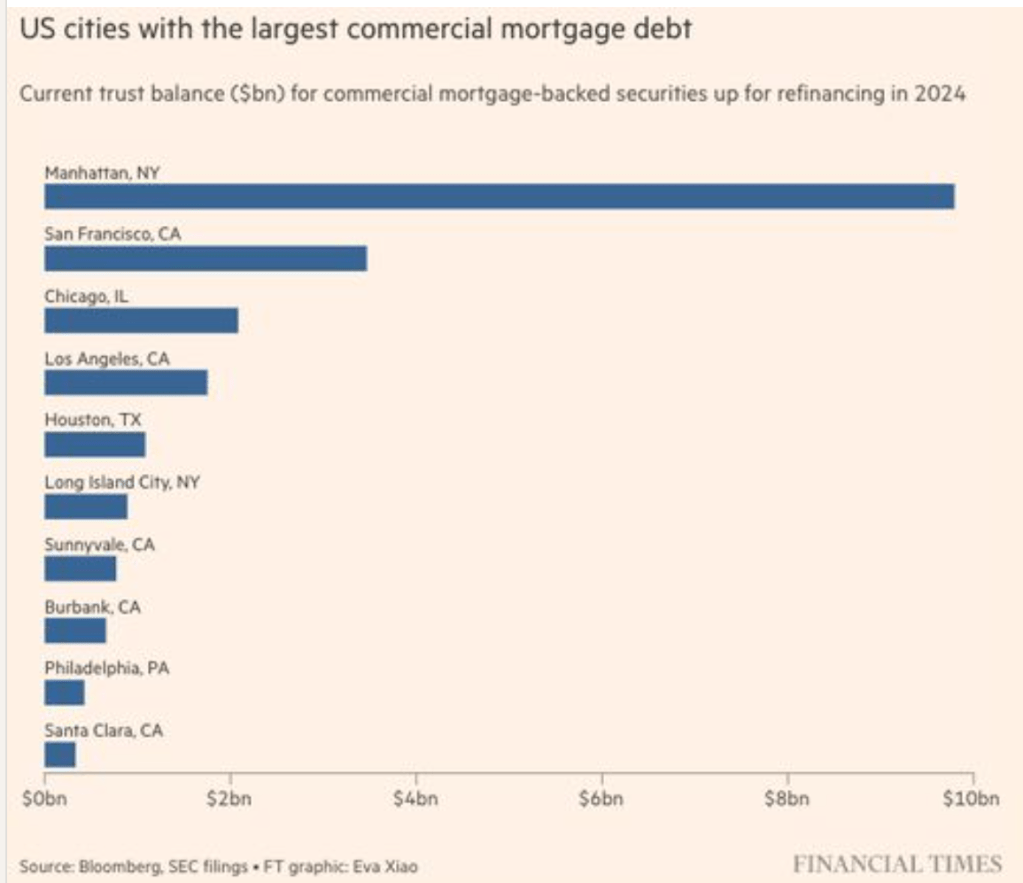
To put this into perspective, a new report by the Mortgage Bankers Association data, shows $117 billion in CRE office debt needs to be repaid or refinanced this year. Much of this debt is concentrated in major cities such as Manhattan, San Francisco, Chicago, and Los Angeles.
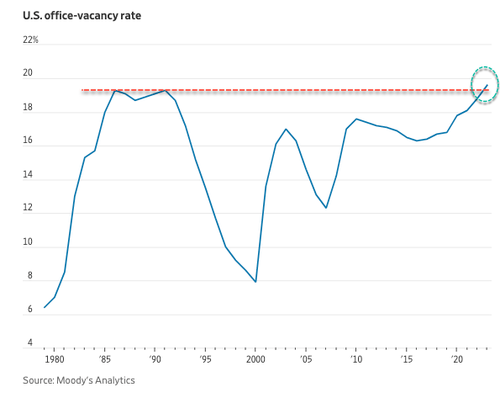
Compounding (or CONFOUNDING) the problem is the near 20% office vacancy rate.
Here is Fed Chair Jerome Powell who replaced now Treasury Secretary Janet Yellen.
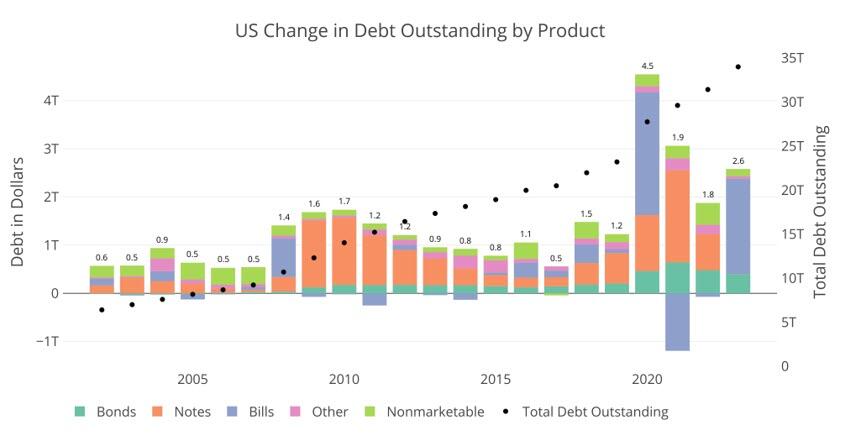
The only other times Bills were used as a primary funding source was in 2008 during the Great Financial Crisis and 2020 during Covid. Neither year came close to 77% of total new debt issuance. These were also emergency times, and specifically in 2021, almost half the short-term debt was retired in favor of Notes and Bonds to undo the 2020 Bill issuance.
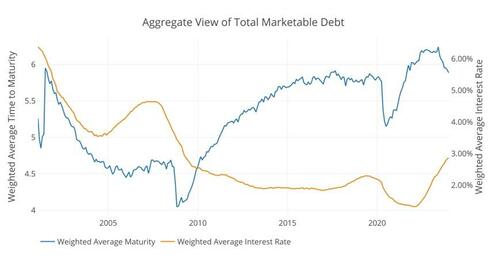
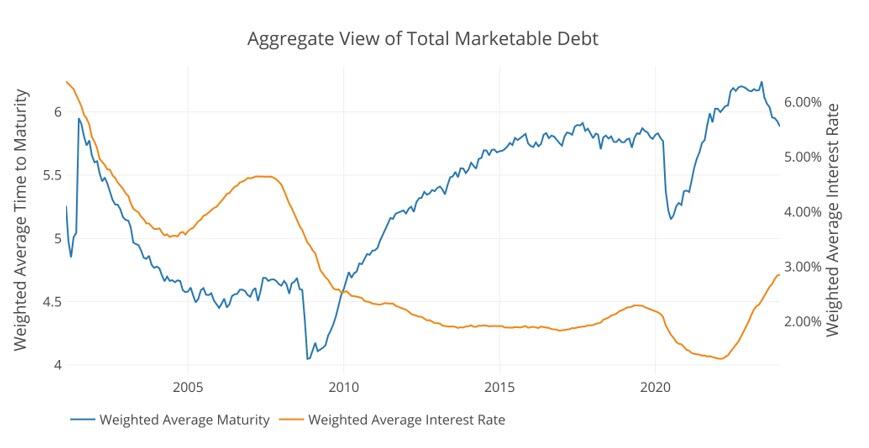
The Treasury has spent nearly two decades trying to extend the maturity of the debt. This can be seen in the blue line below that shows the average debt maturity. When the short term debt is issued in such a way, it drives down the average maturity, which causes the Treasury to have to roll-over more debt in shorter time periods. So why has the Treasury all of a sudden gone entirely to short-term debt in non-emergency times? The answer lies in the orange line, so let’s dig in.
Figure: 2 Weighted Averages
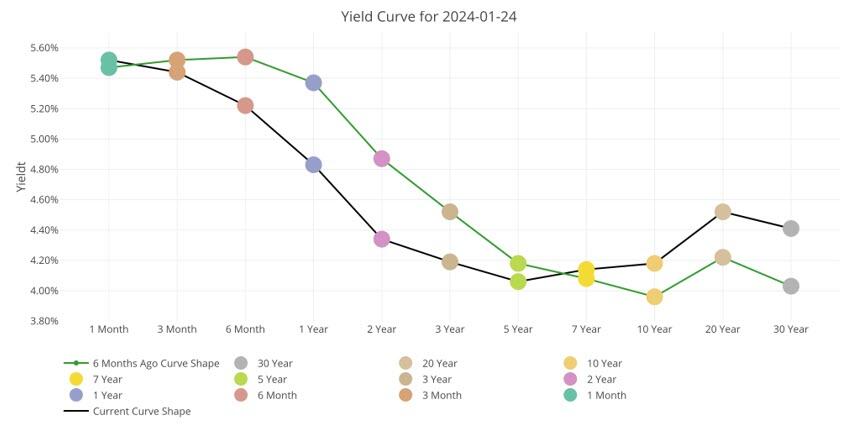
First, it is important to understand the interest rates the Treasury is facing. The chart below shows the current yield curve as it stands today and 6 months ago. As you can see, short-term rates are a full 1%-1.5% higher than medium-term. What?!? Didn’t we just see that the Treasury has specifically targeted short-term debt?
Why are they paying more than they have to? Had the Treasury financed the $2T with Notes, they would have saved $30B in interest this year alone!
Figure: 3 Tracking Yield Curve Inversion
So, why have they done this? Well, there are two potential possibilities.
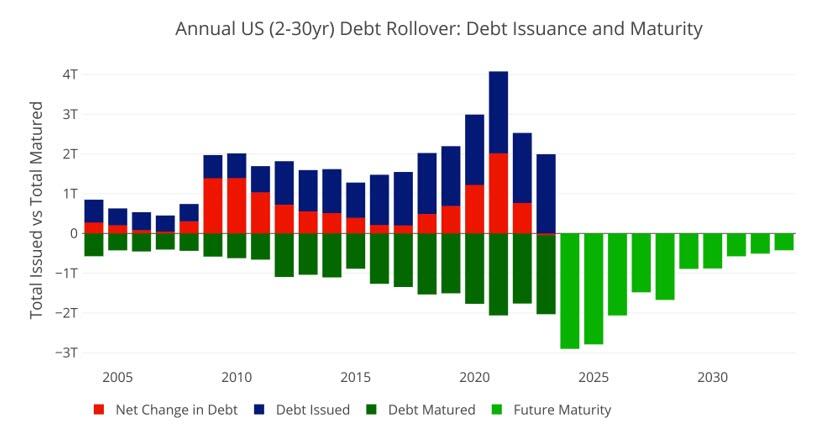
First, they may be nervous about the market’s ability to handle so much medium-term debt. The market typically digests short-term debt very easily, but it can become saturated with medium-term debt. The chart below shows the amount of medium-term debt that rolled over last year. This is not new issuance; this is debt maturing that needs to be rolled over.
As shown, nearly $2T rolled over last year. This means, had the Treasury issued Notes instead of Bills, the Market would have had to absorb a whopping $4T in new medium-term debt like they did in 2020. The difference this year is that back in 2020 the Fed bought nearly all of that debt, putting a floor under the market.
Compounding this problem further is that this year is set to be a record year in terms of debt rollover. Nearly $2.9T in Notes need to be rolled over.
Figure: 4 Treasury Rollover
Still, even with that massive amount of debt issuance, there must be more to the story. Why would Yellen specifically pay $30B more in interest just because she is concerned the about the volume of debt issuance. As Figure 1 above shows, this has never been a concern in the past except in emergency situations. Furthermore, why not issue at least some new debt as medium-term.
This lends to a second, and more probable conclusion. Long-term rates are set to fall in the very near term. The Treasury did not want to lock in for 2-7 years at 4% if it knows rates will fall. It will pay a premium ($30B this year), if it means it can lock in lower rates for longer and save the money on the back end.
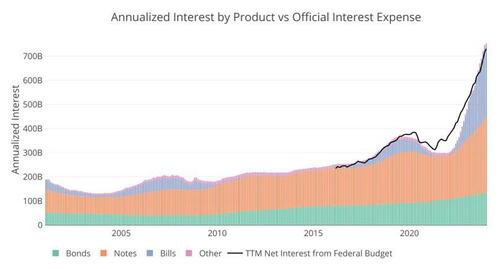
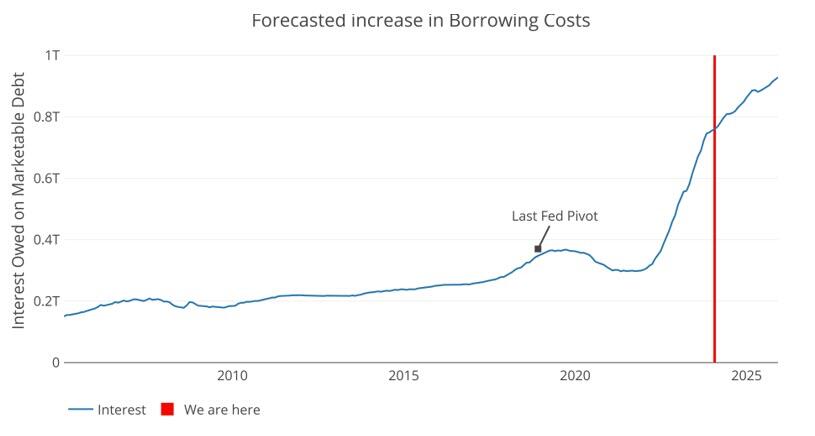
So, why are long-term rates, going to fall? Because they have to… the chart below shows the current interest owed on the national debt annualized. It’s not a pretty picture, and you can see how the interest from Bills has absolutely ballooned.
Figure: 5 Net Interest Expense
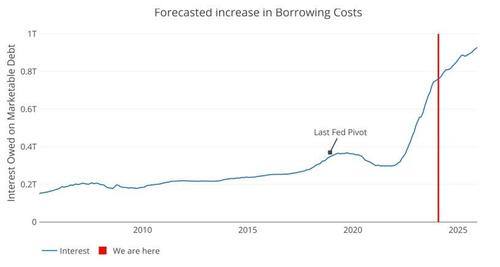
The Fed has come out with their dot plot that shows a calm glide path down. Well, we can take the debt maturity and push it forward at the projected rate of the Fed. Even given the current proposed 6 rate cuts, and getting back to 3.5% by early 2025, the trajectory for interest expense is not looking good.
Given current projections by the Fed, the Treasury will owe over $900B on interest by 2025. That is a debt death spiral. The Fed had to pivot back in 2018 when interest expense neared $400B. Next year, the cost will be more than double that!
Figure: 6 Projected Net Interest Expense
There is a potential third option. It’s an election year. Maybe Yellen is doing everything and anything to keep the financial system running smoothly. She has decided that the Treasury market must remain 100% stable and wants to take no chances. Thus, she issues tons of short-term debt, costing the tax payer an extra $30B this year and decides it’s a problem to be fixed at a later date.
While this would be wildly irresponsible and corrupt, the real argument against possibility 3 is the same as possibility 1, the market should be able to ingest at least some medium-term debt. This means the only logical conclusion is that she knows rates are coming down hard and fast. How does she know? Well, she used to be the head of the Fed.
There is no doubt, everyone in Washington can do the simple math above and recognize the Fed cannot take a glide path down. The only option is for rates to come down. Yellen just bet $2T on that outcome.


You must be logged in to post a comment.