Alarm! US 10-year Treasury yields are soaring along with mortgage rates.
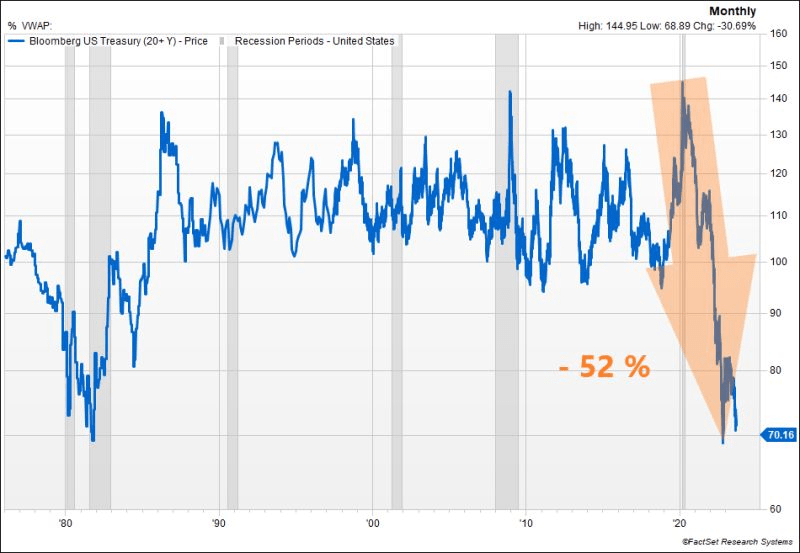
The US Treasury market is witnessing another significant selloff, pushing the 10y UST yield close to the 4.50% mark. The surge in real rates is remarkable, reaching 2.12% for the 10y, a level not seen since 08’. While this might appear attractive in real terms compared to historical benchmarks, could we be on the brink of a third consecutive year of negative performance for US Treasuries? To put this into perspective, such a scenario has never occurred in history.
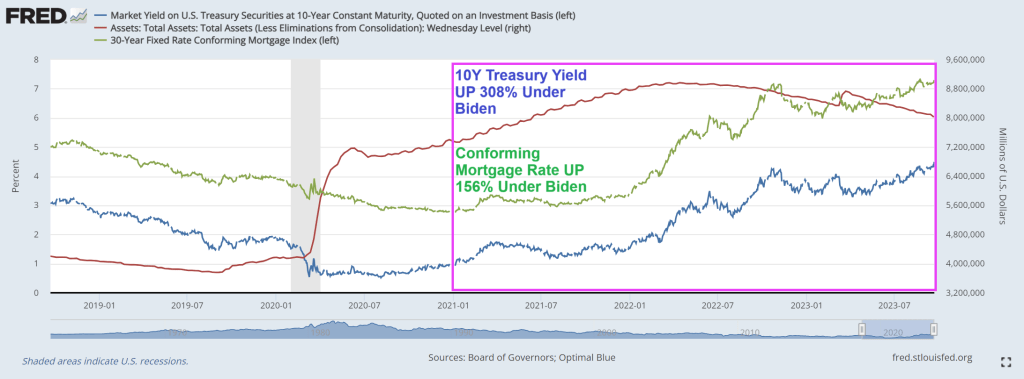
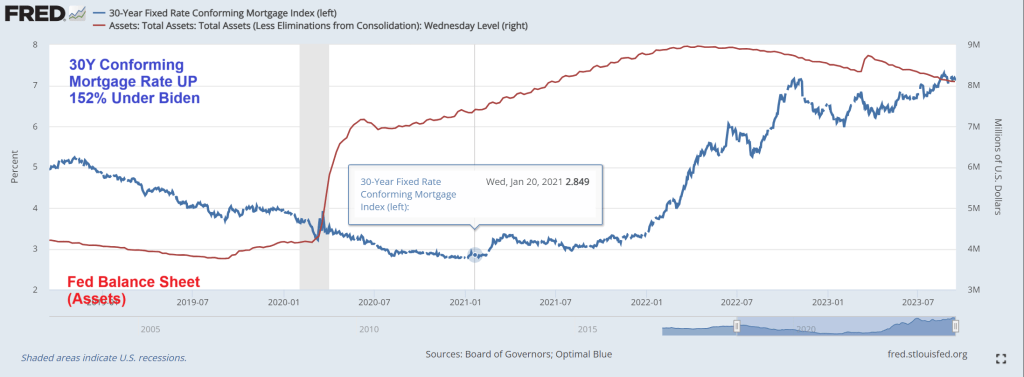
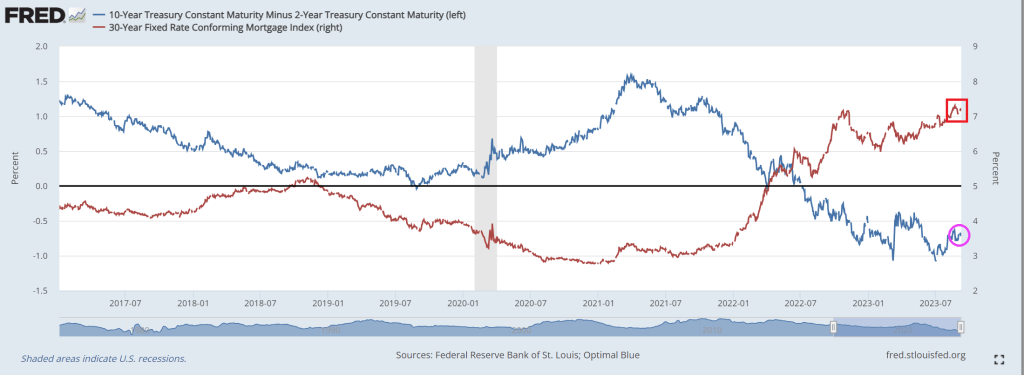
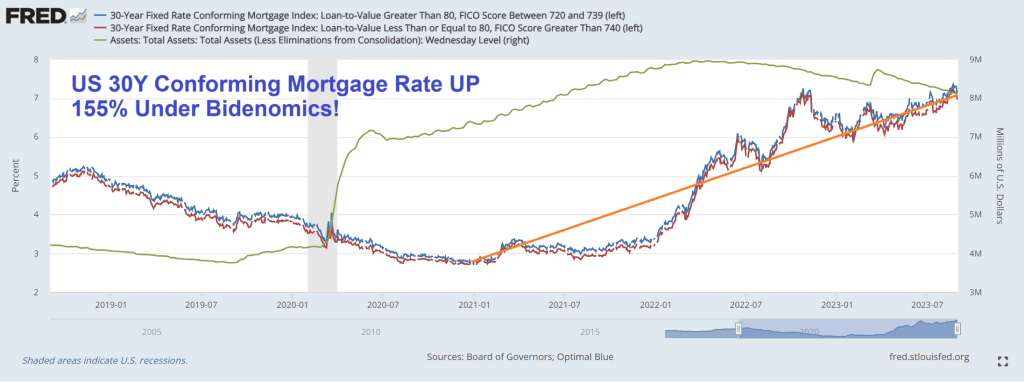
The conforming mortgage rate is at 7.3%, up 156% under since Biden’s coronation as El Presidente of the United Banana Republics of America. Where political opponents are indicted prior to elections.
In Biden’s Banana Republic economy, the US Treasury 10y-2y yield curve remains inverted.
And then we have Mish’s chart on debt as a percentage of GDP from CBO. Remember, we used to worry about the US breaking the 80% debt to GDP level. It is now projected to be 181%. Wow.
Is The Fed pushin’ too hard on rates to fight inflation? Or not hard enough??
Between the data and the overnight momentum in overseas markets, bonds are at their weakest levels in years. Mortgage-backed securities (the bonds that dictate mortgage rates) didn’t swoon quite as much as Treasuries, but as of today, it was just enough to push the average mortgage lender almost perfectly back in line with the highest 30yr fixed rate of the past 23 years. [30 year fixed 7.47%]
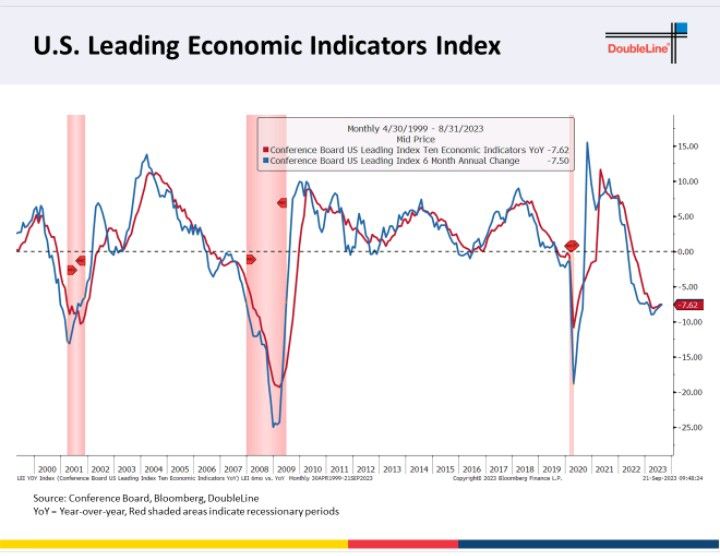
Conference Board Leading Economic Indicator declined -0.4%MoM in August, bringing the year-over-year change to -7.6%.
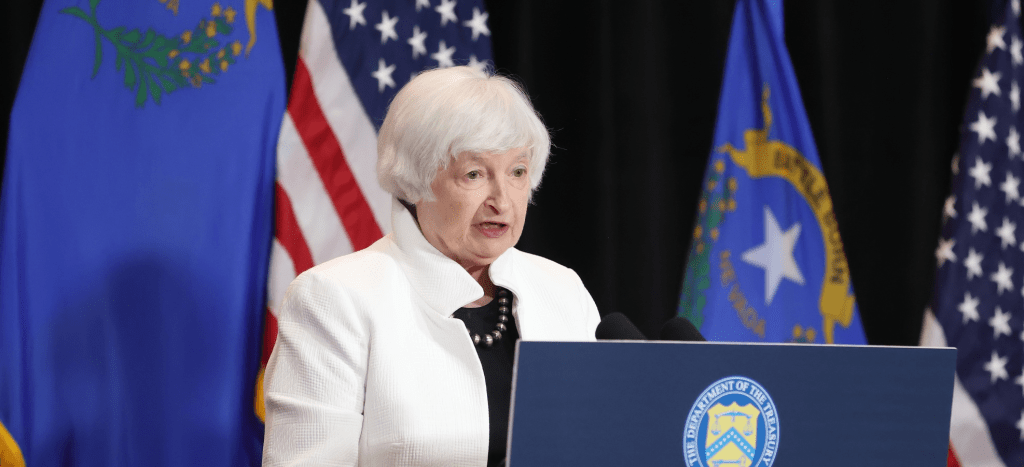
The Fed can’t seem to make inflation go away, despite what Janet Yellen says. The reason? While The Fed’s target rate has risen rapidly over the past year and a half, The Fed’s Balance Sheet is slowwwwwllyyyyyyyyyyyyyy unwinding.
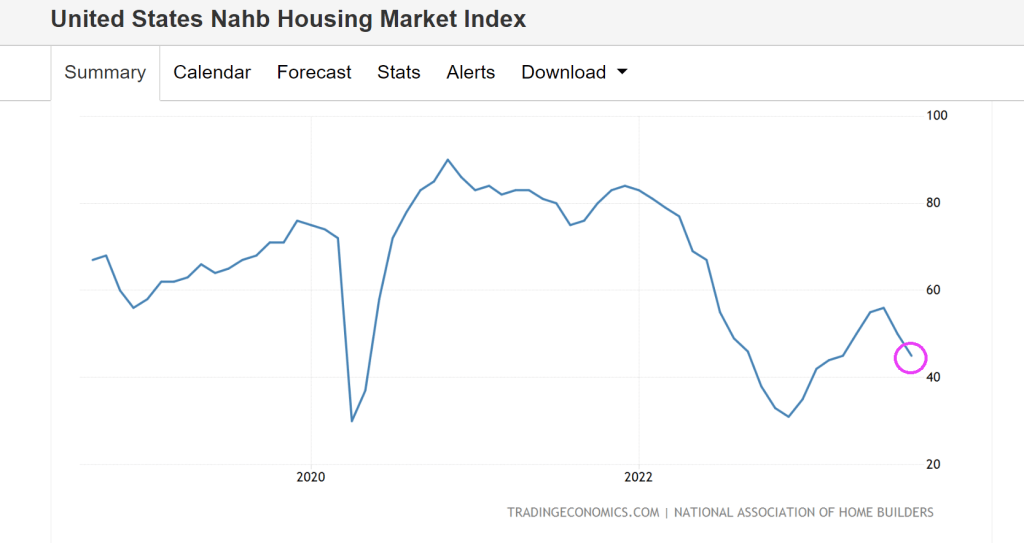
U.S. homebuilders are feeling pessimistic about their business for the first time in seven months, thanks to stubbornly high mortgage rates.
Builder confidence in the single-family housing market fell 5 points in September to 45 on the National Association of Home Builders/Wells Fargo Housing Market Index. The decrease follows a 6-point drop in August. Anything below 50 is considered negative.
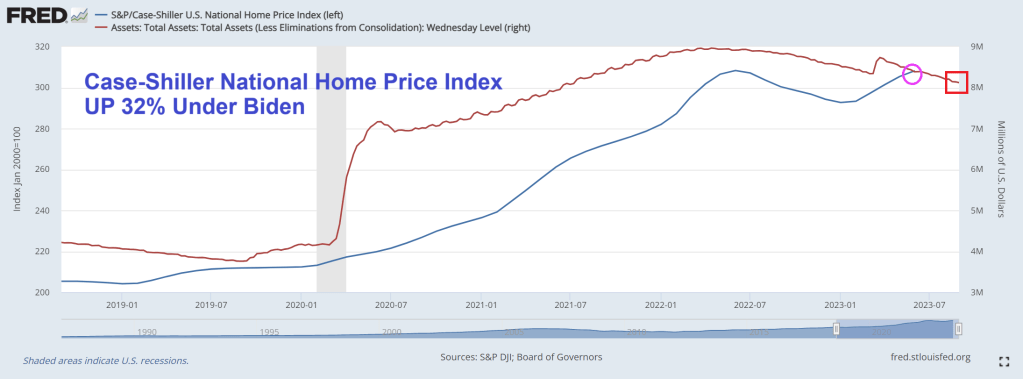
Mortgage rates are up 152% under Biden’s Reign of Economic Error. Note the big assist the economy got from Covid-related Fed stimulus (red line). The Fed’s balance sheet is still over $8 trillion.
Shape of things in the US economy. But a better tune to descible what is happening is over, under, sideways down.
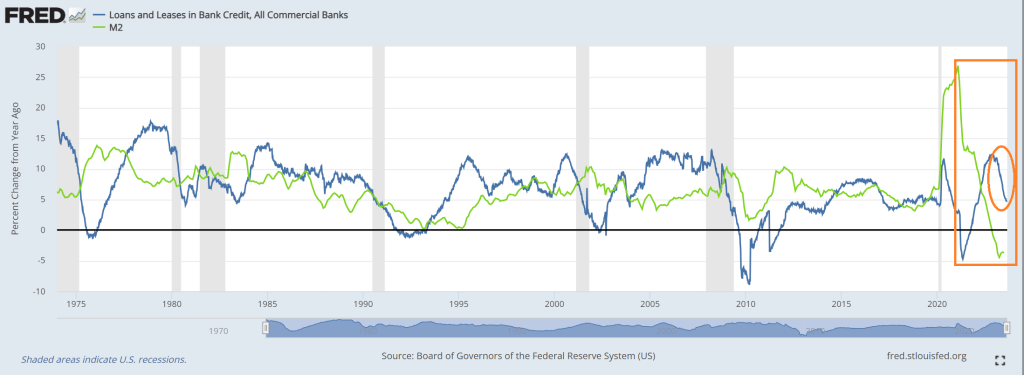
For example, look at this chart of loans and leases at commercial banks, since last year (YoY). The growth rate is plunging rapidly. Of course, M2 Money growth has already crashed.
Loan delinquenices? The trend in delinquencies is rising as consumers struggle with inflation.
When asked about future Fed policies, Powell angrily replied “I’m a man.” Just kidding, but that is almost as nonsensical as his other answers.
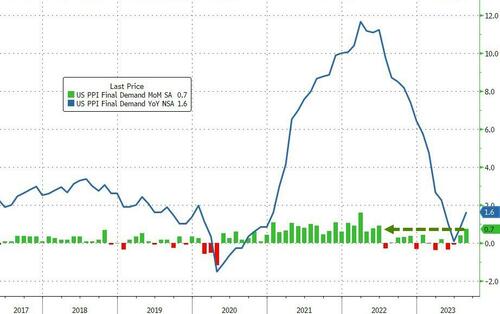
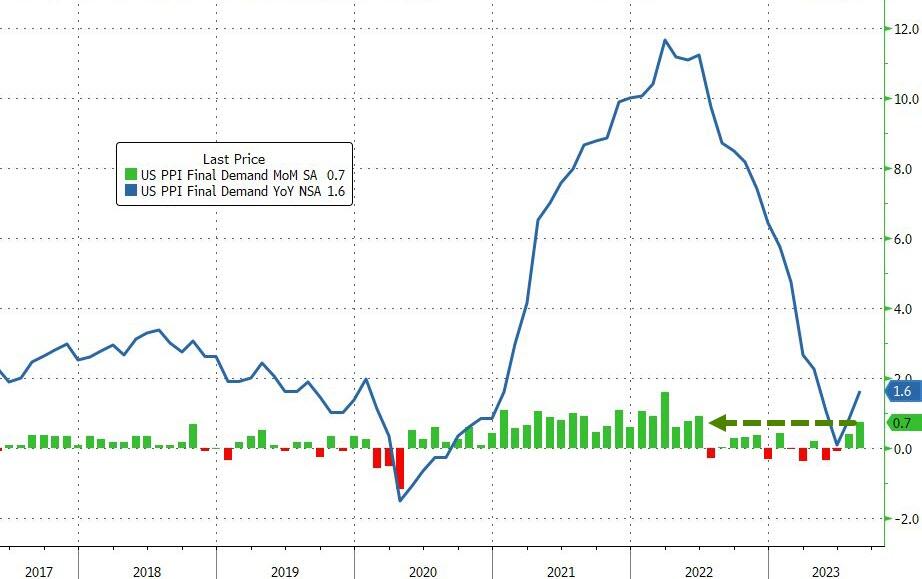
Producer Prices rose 0.7% MoM in August (up from +0.3% in July and hotter than the +0.4% exp). That is the hottest PPI since June 2022, and pushed YoY prices up 1.6%…
Source: Bloomberg
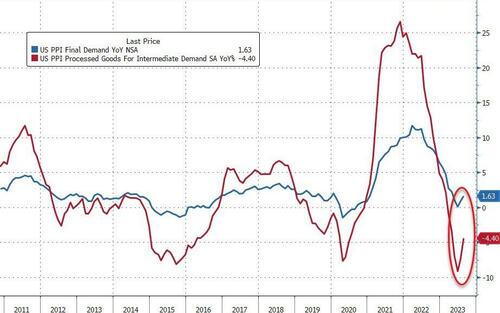
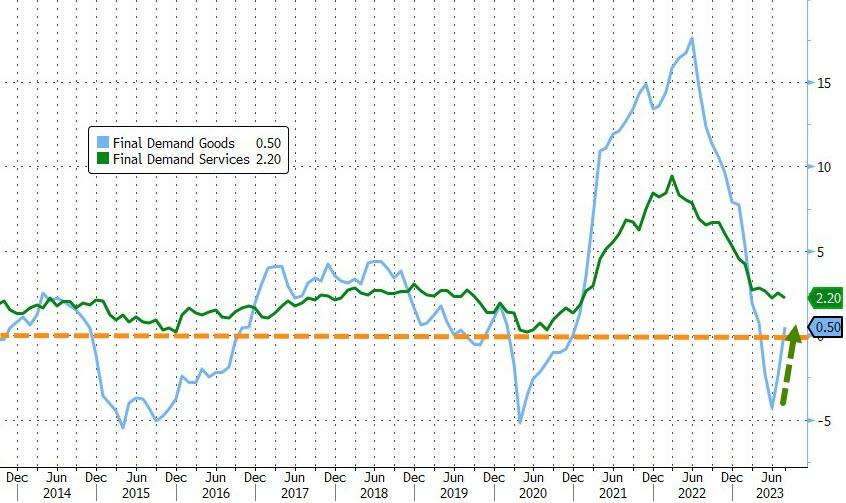
Goods prices are reaccelerating fast, now back into inflation YoY (as Services cost growth slowed only modestly)…
Source: Bloomberg
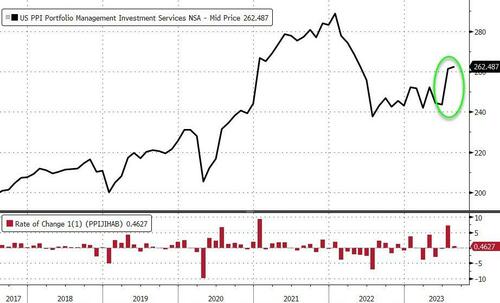
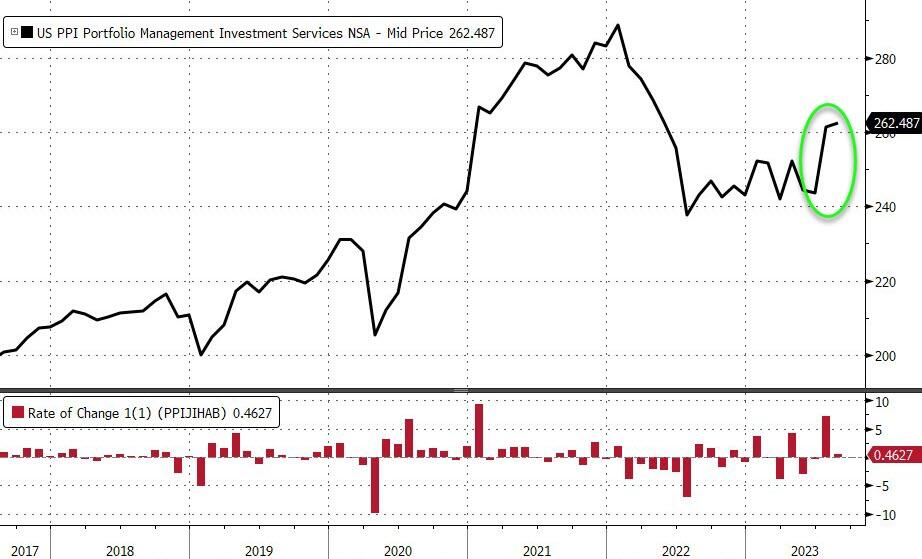
As a reminder, much of last month’s PPI rise was driven by a big jump in portfolio management costs – as stocks soared. August saw a further rise in those costs…
Source: Bloomberg
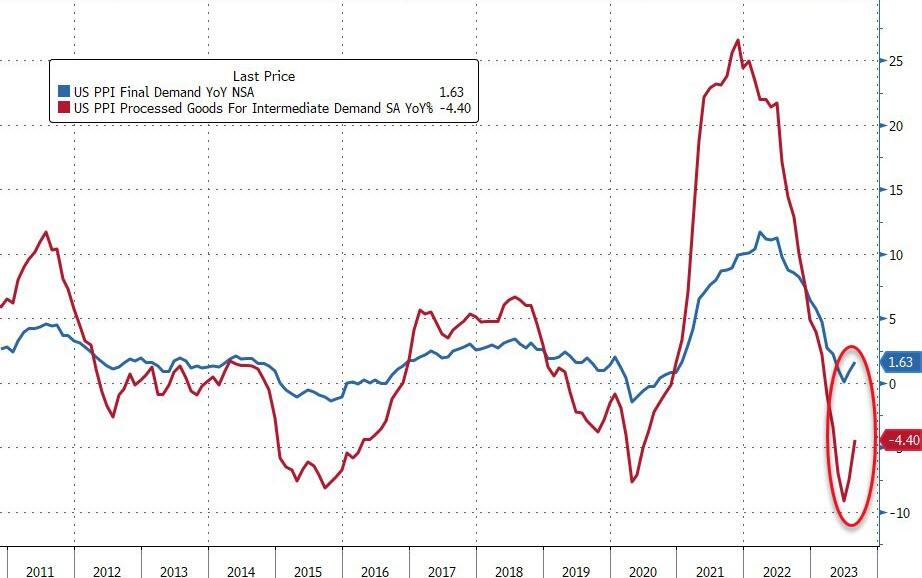
More problematically, the pipeline for PPI appears to have inflected as intermediate demand is re-accelerating…
But back in the USA (while Biden does his humiliate the US tour of Vietnam, India, etc, and ignores the tragedy of the 9/11 attacks), we see mortgage rates still up above 7% as the US Treasrury 10Y-2Y yield curve
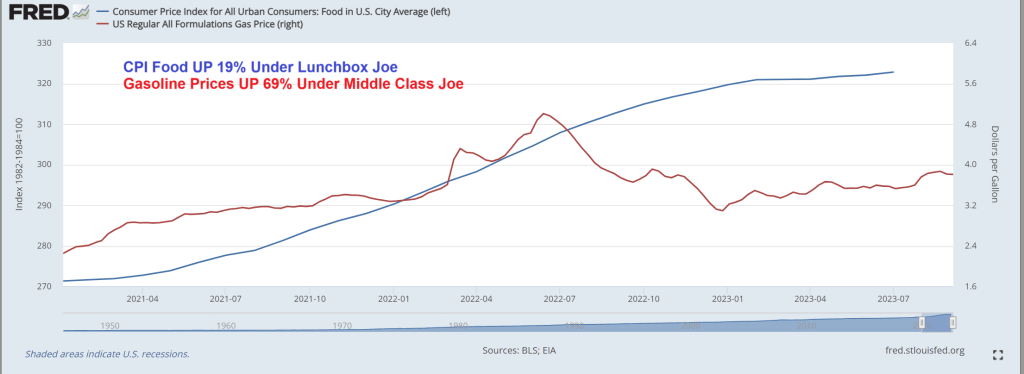
CPI food prices are up 19% under “Lunchbox Joe” and up 69% under “Green Joe”. True, the American middle class is far worse off under Bidenomics, but it is all about marketing Bidenomics at this point.
Of course, being a true RINO (Republican in name only), he won’t follow Biden around criticising him. Just critcising Trump. He is part of the Globalist Romney RINO Party (GRR).
Bidenomics is terrible! Just a huge payoff to be big donors (the donor class) for green energy, Big Pharma and Big Defense. Now Biden is considering using ankle monitors to prevent illegal immigrants from leaving Texas and traveling to welfare-friendly blue states like California and New York rather than just enforcing the border. The middle class is truly wasting away with Bidenomics.
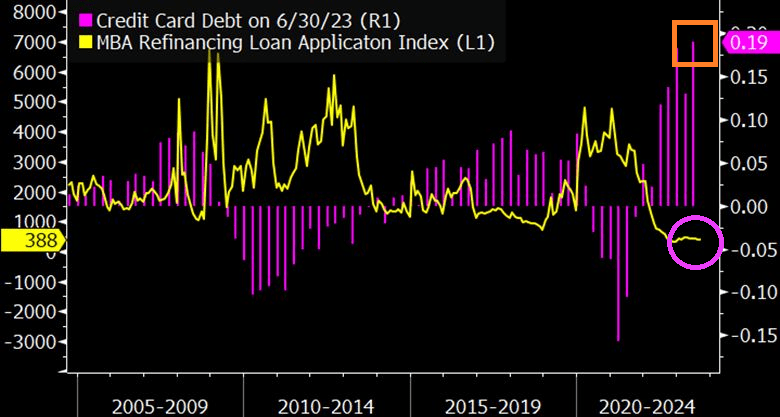
Let’s start with crashing mortgage refi demand as consumers load up on credit cards to afford rising prices thanks to Bidenomics.
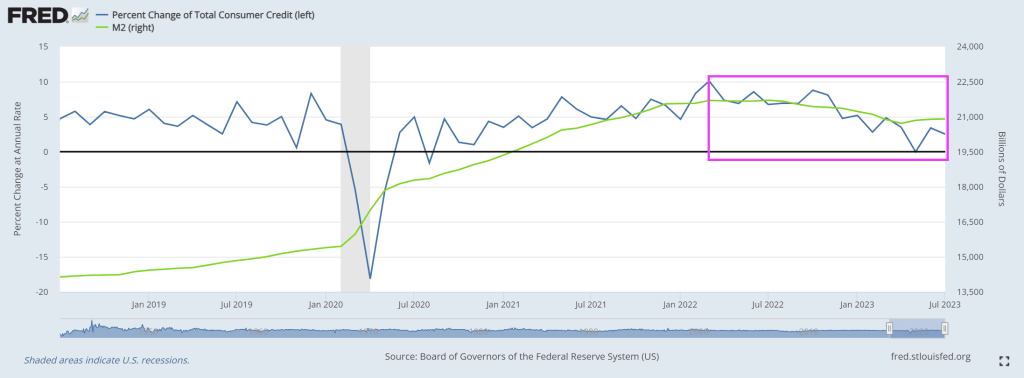
The Fed reports dramatically weakening consumer credit with negative revisions too.
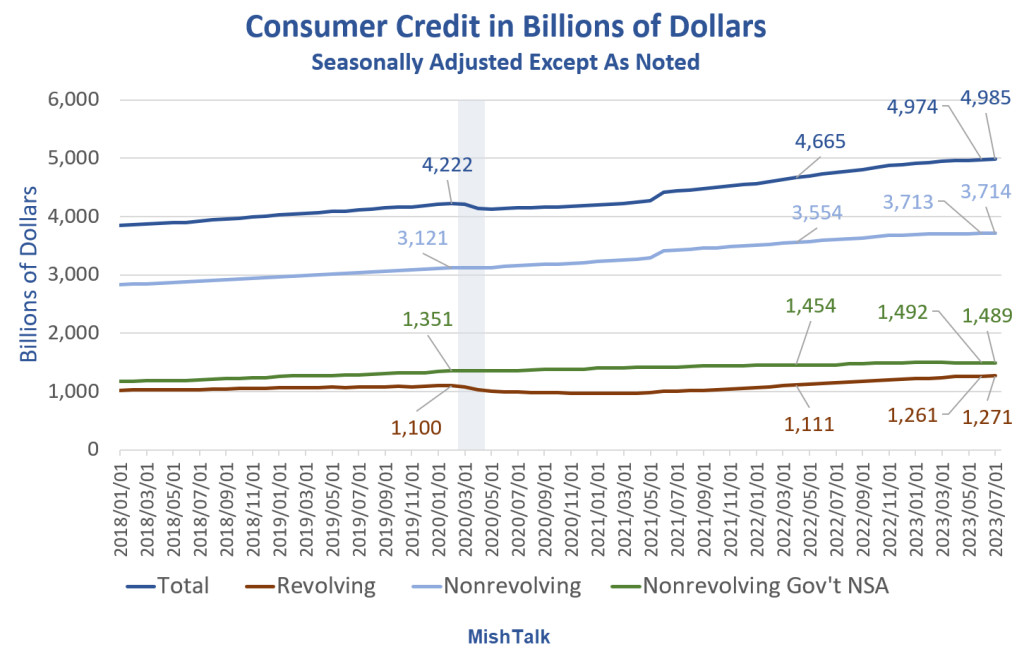
Consumer Credit data from the Fed, the last two months labeled are May and July, chart by Mish
Consumer Credit Report Revisions
Consumer Credit data from the Fed, chart by Mish
Revision Key Points
Most of the revisions are in nonrevolving, but that impacts the totals.
Nonrevolving credit rose $1 billion in July, from a negative $22 billion adjustment in June. The Fed revised a reported $3.735 trillion down to $3.713 trillion.
In turn, nonrevolving impacted the totals.
Total credit rose $11 billion in July, from a negative $23 billion adjustment in June. The Fed revised a reported $4.997 trillion in June down to $4.974 trillion.
Nonrevolving Consumer Credit in Billions of Dollars
Nonrevolving consumer credit data from the Fed, chart by Mish
Nonrevolving Credit Implications
Assuming the data is accurate (unlikely) or at least the revision direction is accurate (likely), mortgage and existing home sales data is suspect.
Real (inflation adjusted) nonrevolving credit peaked in June of 2021.
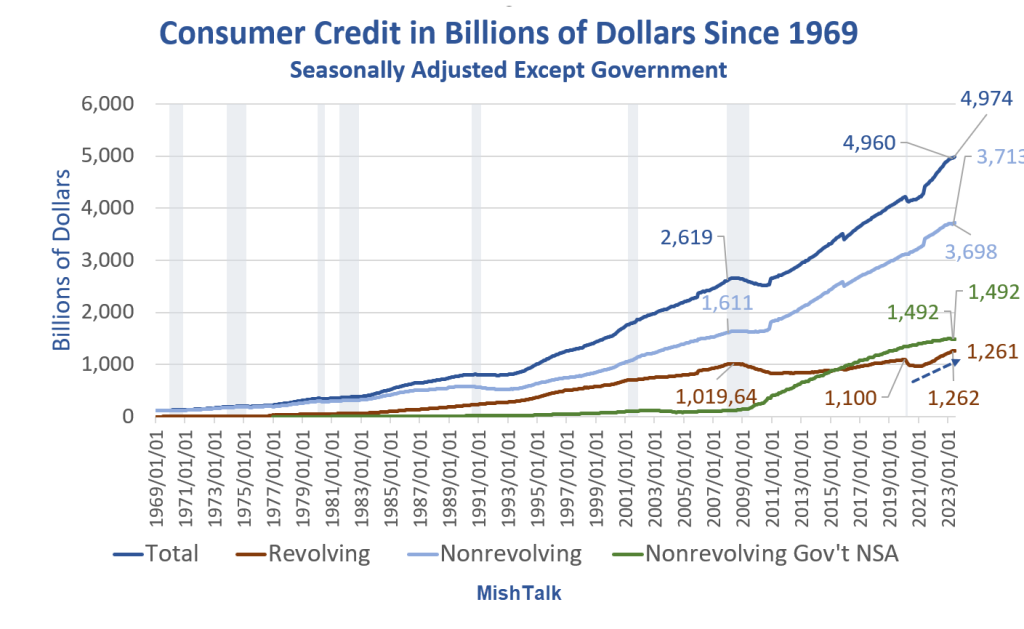
Consumer Credit in Billions of Dollars Since 1969
Consumer Credit data from the Fed, chart by Mish
Consumers have generally done a pretty good job of avoiding credit card debt thanks to three rounds of fiscal stimulus.
However, inflation kicked in and the stimulus money has been spent. The result is the steep rise in credit card debt as noted by the blue arrow. Let’s hone in on that.
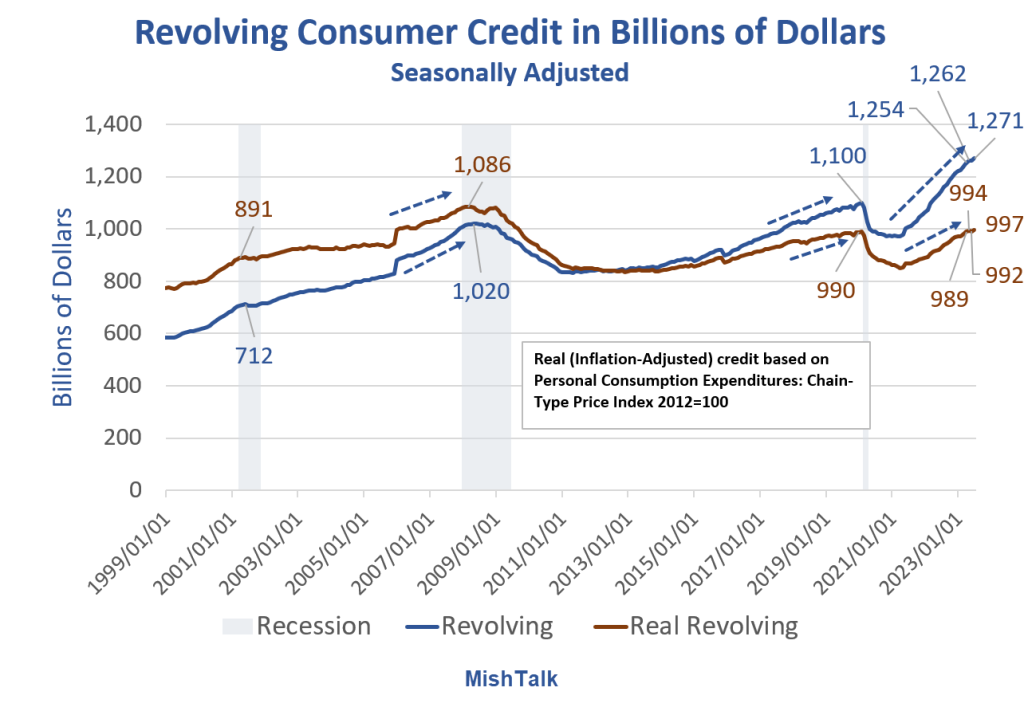
Revolving Consumer Credit in Billions of Dollars
Consumer Credit data from the Fed, Real (inflation adjusted calculation) and chart by Mish
Stunning Steepness in Credit Card Debt Accruals
The speed at which consumers are going into credit card debt is stunning.
It’s hard to maintain lifestyles with rising inflation unless wages keep up.
The BLS and Fed believe the rate of increase in inflation is falling. Assuming the data is correct, consumers are struggling anyway.
What Happens if Jobs Take a Dive?
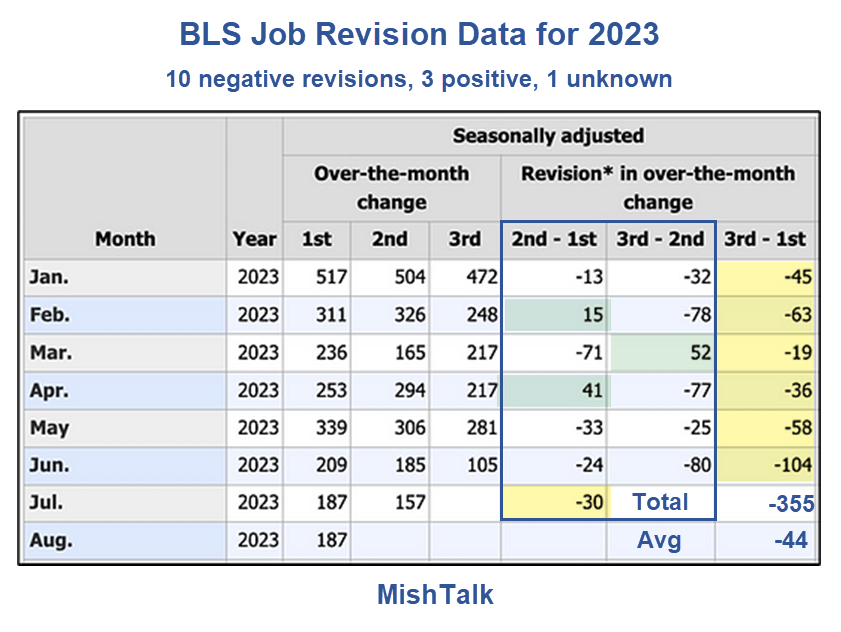
That’s actually the wrong question. Job revisions (there’s that word again) have been steeply negative.
BLS Job Revision Data from the Philadelphia Fed
Jobs are still positive, assuming (there’s that word again) you believe the numbers and more negative revisions (there’s that word again) are not in the works.
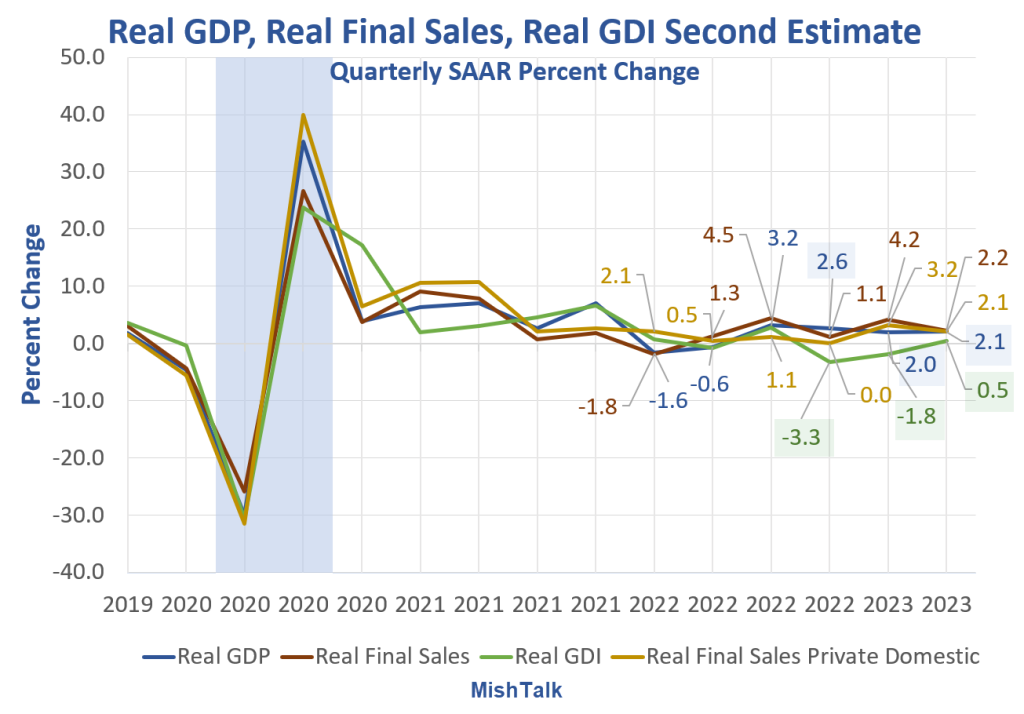
As long as you are making assumptions, if you are rah-rah on the strength of the Biden economy, you may as well assume GDP numbers are correct as well.
My assumption is GDP is flat out wrong and Gross Domestic Income (GDI) numbers are far more likely to be correct than GDP numbers. GDP and GDI are supposed to be the same but aren’t.
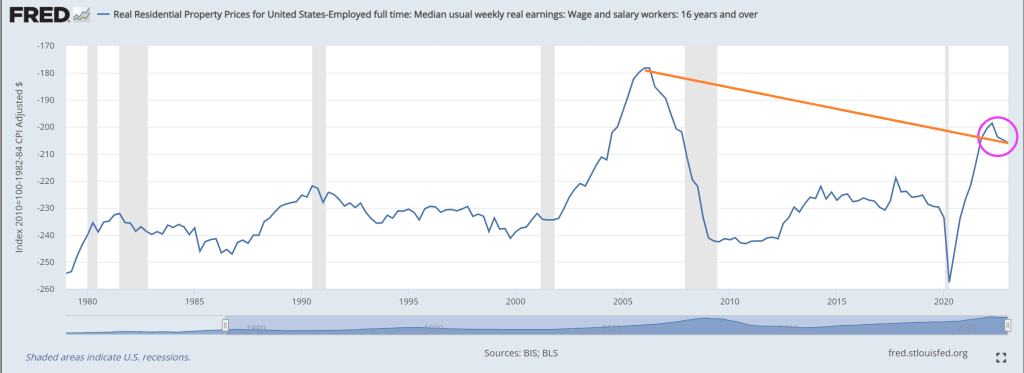
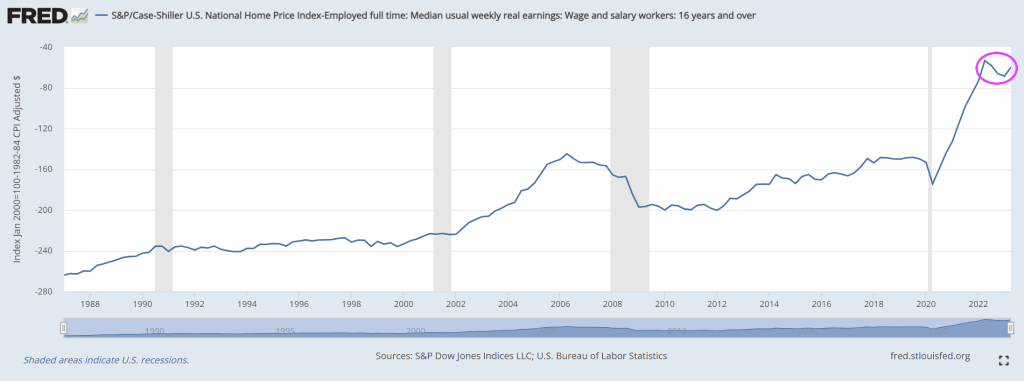
You know Bidenomics isn’t working at all when the best I can say about it is … the current housing bubble isn’t as bad as the house price bubble of 2006. We are truly in Biden’s ShamWow economy!
Yes, if I look at real home prices less real median earnings we can see that the ratio, while terrible, is still not as bad as the housing bubble of 2006.
If I look at Case-Shiller National home price index less REAL median earnings, it is now far worse than in 2006.
But home prices are still up 32% under Biden
While the 30-year conforming mortgage rate is up 155% under Vacation Joe.
It should be GREEN ShamWow!. The money seems to be disappearing into the pockets of green energy donors, and Ukraine.
Covid is the gift that keeps on giving … to lazy bureaucrats and teachers union members. And a horror for small businesses and students since small businesse go bankrupt and students suffer from lack of education. And now The Federal Government is fearmongering (hey, that’s all they do!) ANOTHER Covid outbreak with Deep State Joe Biden advocating for more Federal spending on vaccines and telling everyone to get yet ANOTHER vaccination. And wear useless masks as a sign of obidience to The Democrat Party.
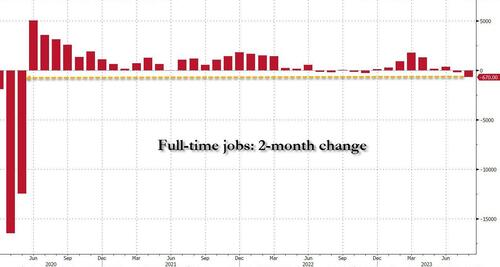
The Bureau of Labor Statistics (BLS) reported that in August the number of full-time jobs dropped again, sliding by 85K to 134.2 million, and followed the whopping 585K plunge in July which brings the two-month total drop in full-time jobs to a whopping 670K, the biggest 2-month plunge since the covid lockdowns in early 2020 when 12.5 million full-time jobs were lost in one month!
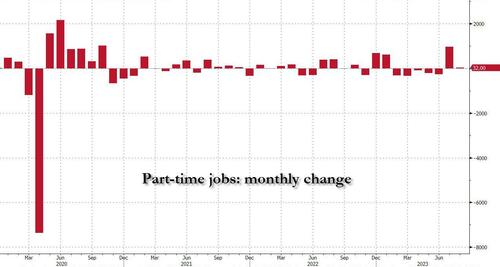
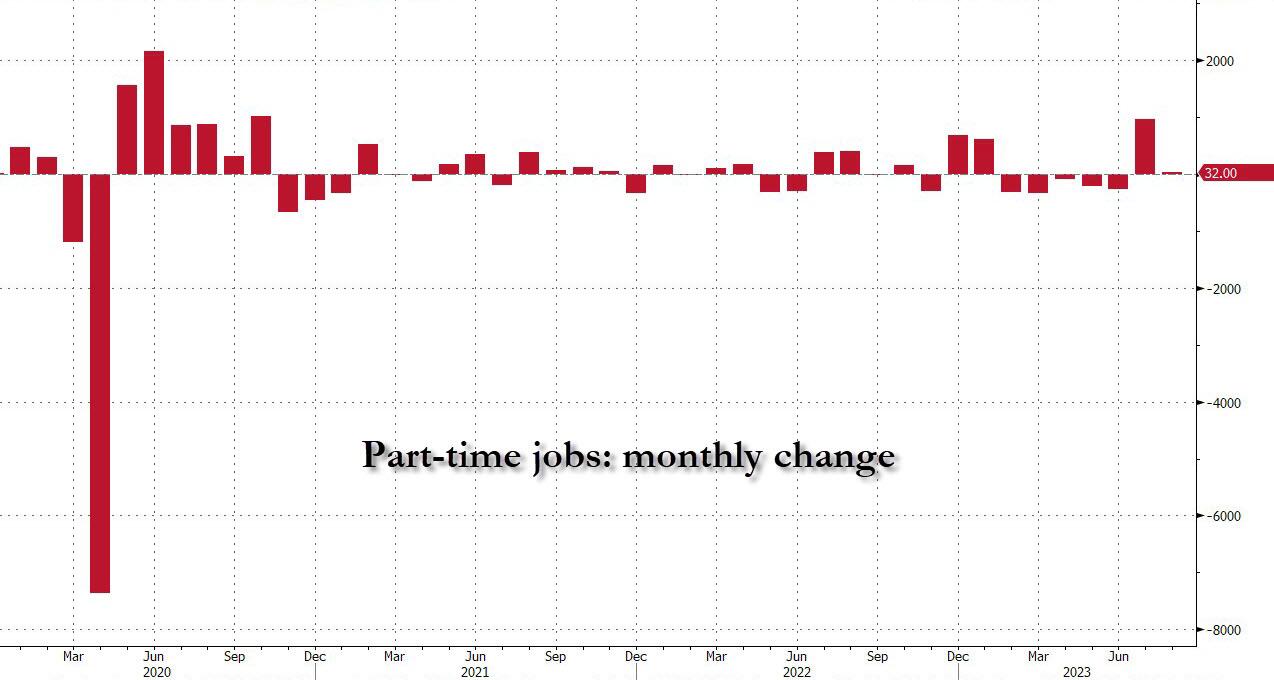
But if full-time jobs crashed how did the BLS get an increase of 222,000 employed workers? Simple: it was all in the latest jump of part-time workers. Indeed, in August the number of reported part-timers jumped by 32K and when added to the near-record 972K surge in July, the 2-month total was just over one million – 1,004,000 to be precise – to 27.185 million.
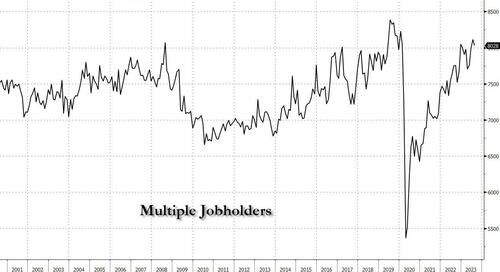
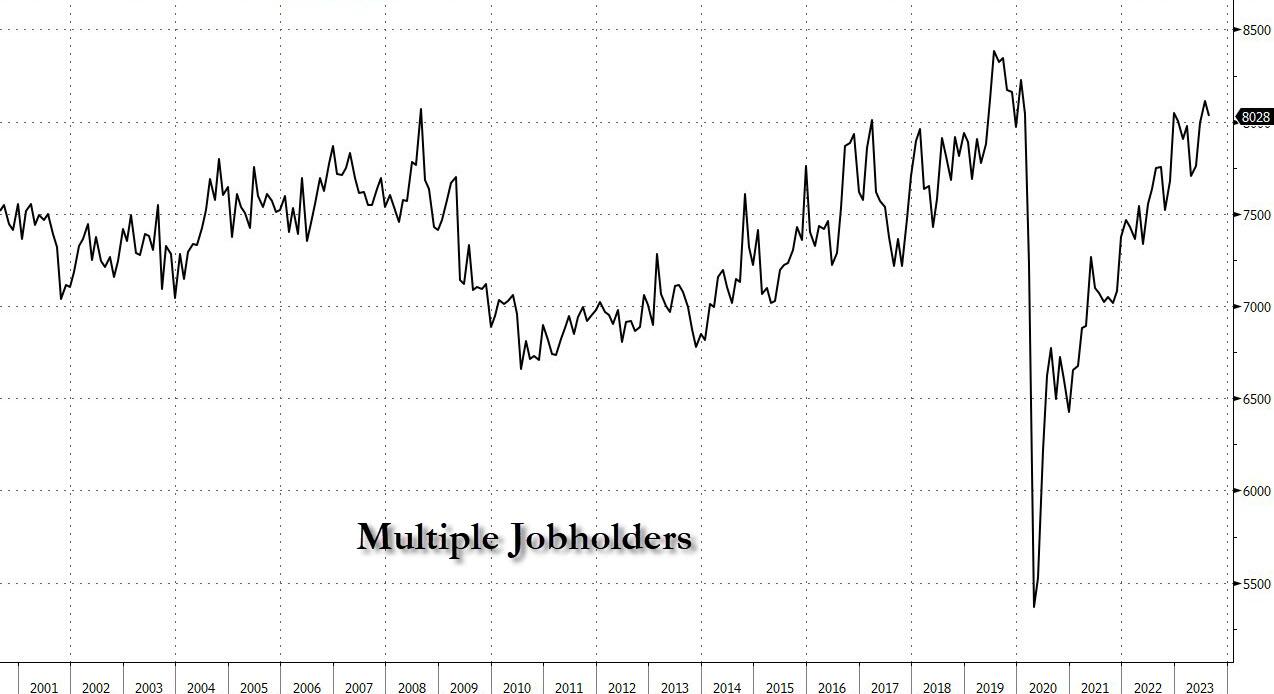
Going back to a quantitative read of the data, we look at the number of multiple jobholders – those workers who have to work more than one job at a time to make ends meet. In August this number was actually a modest silver lining, as it dropped by July, that number dropped by 85K to 8.028 million, but it remains just shy of the pre-covid record.
Given the extreme level of corruption in the Biden Administration, the Democrat Party should be renamed after New York’s Tammany Hall.
And require all people to wear a Tammany Hall fez instead of a mask.
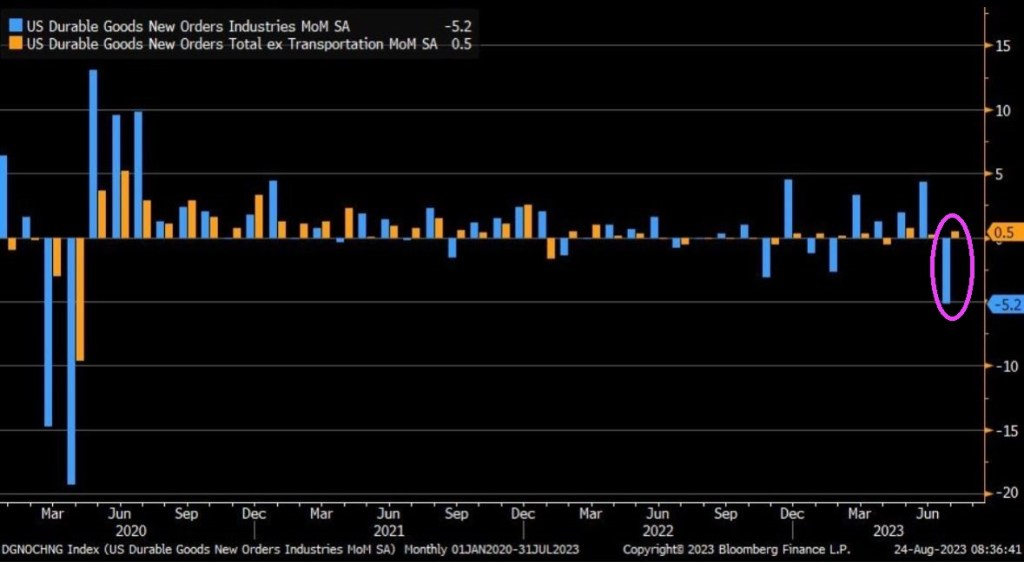
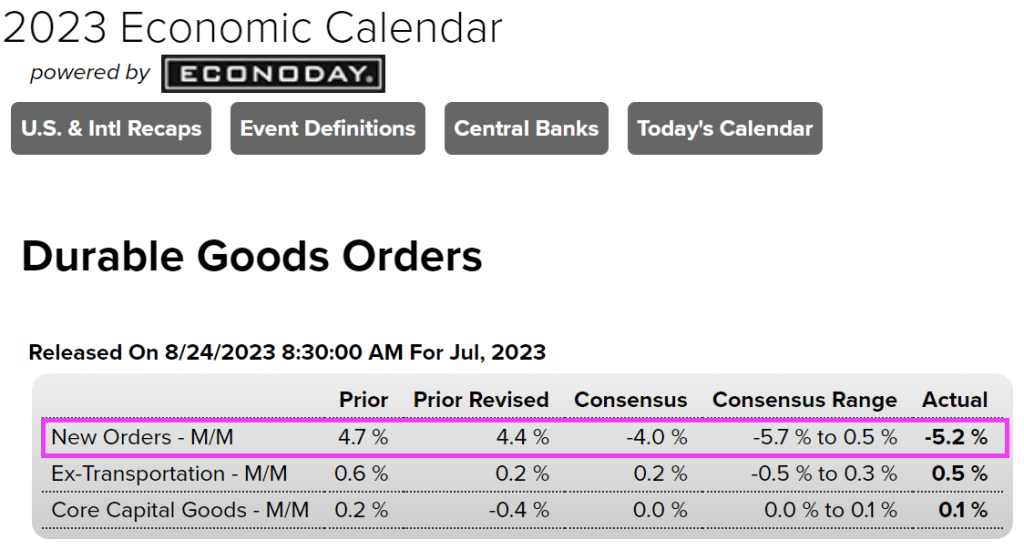
July durable goods [blue] new orders plummet, recording the worst month since C19 in April 2020. Durable goods fell on a MoM basis by -5.2%, versus -4% consensus estimate. Durable goods ex-transportation [orange] still rose on a MoM basis by +0.5%, perhaps highlighting the weakness in durable goods orders.
Ex-transportation, durable goods order rose slighlty in July by 0.5%.
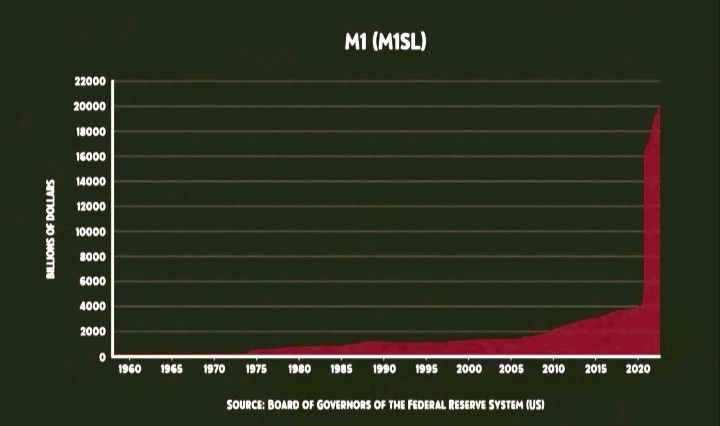
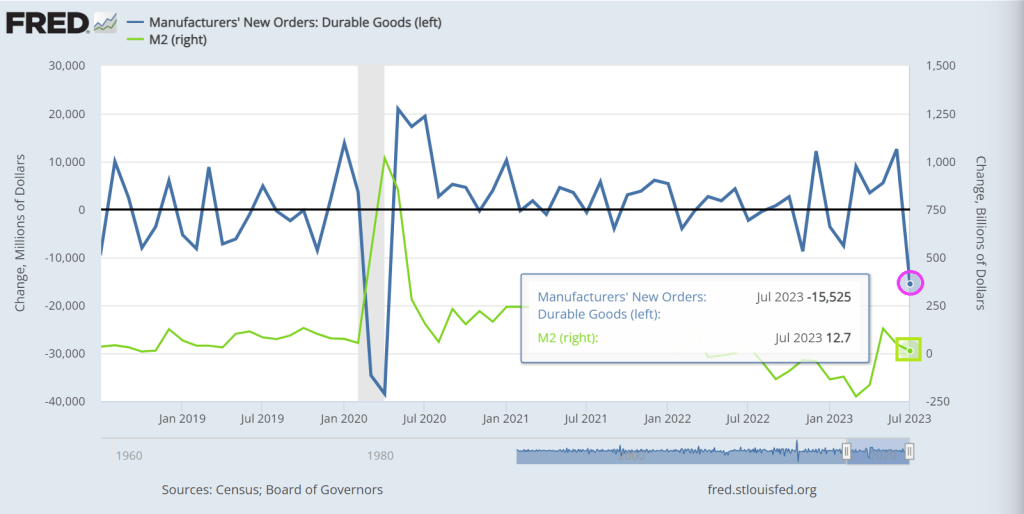
But according to The Fed of St Louis, durable goods new orders were down -15.525% from June to July (MoM) while M2 Money printing growth rose 12.7% MoM.




















You must be logged in to post a comment.