A new $1.2 trillion government spending package Congress is trying to ram through faces significant headwinds in the House, where members are expected to vote on it later this morning.
The 1,012-page bill was introduced at around 3am Thursday morning – just 48 hours before a midnight Friday funding deadline. It must pass both the House and the Senate, after which President Biden will sign it (with crayons at the ready, we’re sure).
The package accounts for approximately 70% of discretionary government spending – and consists of six out of twelve total bills that Congress must pass each fiscal year to fund the government. The six others, around $460 billion in spending, were passed earlier this month.
According to Fox News, multiple GOP sources, two GOP lawmakers and one senior GOP aide think the package will pass, but by a tight margin.
On Thursday afternoon, however, the bipartisan deal hit turbulence – with one GOP lawmaker citing absurd pork contained within – including funding for LGBTQ centers and facilities that provide late-term abortions.
Pork City
As usual, Democrats slipped in as much pork as possible, including:– $850k for a gay senior home- $15 million to pay for Egyptian’s college tuitions- $400k for a gay activist group to teach elementary kids about being trans- $500k for a DEI zoo- $400k for a group to gives clothes to teens to help them hide their gender
$60,000,000,000 for Ukraine (of course). NOTHING for US border.
$1,140,000,000,0000 for pork barrelling
1.2 trillion in inflation, an increase of the money supply by 2% in a single spending bill.
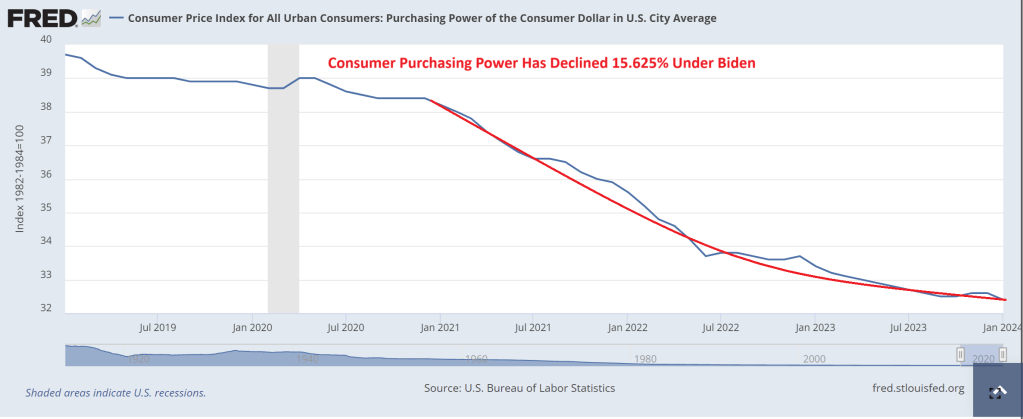
The US Dollar’s purchasing power is down -16% under Gaslight Joe.
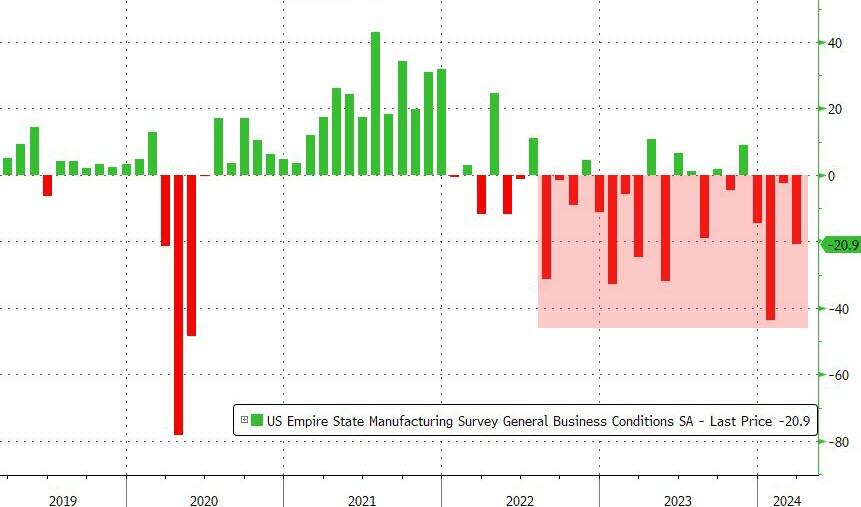
The NY Fed’s Empire State Manufacturing crashed and burned in March. NYFRB’s general business conditions index plunged 18.5pts in March to -20.9. A reading below zero indicates contraction, and the measure was weaker than all estimates in a Bloomberg survey of economists. Hey, I though illegal immigrantion was good for the economy!!!
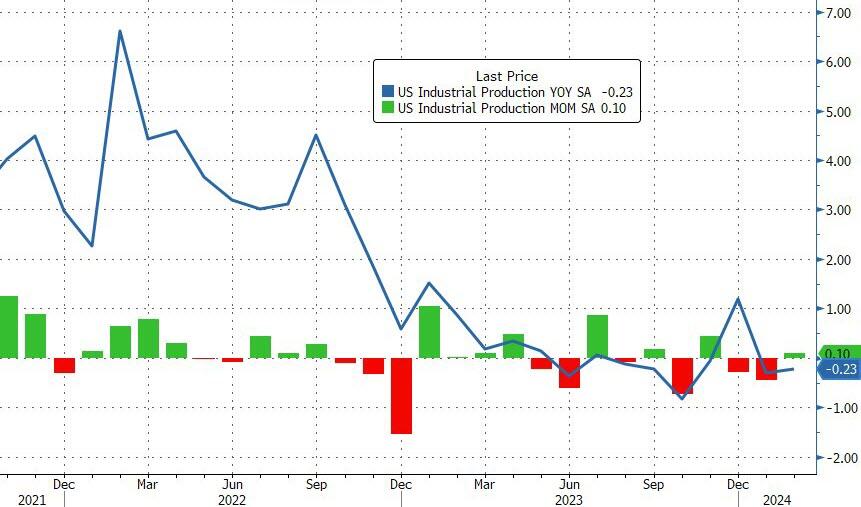
Industrial production fell tp -0.23 YoY in February, not a stellar sign for the economy.
Confidence! It’s what consumers DON’T have under Bidenomics.
For the fourth straight month, The Conference Board revised its consumer confidence data significantly lower. In fact January’s was the biggest downward revision since Feb 2022. And Conference Board Consumer Confidence was DOWN to -3.90 in January, the worst since Feb 2022.
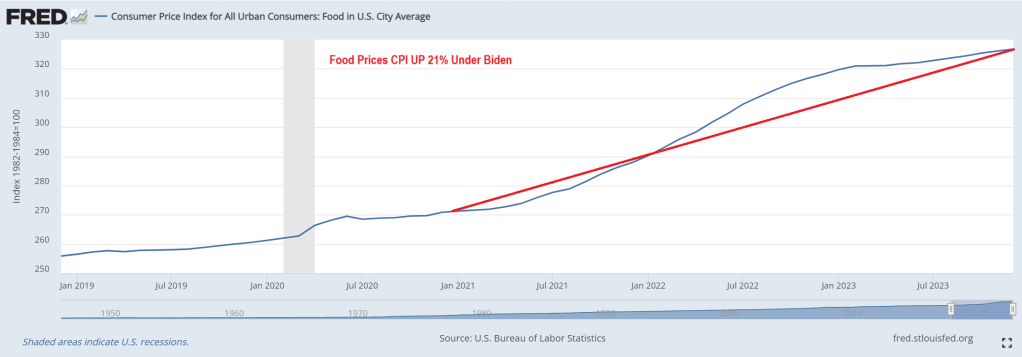
It really isn’t surprising the consumer confidence stinks. Food prices (CPI) are UP 21% under Vacation Joe Biden. Diesel fuel prices are UP 90% under Listless Joe.
Well, Biden’s appearance on (unfunny) Seth Myer’s Late Night Show certainly didn’t make me feel more confident about America’s future.
The Hollies said it best: Stop, stop, stop. FIAT Money Printing that is.
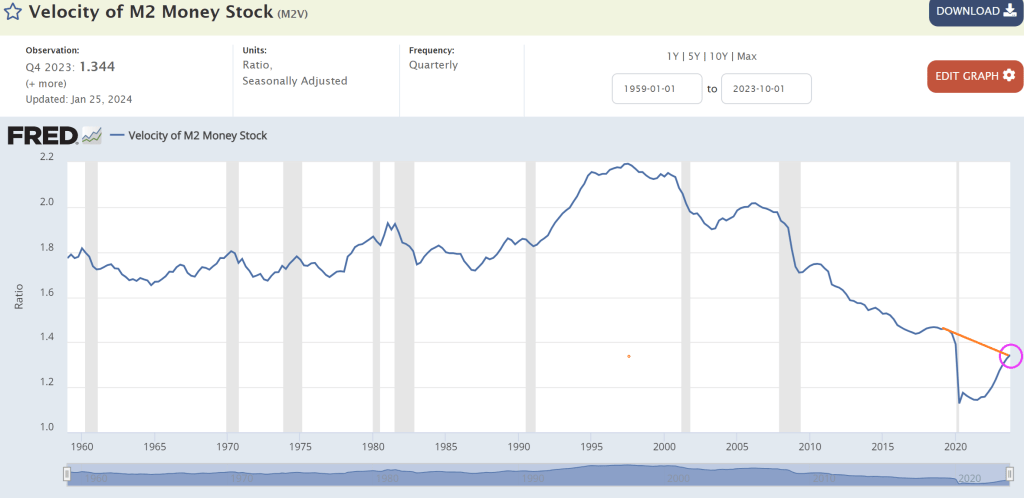
Typically, we look at M2 Money Velocity (GDP/M2) as a measure of how much the economy grows by expanding the money supply.
M2 Money Velocity is currently at 1.344, and still below where we were under Trump prior to Covid. After Powell printing palooza after Covid, M2 Money Velocity collapsed and is slowly rising, but remains low by historic standards.
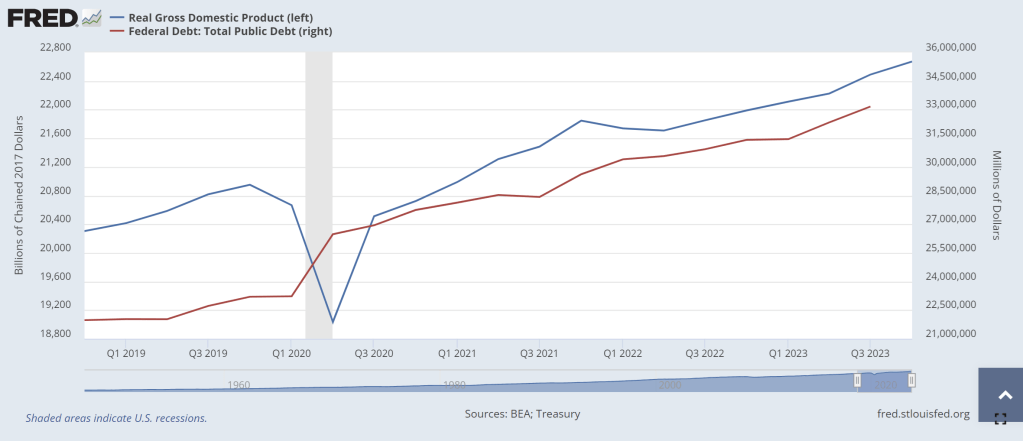
Perhaps a more interest velocity is DEBT velocity (GDP/DEBT). Under Biden’s Reign of Error, Federal debt has increased by $6,539,359 million while real GDP has increased by only $1,948.731 billion (or roughly $2 trillion in GDP growth after $6.54 trillion in debt). Or a DEBT velocity of 0.3. Yikes! No wonder China is bailing on US debt!
This chart makes debt issuance look better than it really is. Again, the DEBT VELOCITY of 0.3 is terrible meaning that for every $1 of Federal debt, we get 30 cents in Real GDP under Biden. One of my macroeconomics textbooks stated that debt growth is fine as long as real GDP growth rises faster than debt growth. Apparently, Treasury Secretary Janet Yellen didn’t read that textbook! Real GDP has grown by 9.43% under Biden while Federal debt has grown by … gulp .. 24%.
Yes, the US is borrowing like the proverbial drunken sailor while they “invest” in green energy, wars in Ukraine and the Middle East, and massive social welfare programs (like the old breads and circuses from the dying Roman Empire). When watching the media’s obsession with Taylor Swift and Chief’s Tight End Travis Kelce at The Super Bowl, it reminded me of “Breads and Circuses” as our nation is collapsing like a dying star. (That is why I Iike Gold, Silver and Bitcoin!)
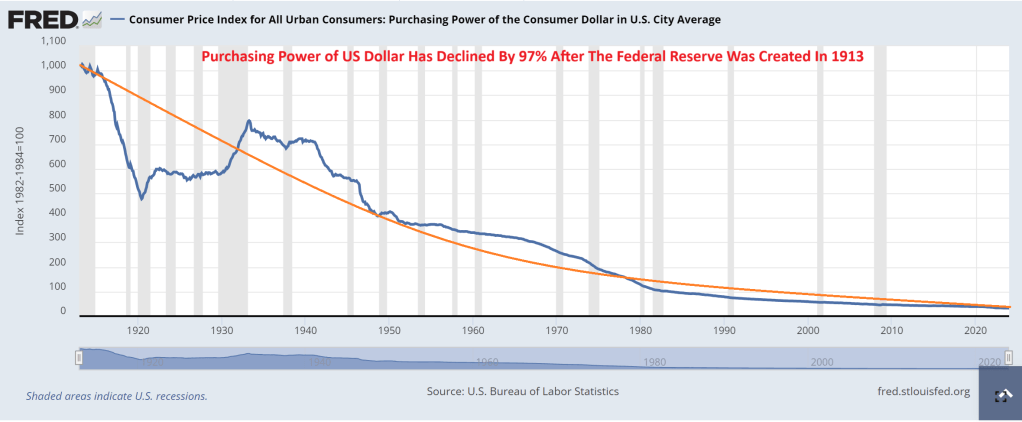
What about The Federal Reserve? It was created in 1913 after signed into existence by President Woodrow Wilson. Since The Fed’s inception, consumer purchasing power has declined by 97%.
And under Biden, inflation has been so bad that consumer purchasing power is down 16%.
In summary, The Federal Reserve has been printing like crazy (I would say Batshit Crazy, but I actually think bats are adorable). And Treasury (under former Fed Chair Janet Yellen) has been borrowing like crazy too. While politicians claim the economy is in great shape, it is really because The Fed is printing wildly, Yellen is borrowing wildly, and much of US GDP is not due to the private sector, but Federal government spending … to the donor class. This is NOT a sustainable and will eventually crash into a ravine.
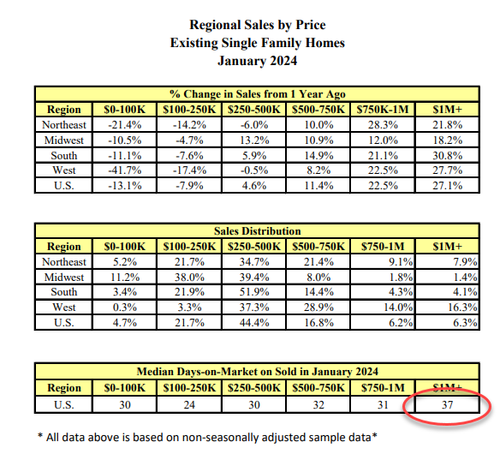
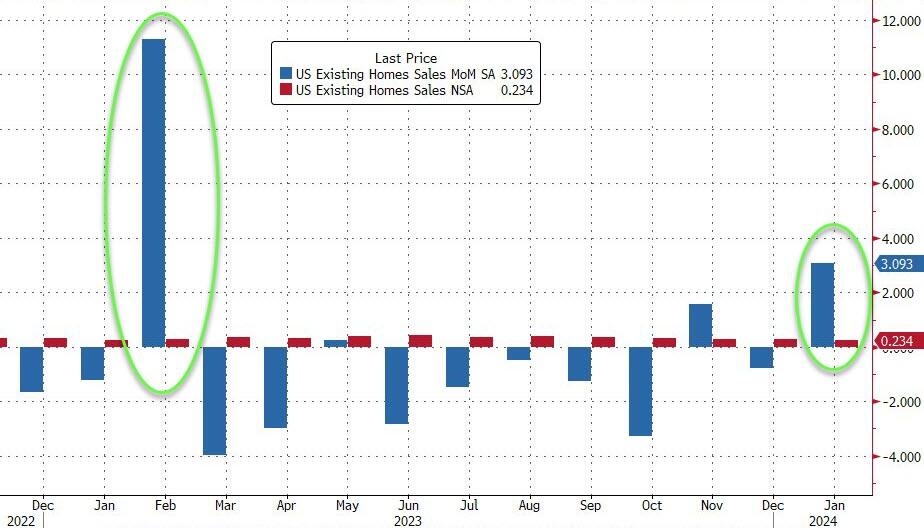
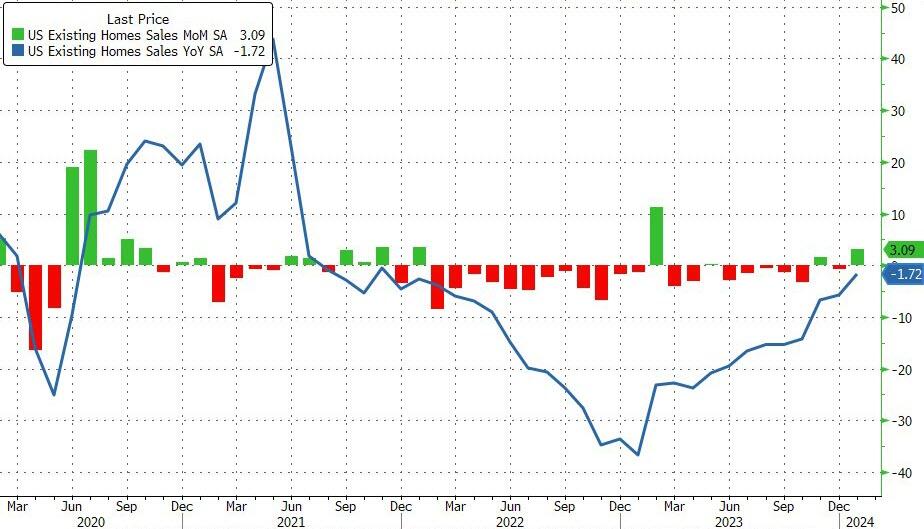
US existing home sales disappointed in January jumping 3.1% MoM (vs +4.9% MoM exp). Quite a different picture from the non-seasonally-adjusted rise of just 0.3%…
Source: Bloomberg
This January rise dragged the YoY decline up to just -1.7%…
Source: Bloomberg
“While home sales remain sizably lower than a couple of years ago, January’s monthly gain is the start of more supply and demand,” said NAR Chief Economist Lawrence Yun.
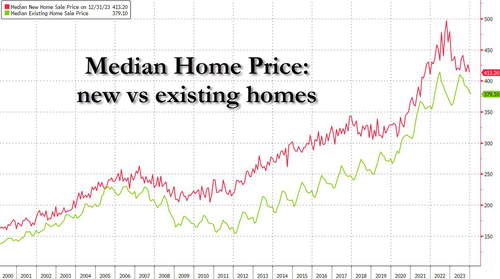
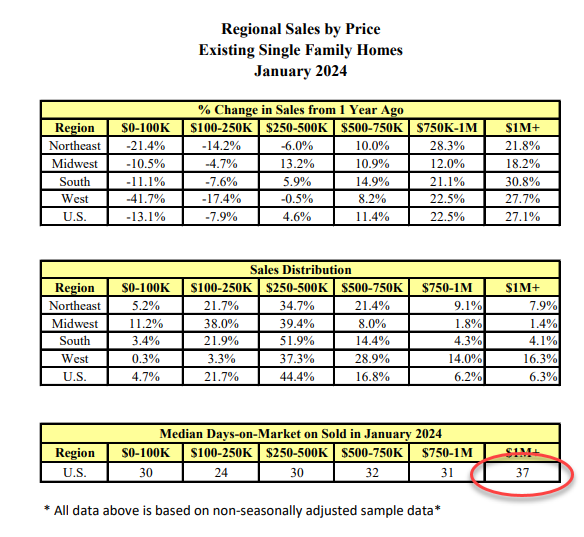
The median home price reached an all-time high for the month of January…
“Multiple offers are common on mid-priced homes, and many homes were still sold within a month. The elevated share of cash deals – 32% – indicated a market full of multiple offers and propelled by record-high housing wealth,” said NAR Chief Economist Lawrence Yun.
Additionally, properties typically remained on the market for 37 days in January, up from 29 days in December and 33 days in January 2023.
So who’s buying homes?
Well, you know the answer to that – even more institutional buyers as first-time homebuyers priced out
First-time buyers were responsible for 28% of sales in January, down from 29% in December and 31% in January 2023.
All-cash sales accounted for 32% of transactions in January, up from 29% in both December and one year ago.
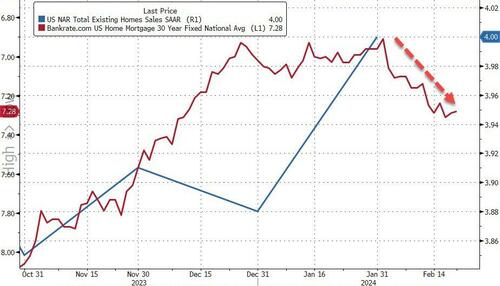
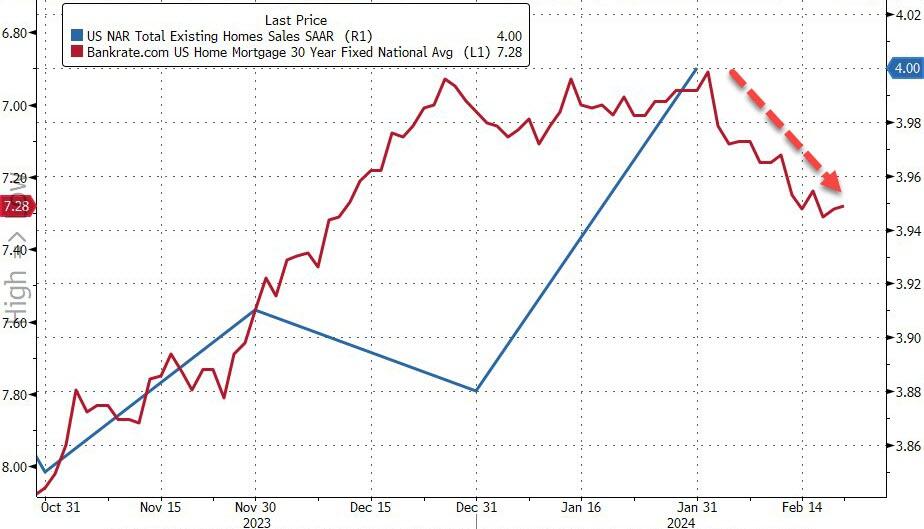
As a reminder, mortgage rates started off the year below 7% and have risen since…
Source: Bloomberg
So don’t expect this renaissance to continue.
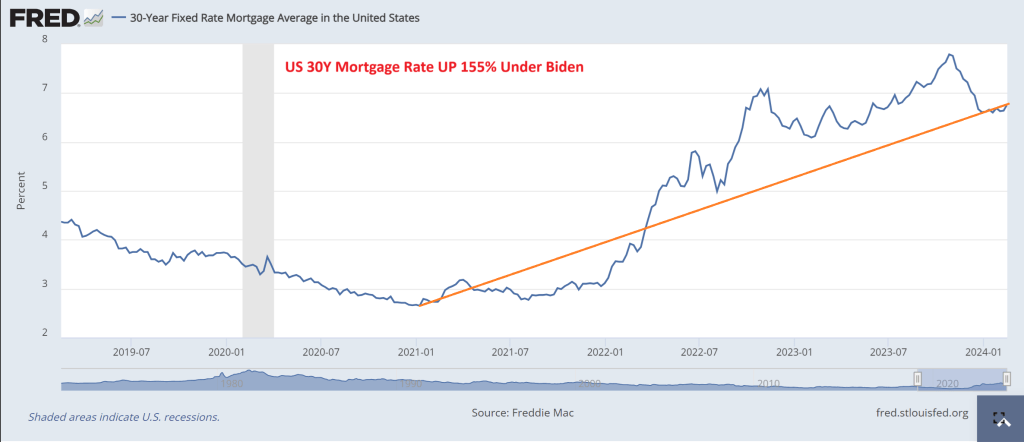
And with mortgage rates hitting 7% … again. And rates are up over 155% under Biden.
When Arnold Schwarzenegger was Governor California, his budget chief, a former high school pal of mine, called me to look at California’s budget. He sent me his spreadsheets with forecasts and asked me what I thought. Even back then, I called back and said “California is on an unsustainable fiscal path and seems to be committing suicide.” He agreed, but noted that Schwarzenegger would not like that conclusion. I told him to blame me for the report, as an unpaid consultant to The Golden State. But even back then, I could foresee the absolute mess that the California State legislature would make, particularly if they elected a Democrat governor.
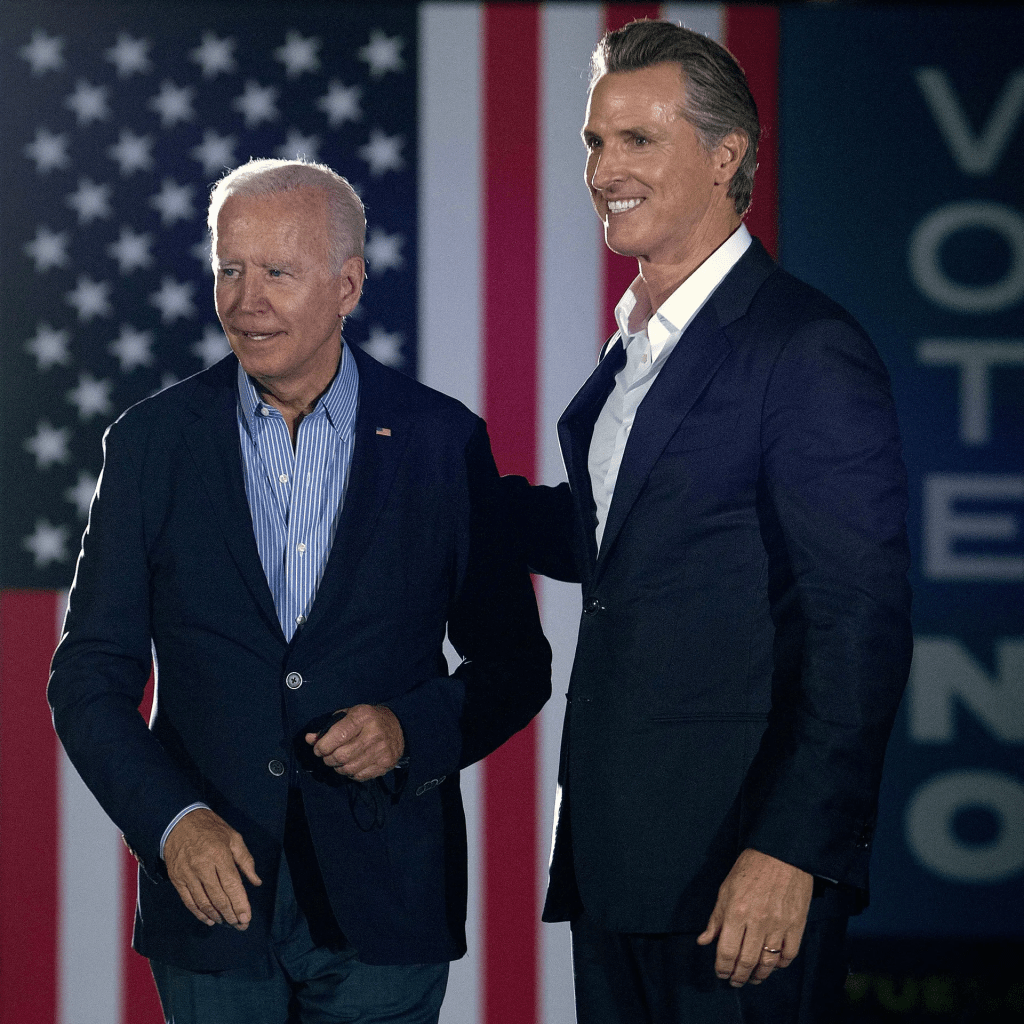
California’s budget deficits look a lot like Biden’s (call him Newsom’s elderly intellectual grandpa) budget deficits where Biden and Congress went on a spending spree from “the honey pot” (US Treasury) and borrowed funds.
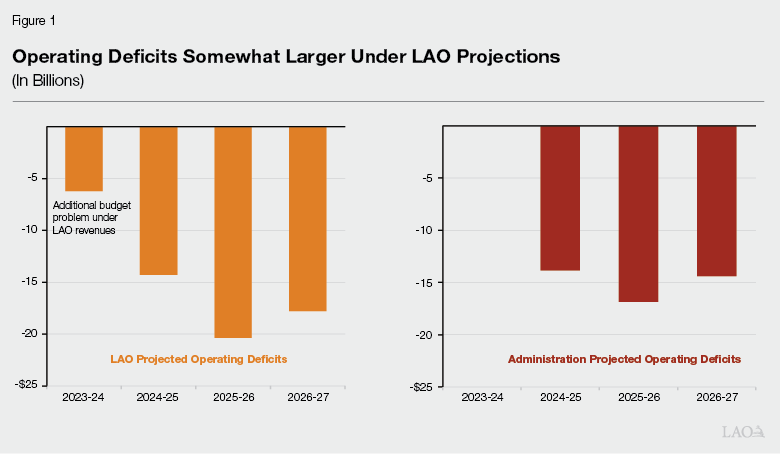
California’s budget crisis is projected to expand more than previously thought and could hit a record deficit of $73 billion, according to a new report from the state’s nonpartisan Legislative Analyst’s Office (LAO).Her
“The actual increase in the state’s budget problem will depend on a number of factors, including formula-driven spending changes, most notably Proposition 98 spending requirements for schools and community colleges,” the report said.
H.D. Palmer, the deputy director of the California Department of Finance and Newom’s spokesperson on budget matters, responded to the new LAO report by telling Fox News Digital that their budget shortfall differs from the $38 million they estimate.
“From now through April, more than $51 billion in income and corporate tax receipts are forecast to come in,” Palmer said. “No one can say today with certainty how those numbers may change the budget estimate of a $38 billion shortfall.”
“A responsible step would be for the Legislature to act now on the early action budget measures needed for $8 billion in solutions to help close this gap,” he added.
The projected bad news comes as Newsom has worked to increase his profile nationwide. It also occurred as California experienced a mass exodus.
California saw its first-ever population decline in 2020 when the state imposed rigid lockdowns during the COVID-19 pandemic. From January 2020 to July 2022, the state lost well over half a million people, with the number of residents leaving surpassing those moving in by almost 700,000.
Census data has shown that Texas is the most popular destination for residents fleeing the state, followed by Arizona, Florida, and Washington. (Of course, Arizona where I used to live has flipped from a Red state to a Blue state with immigration and Democrats are working hard to flip Texas to a Blue state. Washington, has already flipped Blue. Florida remains a Red state under Ron DeSantis).
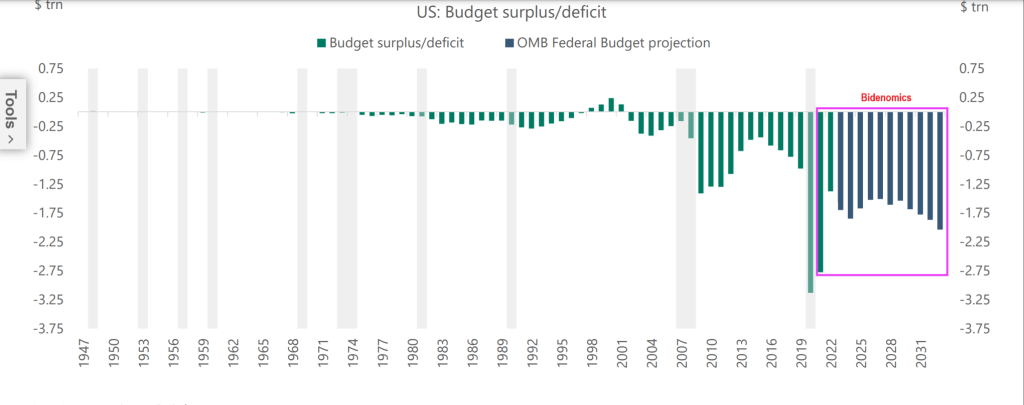
Here is Biden’s budget deficit chart under the hilariously termed “Bidenomics.” Ah, so maybe Governor Newsom is a perfect fit for the wild spenders in Washington DC.
Lest we forget, Biden/Congress can borrow endless funds and stick the bill to Gen Zers and the unborn.
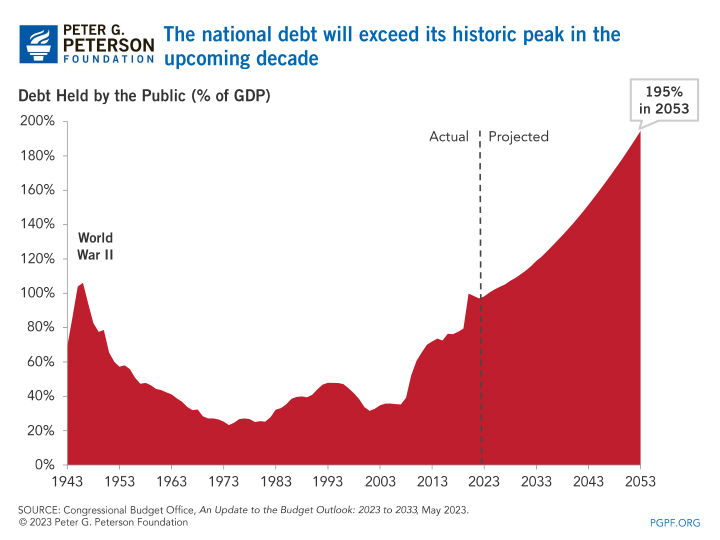
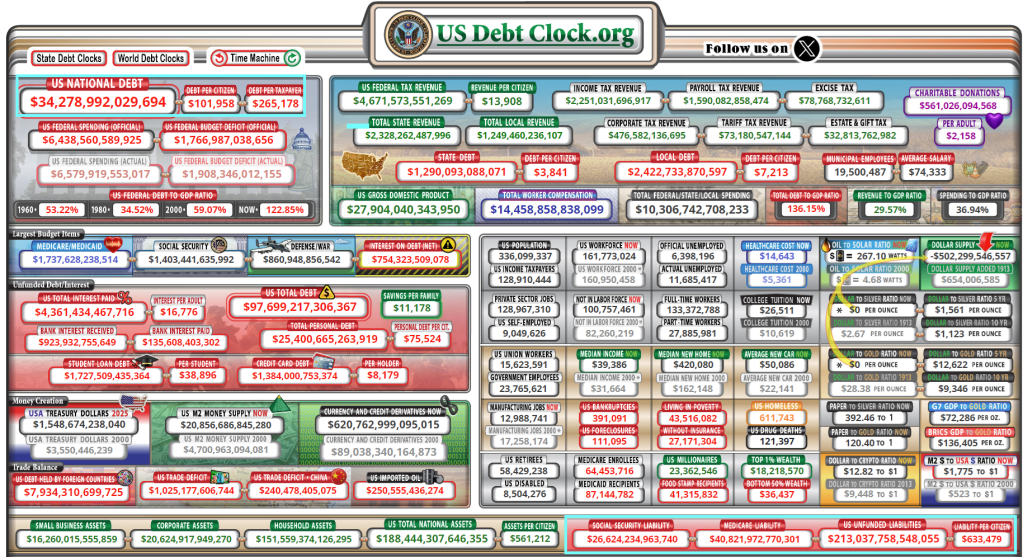
And remember, US politicians have promised $213 TRILLION in unfunded payments that will require cuts (LOL!) or a massive increase in Federal debt.
Biden and Newsom could sing “Fiscal inferno” together! “Here is my demented, doddering grandfather!”
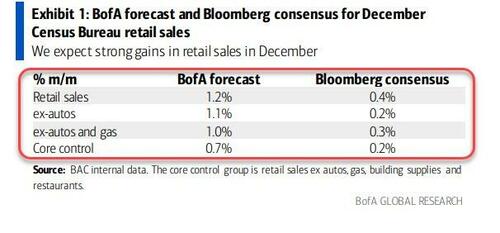
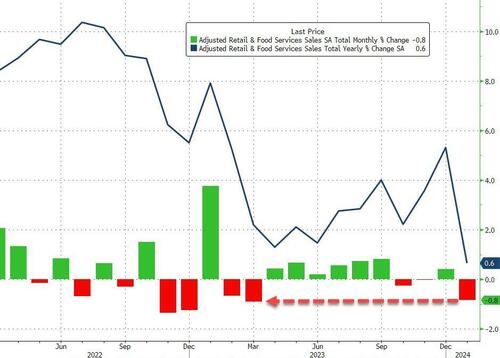
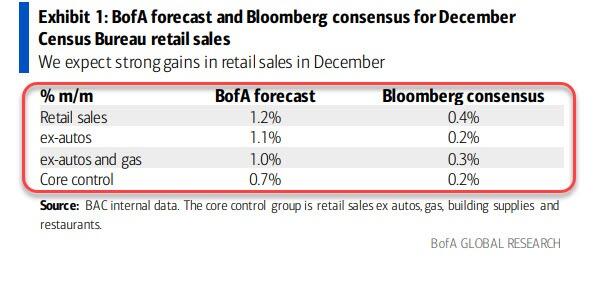
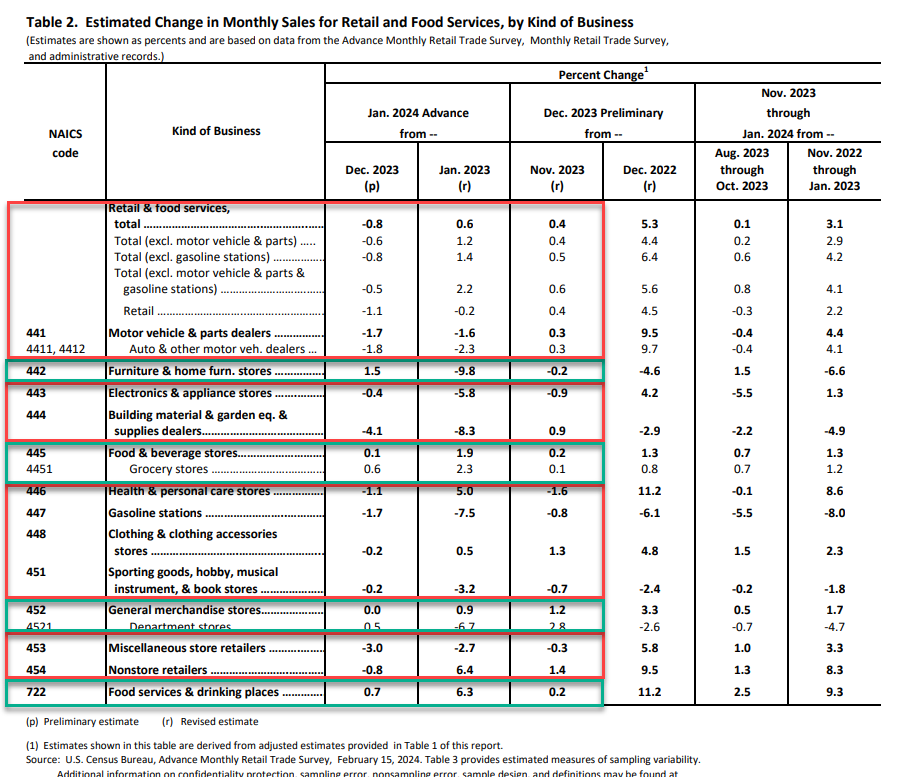
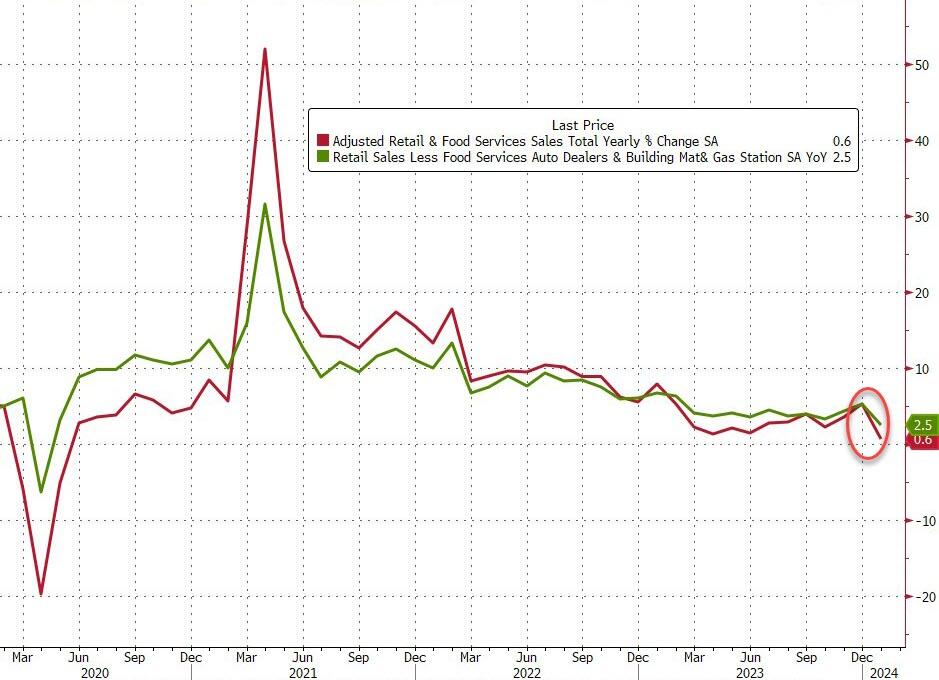
After they unexpectedly surged in November and December (driven in large part by a jump in Food Services), headline retail sales in January were expected to decline just 0.2%, but BofA nailed it once again with a large 0.8% MoM drop. That dragged the YoY retail sales down to just 0.6%…
Source: Bloomberg
That is the worst monthly decline since March 2023 and worst YoY rise since May 2020.
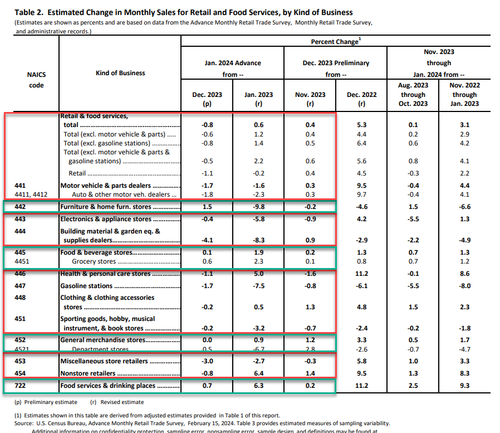
It wasn’t pretty…
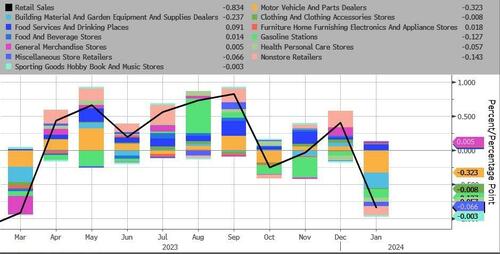
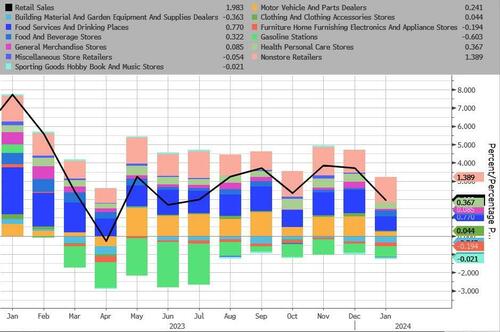
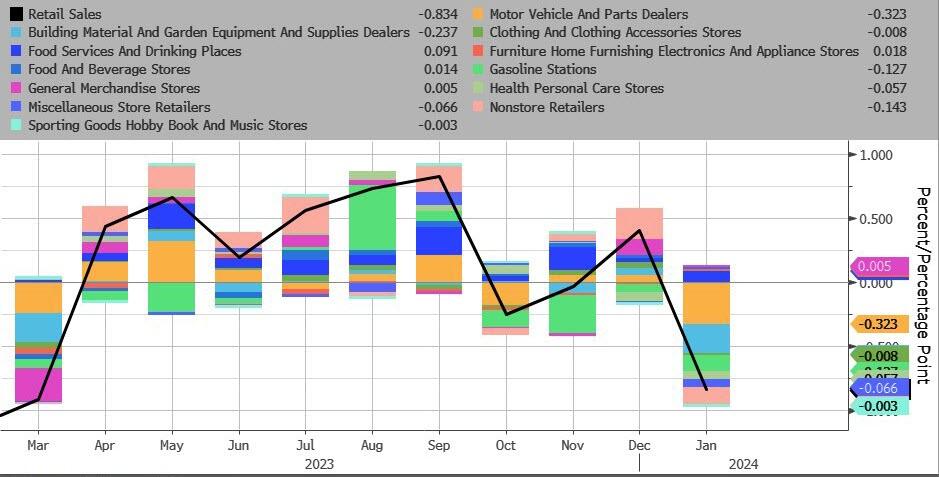
Motor Vehicles and Parts and Building Materials saw the largest decline MoM…
Source: Bloomberg
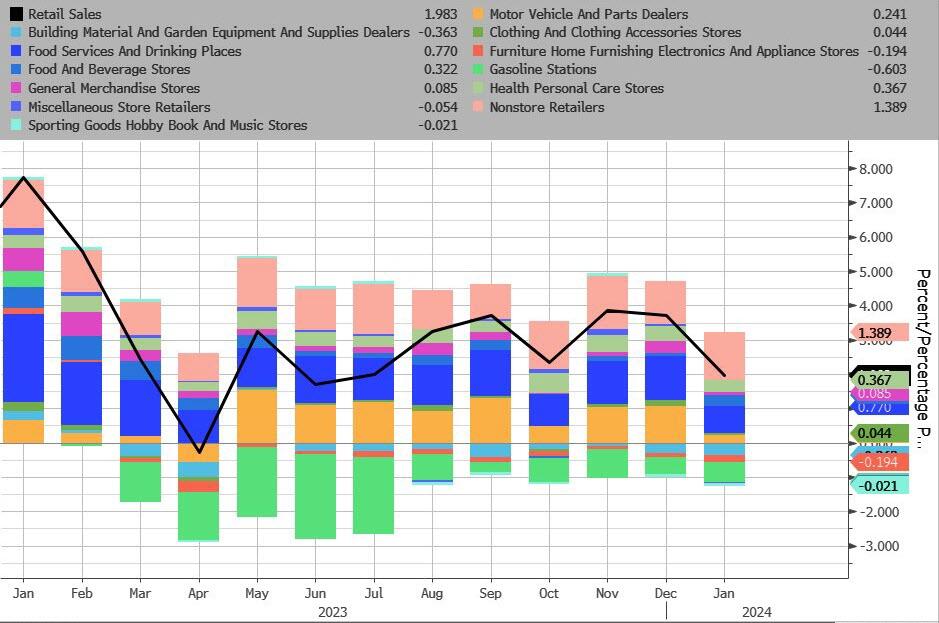
On a YoY NSA basis, Gas Stations and Building Materials were the biggest drag, while online retailers and Food Services were the biggest upside drivers…
Source: Bloomberg
Core Retail Sales also declined (-0.5% MoM vs +0.2% exp), which dragged the YoY levels down to their lowest since the COVID lockdowns…
Source: Bloomberg
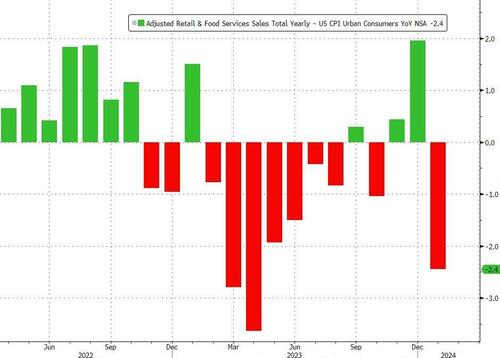
Adjusted (crudely) for inflation, this was a huge drop in ‘real’ retail sales. REAL retail sales have declined for 11 of the last 15 months – in other words, on a crude basis (Ret Sales – CPI), Americans aren’t buying more shit.
Source: Bloomberg
Finally, the control group – used to feed through to the GDP calculation – tumbled 0.4% MoM (vs expectations of +0.2%).
Soft-landing morphing into a stagflationary crash-landing?
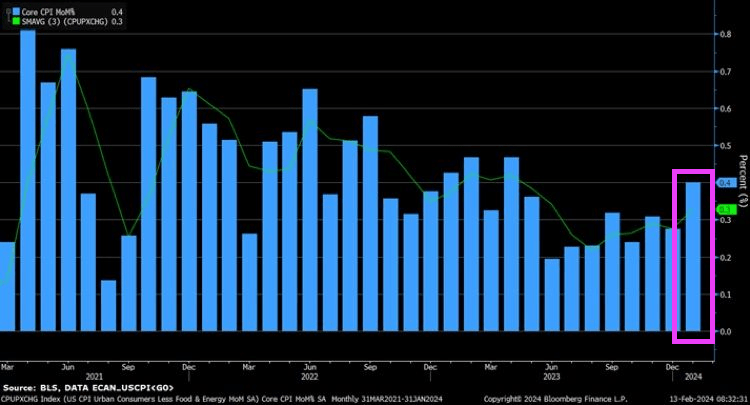
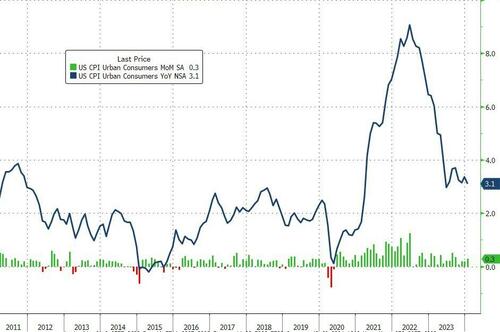
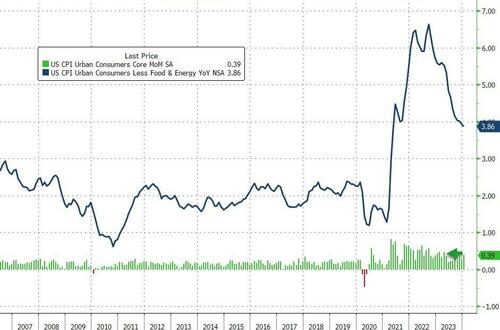
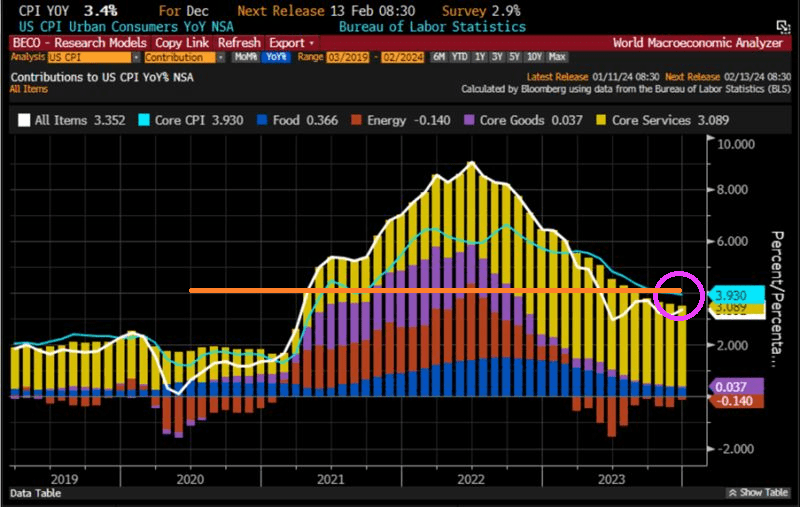
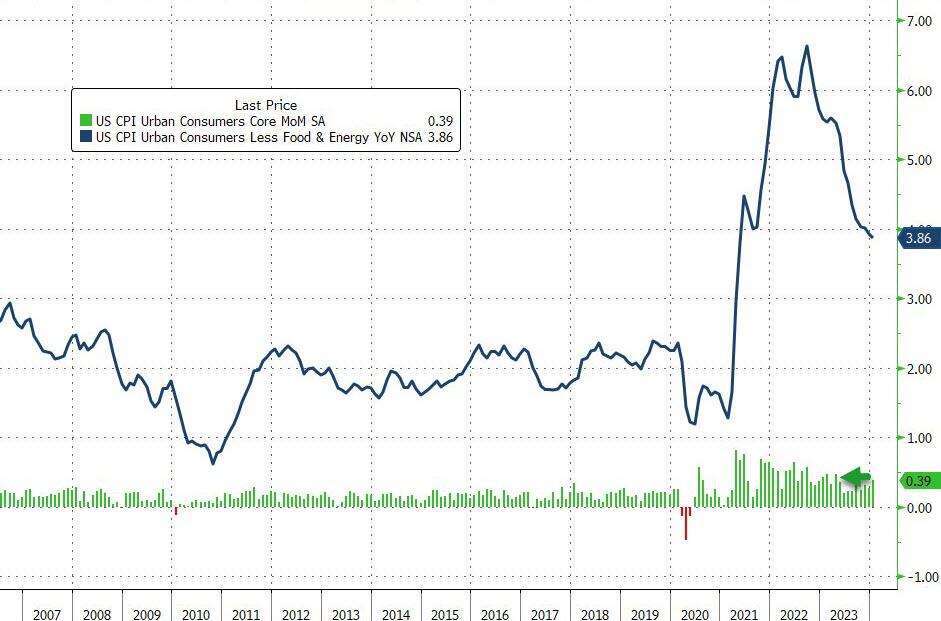
Core CPI fell below 4.00% YoY for the first time since May 2021, but the +3.86% YoY print was hitter than the 3.7% exp (with prices rising 0.4% MoM – the biggest jump since April 2023)…
Source: Bloomberg
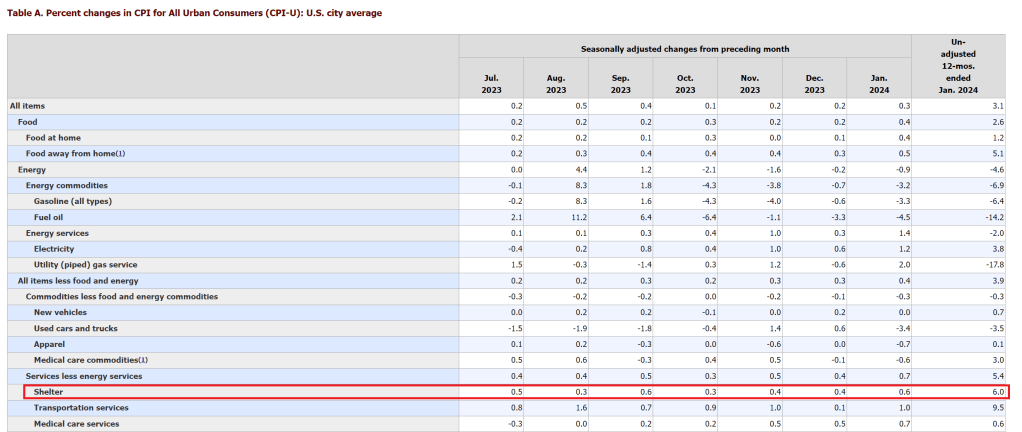
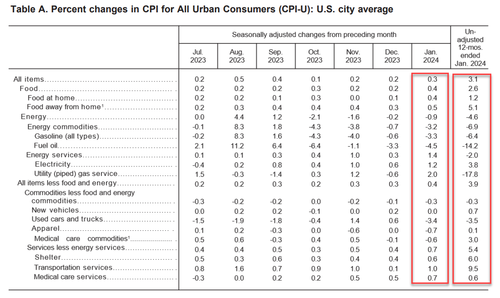
CPI Core: The index for all items less food and energy rose 0.4 percent in January.
The shelter index increased 0.6 percent in January, and was the largest factor in the monthly increase in the index for all items less food and energy.
The index for owners’ equivalent rent rose 0.6 percent over the month, while the index for rent increased 0.4 percent.
The lodging away from home index increased 1.8 percent in January. The motor vehicle insurance index increased 1.4 percent in January, and the recreation index rose 0.5 percent in January.
Among other indexes that rose in January were communication, personal care, airline fares, and education.
The medical care index rose 0.5 percent in January.
The index for hospital services increased 1.6 percent over the month and the index for physicians’ services increased 0.6 percent.
The prescription drugs index fell 0.8 percent in January.
The index for used cars and trucks fell 3.4 percent in January.
The index for new vehicles was unchanged in January.
The apparel index also decreased, falling 0.7 percent over the month.
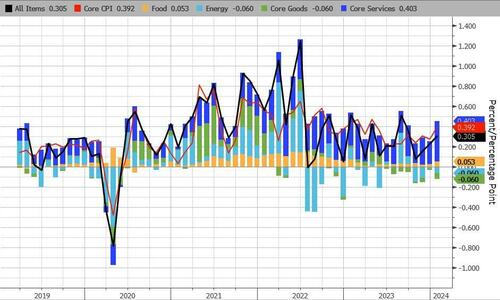
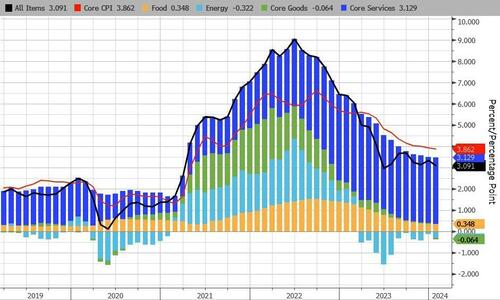
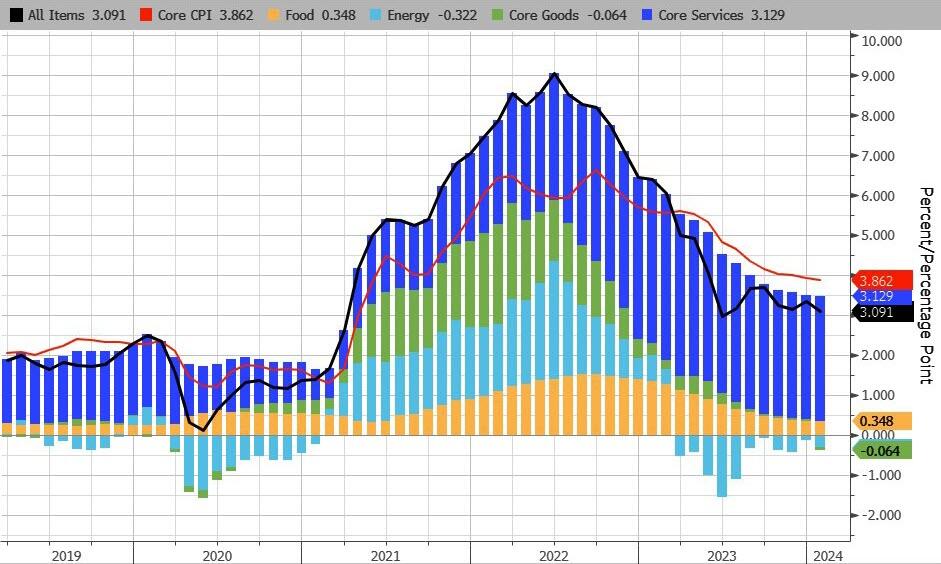
Core Service inflation picked up MoM…
..and accelerated YoY
Source: Bloomberg
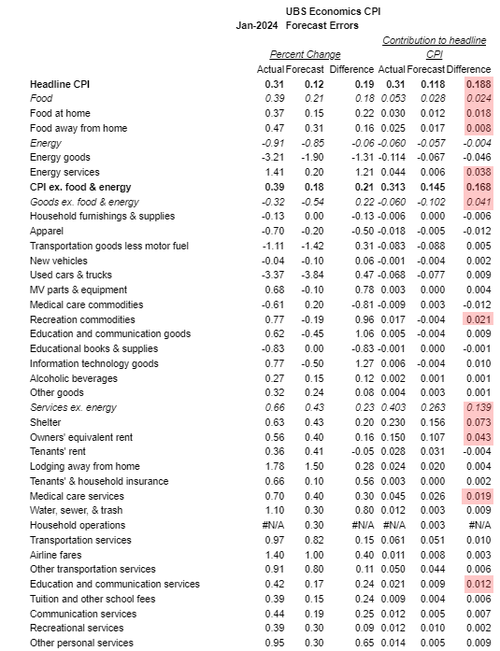
Under the hood, food and Energy services costs jumped MoM along with transportation services…
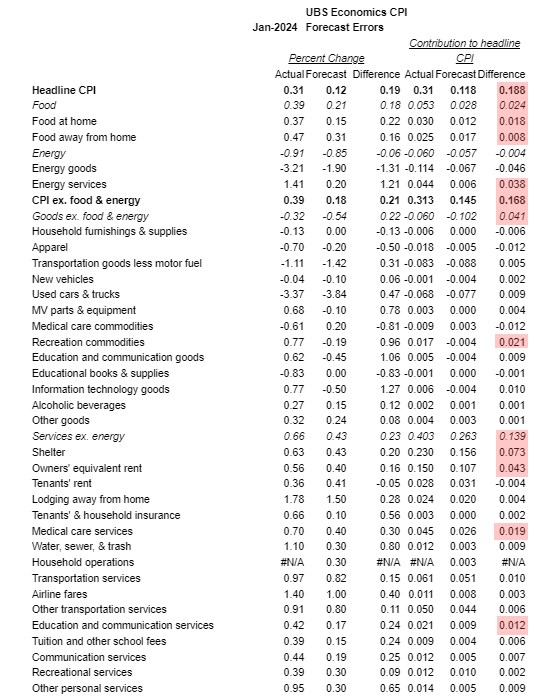
Here’s the biggest component upside surprises…
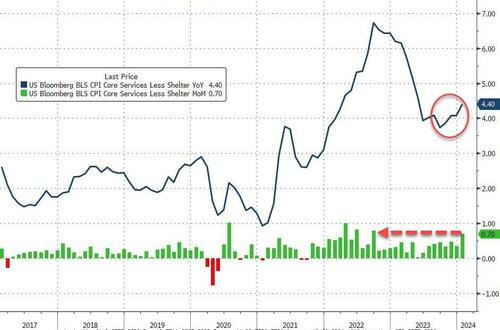
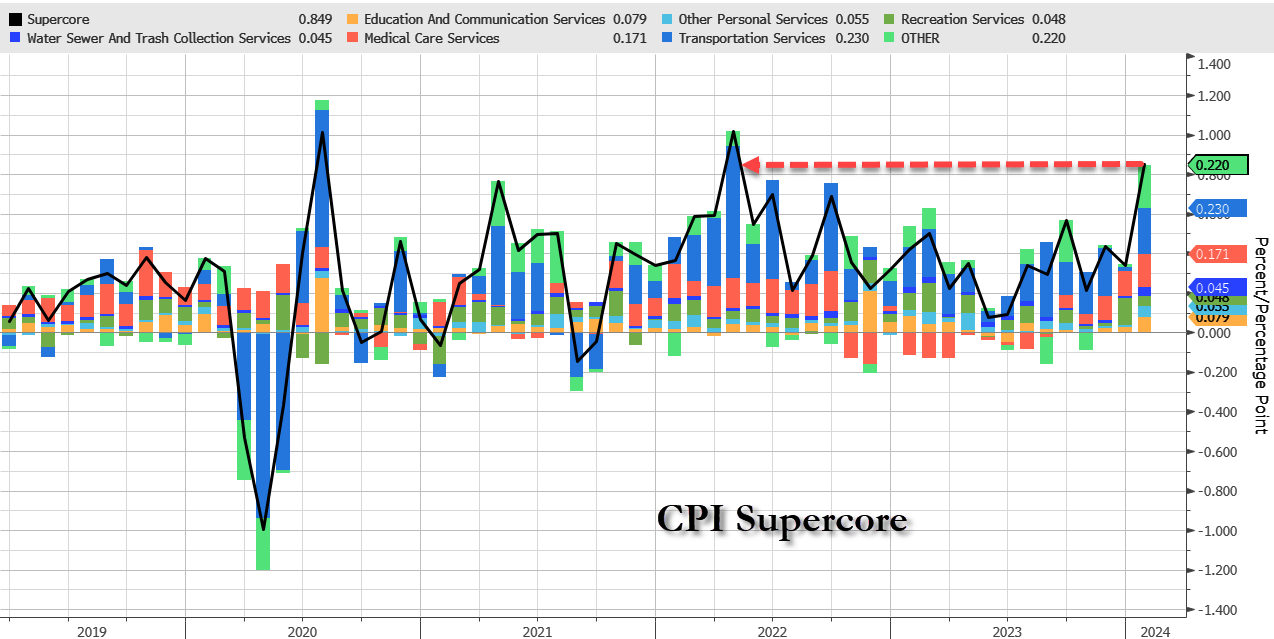
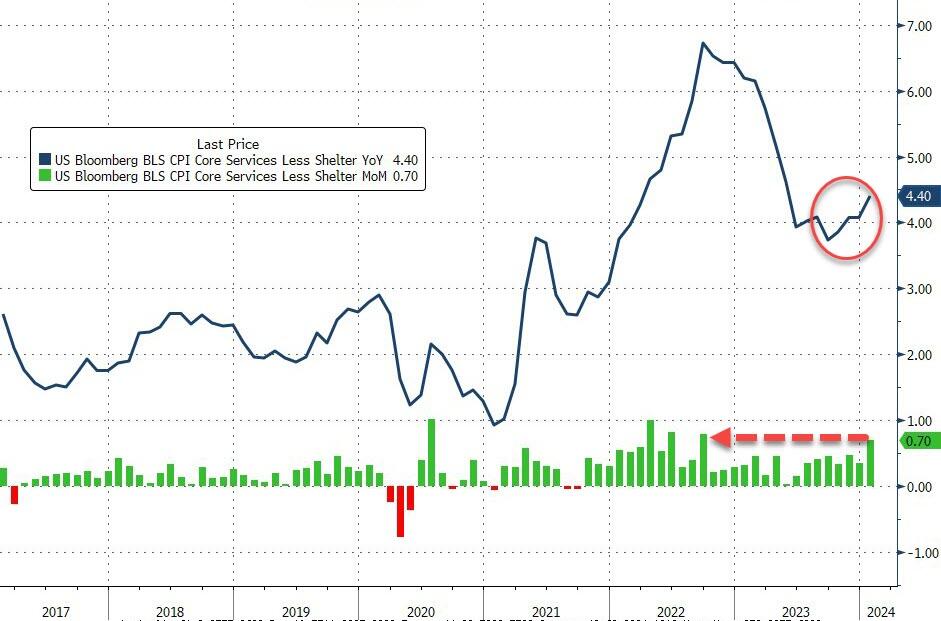
And one step deeper – the so-called SuperCore: Core CPI Services Ex-Shelter index – soared 0.7% MoM (the biggest jump since Sept 2022…
… driving the YoY change up to +4.4% – the hottest since May 2023….
Source: Bloomberg
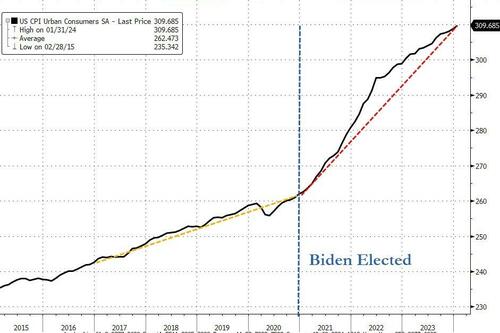
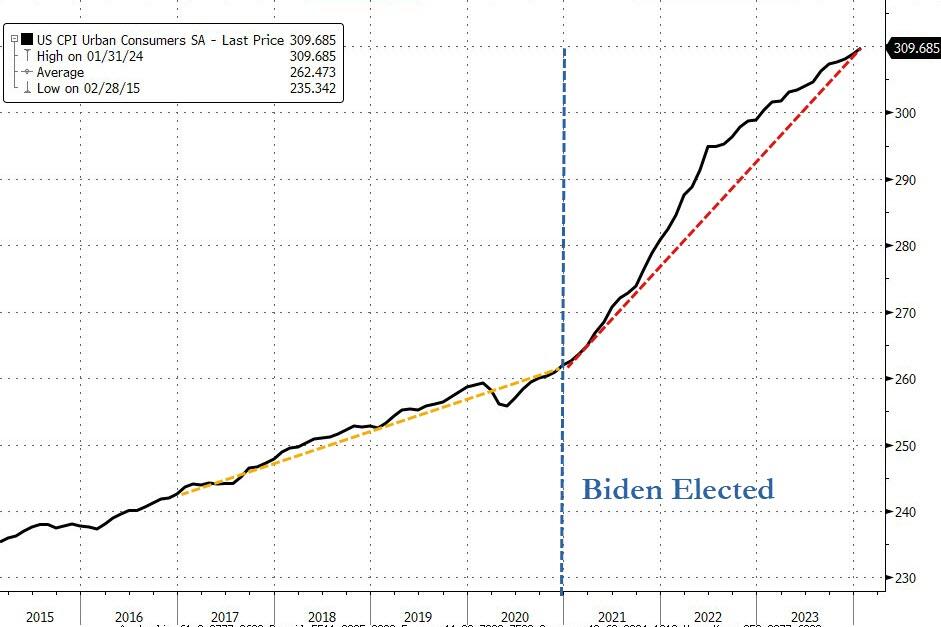
Finally, as a reminder, lower inflation does not mean lower prices.
Source: Bloomberg
The actual index of consumer prices hit a new record high this month – and is up over 18% since President Biden’s term began(it was up 8% over President Trump’s full four year term).
And it gets worse…
Source: Bloomberg
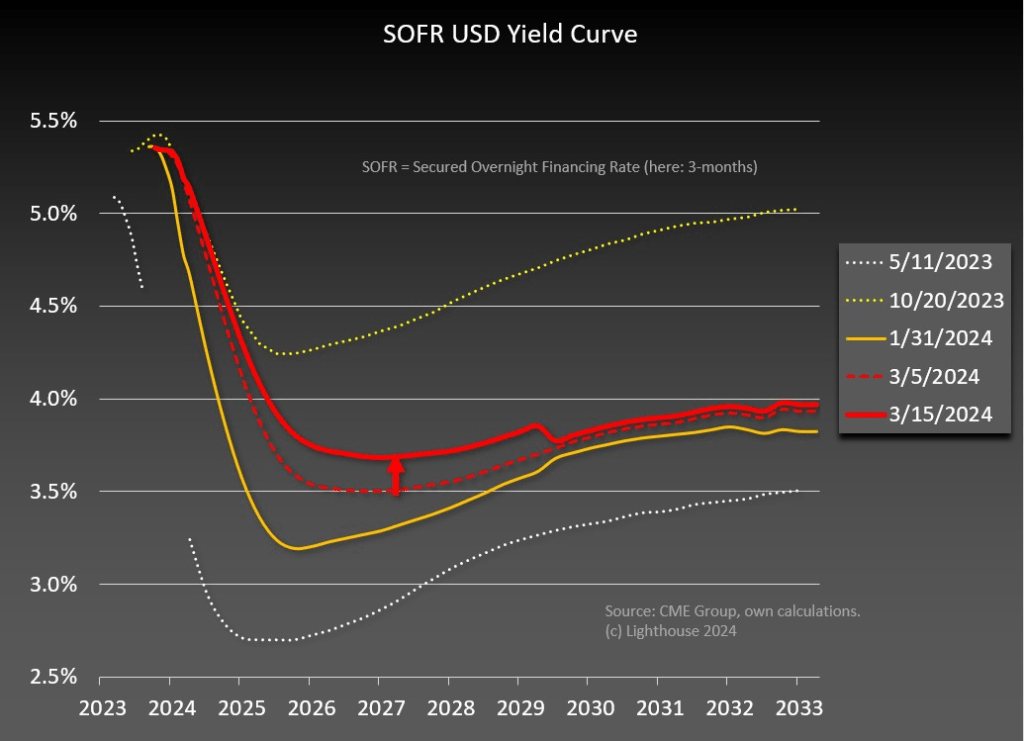
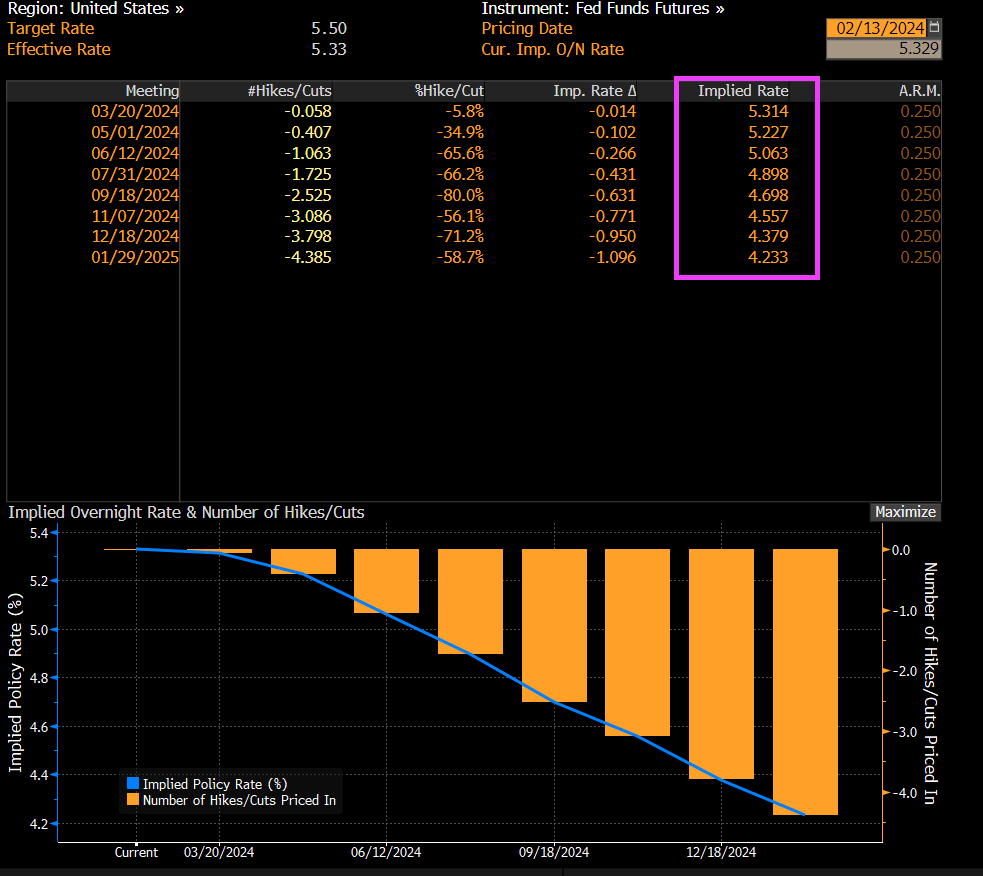
And on the higher than expected inflation report, we are still seeing bets on Fed Funds rate falling from 5.50% to 4.233% over the coming year.
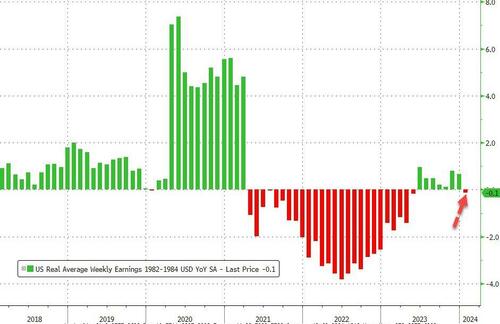
The re-accleration of inflation means wage growth is back in the red relative to prices.
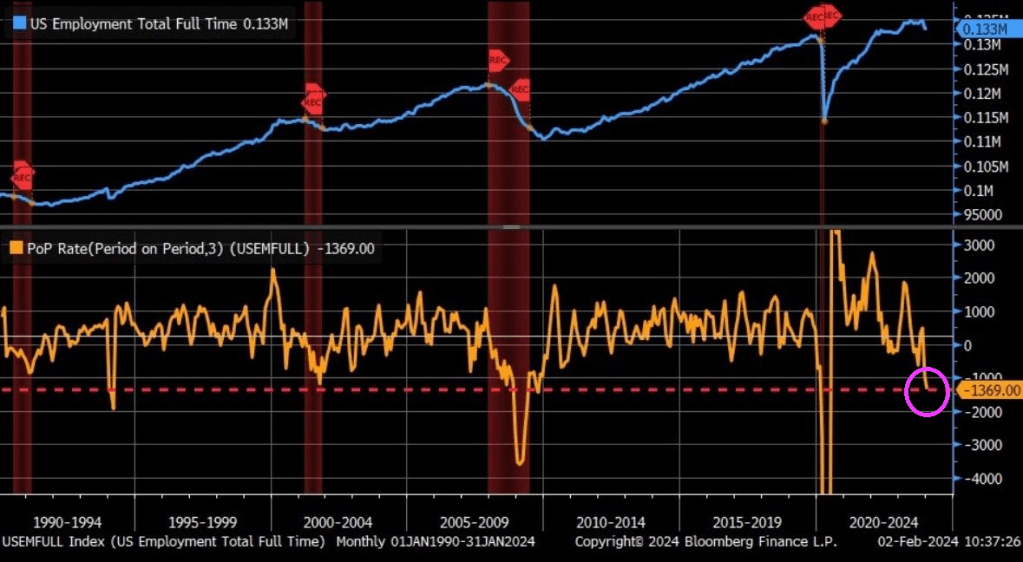
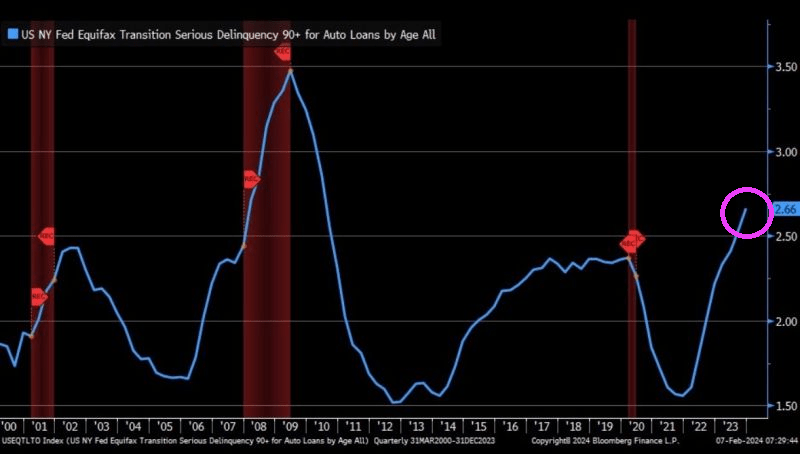
And with the God awful jobs report, serious delinquencies on auto loans is SOARING. To the highest rate since The Great Recession.
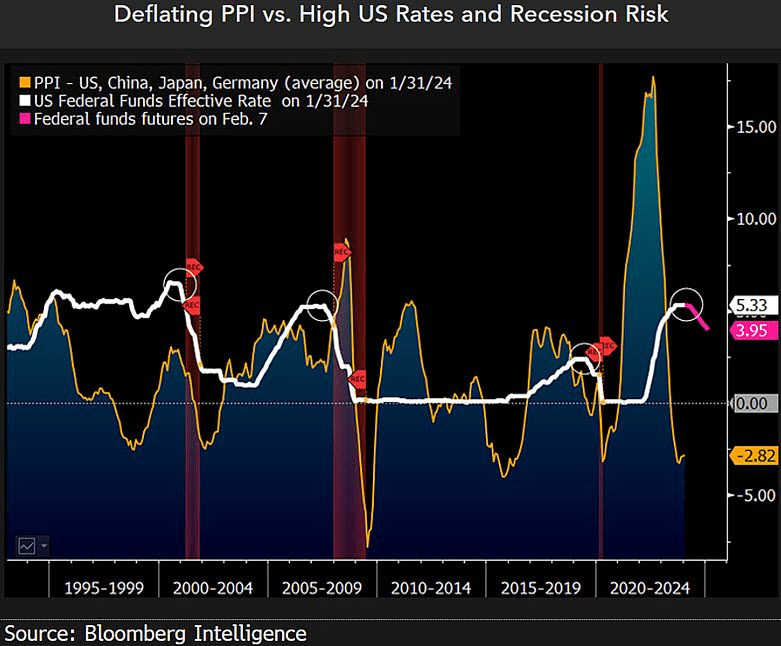
The Producers Price Index is deflating.
At least inflation is cooling down, but still higher than under he that can’t be mentioned on The View, Rachel Maddow or Morning Joe, Donald Trump, the Left’s Voldemort.
I admit, Travis Kelce should have been benched for shoving Head Coach Andy Reid during The Super Bowl. “Damn it, Taylor (Swift) flew here from Tokyo to watch me play and you aren’t throwing enough to me!” Welcome Travis Kelce to the elitist 1% who think the rules don’t apply to them. And your 2.0 GPA at University of Cincinnati certainly qualifies you to opine on the economy … on The View or MSNBC.
Remember the Chicago Bears’ “Super Bowl Shuffle”? Well, Joe Biden is thedemented (according to Hur) shuffler so a Super Bowl shuffle video featuring Biden talking about how he is reducing prices.
A week out from kickoff, rooms at five-star hotels like the Bellagio, Aria, and The Venetian started at $1,500 or more per night for Super Bowl weekend, according to Expedia. Travelers seeking an affordable stay on the Las Vegas Strip, such as at Excalibur, can find an average nightly rate of $88 on Priceline for this weekend. That jumps to $486 during Super Bowl weekend, an increase of 426 percent. Prices do dip a bit if Super Bowl fans want to stay away from the Strip’s hotels and casinos. Downtown and hotels away from the main drag do offer some cheaper options, with some hotels charging around $200 per night on Fremont Street. Circa, which contains one of the most popular sportsbooks in Las Vegas, is an exception. Rooms this weekend are going for $179 per night on Priceline. That shoots up to $1,232 per night, with only a few rooms remaining at that price, for Super Bowl weekend.
And then, of course, there are the costs of getting there and subsisting. Intrepid drivers looking to travel from San Francisco to Los Angeles (a trip of between 8 and 9 hours) will do so with gasoline prices at $3.66/gallon. That’s down markedly from the mid-2022 spike, but still vastly above levels before the pandemic. Like hotel and ticket prices, airfare into and out of Las Vegas around the big game has alsovaulted in price, although a number of carriers have increased capacity to meet surging demand.
Celebrating at Home Of course, the vast majority of Super Bowl LVIII viewers will not be in Allegiant Stadium, which holds 65,000 spectators. The remainder of viewers, averaging north of 100 million people, will be watching at home or in their hometown sports bars and restaurants. But the persistent inflation of the past three years extended the financial burden into that seemingly more affordable alternative: hosting or attending Super Bowl parties at home. What was once a casual affair of chips, dips, and budget-friendly beverages has transformed into a costly endeavor, as the price of groceries, alcoholic beverages, and even party supplies have surged, affecting the way fans plan to experience one of America’s most iconic sporting events.
The top Super Bowl snacks and dishes include chicken wings, guacamole, potato skins, and deviled eggs, so a look at the recent price trends in chicken, beef, pork, avocados, eggs, beans, potatoes, eggs and condiments is relevant. Pizza, alcoholic beverages, and soft drinks are other popular choices prices have been creeping up.
Below are the prices of a handful of foodstuffs and ingredients which feature prominently in Super Bowl festivities, as well as the price changes from the pre-pandemic period to the most recent data (December 2019 to December 2023). The prices are provided by the US Bureau of Labor Statistics Average Prices by Product series, not seasonally adjusted:
Dec-19 to
Dec 2019
Dec 2023
Dec-23
Grade A Large Eggs
$1.54
$2.51
63.30%
White Sugar All Sizes
$0.59
$0.96
62.30%
Price Frozen Concentrate OJ
$2.34
$3.72
59.10%
Coffee
$4.05
$6.09
50.30%
White Bread
$1.36
$2.02
48.50%
All Ham Ex Canned and Slices
$3.04
$4.40
45.00%
Chocolate Chip Cookies
$3.58
$5.12
42.80%
Grapefruits
$1.25
$1.78
41.90%
Potato Chips
$4.53
$6.41
41.40%
Long Grain White Rice
$0.71
$0.99
38.70%
All Uncooked Beef Steaks
$7.71
$10.65
38.10%
Sirloin Steak Boneless
$8.48
$11.69
37.80%
All Other Uncooked Beef ExVeal
$5.05
$6.91
36.70%
Round Roast Choice Boneless
$5.07
$6.89
35.80%
Boneless Ham Excluding Canned
$4.07
$5.50
35.10%
Ground Beef 100% Beef
$3.86
$5.21
34.90%
Fresh Whole Chicken
$1.45
$1.96
34.80%
Whole Wheat Bread
$1.96
$2.65
34.80%
Round Steak Boneless
$5.98
$7.99
33.70%
All Uncooked Beef Roasts
$5.54
$7.35
32.70%
All Other Pork Ex Can/Sliced
$2.76
$3.64
31.80%
Boneless Chicken Breast
$3.11
$4.08
31.10%
Chuck Roast Choice Boneless
$5.65
$7.38
30.70%
All Uncooked Ground Beef
$4.30
$5.57
29.40%
Ice Cream
$4.74
$6.02
26.90%
Processed American Cheese
$3.91
$4.96
26.80%
Ground Chuck
$4.07
$5.12
25.90%
Fresh Fortified Whole Milk
$3.19
$4.01
25.70%
All Pork Chops
$3.39
$4.26
25.50%
All Purpose White Flour
$0.43
$0.54
25.40%
Sliced Bacon
$5.47
$6.77
23.70%
Chicken Legs Bone In
$1.51
$1.86
23.30%
Romaine Lettuce
$2.18
$2.68
23.30%
White Potatoes
$0.78
$0.96
23.20%
Malt Beverages
$1.42
$1.75
23.00%
Boneless Beef for Stew
$5.75
$7.03
22.20%
Lean Ground Beef
$5.52
$6.67
20.90%
Navel Orange
$1.33
$1.60
20.60%
Boneless Chops
$3.81
$4.56
19.80%
Iceberg Lettuce
$1.30
$1.53
17.30%
Spaghetti and Macaroni
$1.19
$1.38
15.80%
Dry Pint Fresh Strawberries
$3.10
$3.57
15.40%
Center Cut Bone In Chops
$3.77
$4.33
14.70%
Dried Beans
$1.40
$1.59
13.60%
Red and White Table Wine
$12.04
$13.32
10.60%
Bananas
$0.57
$0.63
9.10%
Natural Cheddar Cheese
$5.30
$5.55
4.60%
Lemon
$2.00
$2.07
3.60%
Field Grown Tomatoes
$1.95
$2.00
2.10%
And although disinflation has proceeded, by their nature the various indices (Consumer Price Index, Personal Consumption Expenditure Price Index) obscure individual price changes. For example: the US CPI Urban Consumers Food-at-Home index, in December 2023, showed a year-over-year change of 1.31 percent (from 299.089 to 303.005). Below are the actual December 2022 to December 2023 changes in individual food items which are prominent in Super Bowl celebrations.
Dec-22 to
Dec 2022
Dec 2023
Dec-23
Price Frozen Concentrate OJ
$2.72
$3.72
36.80%
Sirloin Steak Boneless
$10.17
$11.69
15.00%
White Sugar All Sizes
$0.84
$0.96
13.30%
Round Steak Boneless
$7.06
$7.99
13.20%
All Uncooked Beef Steaks
$9.46
$10.65
12.50%
Round Roast Choice Boneless
$6.22
$6.89
10.70%
Whole Wheat Bread
$2.42
$2.65
9.40%
All Uncooked Beef Roasts
$6.72
$7.35
9.30%
All Ham Ex Canned and Slices
$4.05
$4.40
8.70%
Ground Beef 100% Beef
$4.80
$5.21
8.50%
Ice Cream
$5.56
$6.02
8.20%
White Bread
$1.87
$2.02
8.10%
Navel Orange
$1.49
$1.60
7.80%
Chuck Roast Choice Boneless
$6.86
$7.38
7.60%
Ground Chuck
$4.76
$5.12
7.60%
All Uncooked Ground Beef
$5.19
$5.57
7.30%
Fresh Whole Chicken
$1.83
$1.96
6.80%
Processed American Cheese
$4.66
$4.96
6.30%
All Other Uncooked Beef ExVeal
$6.59
$6.91
4.80%
Lean Ground Beef
$6.39
$6.67
4.50%
All Purpose White Flour
$0.52
$0.54
3.10%
Chocolate Chip Cookies
$4.97
$5.12
2.90%
Boneless Ham Excluding Canned
$5.37
$5.50
2.40%
Boneless Beef for Stew
$6.87
$7.03
2.20%
Potato Chips
$6.28
$6.41
2.00%
Long Grain White Rice
$0.97
$0.99
2.00%
White Potatoes
$0.95
$0.96
1.40%
Malt Beverages
$1.74
$1.75
0.70%
Boneless Chops
$4.56
$4.56
0.00%
All Other Pork Ex Can/Sliced
$3.64
$3.64
0.00%
Bananas
$0.63
$0.63
-0.50%
Lemon
$2.09
$2.07
-0.90%
All Pork Chops
$4.31
$4.26
-1.30%
Red and White Table Wine
$13.66
$13.32
-2.50%
Sliced Bacon
$6.96
$6.77
-2.60%
Spaghetti and Macaroni
$1.43
$1.38
-4.00%
Chicken Legs Bone In
$1.95
$1.86
-4.60%
Fresh Fortified Whole Milk
$4.21
$4.01
-4.80%
Coffee
$6.47
$6.09
-5.80%
Boneless Chicken Breast
$4.35
$4.08
-6.10%
Dried Beans
$1.70
$1.59
-6.40%
Dry Pint Fresh Strawberries
$3.86
$3.57
-7.30%
Center Cut Bone In Chops
$4.67
$4.33
-7.40%
Natural Cheddar Cheese
$6.00
$5.55
-7.50%
Field Grown Tomatoes
$2.23
$2.00
-10.50%
Romaine Lettuce
$3.57
$2.68
-24.80%
Grade A Large Eggs
$4.25
$2.51
-41.00%
Avocado prices, according to the Mexico Products CPI, have risen 27.2 percent from December 2019 (83.80) to December 2023 (106.554). From December 2022 (95.922) to December 2023, they rose 11.1 percent.
Determining the average price of a delivery pizza is more difficult. In local contexts, the price of a slice of pizza can act as an inflationary benchmark of sorts, but estimates indicate that from February 2023 to February 2024 the price of an average delivery pizza has increased from $17.81 to $18.33, or 2.9 percent.
Comparing these numbers with the year-over-year headline and core CPI numbers (3.4 percent and 3.9 percent, respectively), two significant insights emerge. The individual price changes above, over a four- and one-year period, frequently underscore how price indices obscure trends in prices which, at specific times can be considerably graver than the headline figures suggest. Second, that one needn’t be anywhere near Las Vegas to feel the damage of expansionary monetary policies acutely. Well over a year after the lies about Vladimir Putin, gas station owners, ocean shippers, and corporate profits have been told and forgotten, and despite the cynical political impudence of calling a massive green spending bill an “Inflation Reduction Act,” spending Super Bowl Sunday at home in 2024 will be much more expensive than it was in 2023, and vastly more than it was four short years ago.


You must be logged in to post a comment.